This is “Resources and Bathtub Behavior”, chapter 3 from the book Business Strategy (v. 1.0). For details on it (including licensing), click here.
For more information on the source of this book, or why it is available for free, please see the project's home page. You can browse or download additional books there. To download a .zip file containing this book to use offline, simply click here.


Chapter 3 Resources and Bathtub Behavior
Overview
Resources have a special characteristic: They fill and drain over time, like water in a bathtub. This chapter explains this behavior, shows why it is so important, and also does the following:
- explains how to work out what the numbers do when resources fill and drain
- shows where management control lies
- outlines how managers can develop resources through time
3.1 Bathtubs Rule! Resources Fill and Drain
Since a firm’s performance at any time directly reflects the resources available, it is essential that we understand how these resources develop over time and how we can control the process.
Think about the regular customers using your restaurant. These people did not magically come into existence at a particular moment in time; they have become loyal customers. Some have been visiting your restaurant for years; others have begun only recently. There will also be people who used to be customers but then stopped. Perhaps they had a bad meal, got tired of the menu, or found another restaurant they preferred.
This idea is captured in Figure 3.1 "Building and Losing Customers". The tank in the middle holds the number of customers you have right now. To the left is the outside world, where there are many people, some of whom may become future customers. The big “pipe” flowing into the tank has a pump that determines the speed at which the tank stock is filling with new customers. On the right, another pump on a pipe flowing out of the tank shows how quickly you are losing customers, and again you can see people in the outside world who include your former customers. Because the tank in this diagram holds the inventory or “stock” of customers, this diagram is known as a stock-and-flow structure.
Figure 3.1 Building and Losing Customers
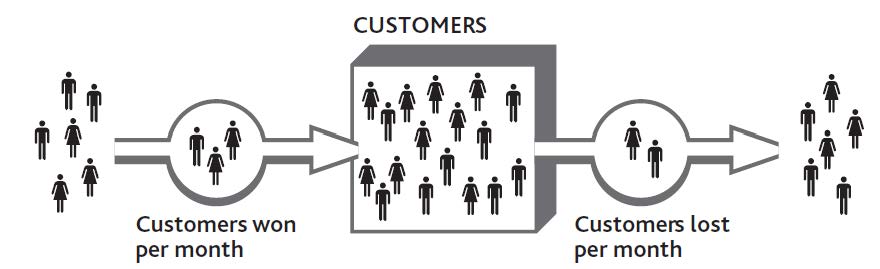
Let us see how this works. By mailing out discount vouchers to local homes, you hope to pump some new consumers into the tank. However, if you do not have enough staff to provide good service, you will inadvertently increase the speed of the outflow pump and soon lose them again. The number of customers will have filled up, but then drained away again.
After customer numbers have fallen back, your staff should be able to provide good service once more. The outflow pump slows, and your tank returns to a more stable state. The process is a familiar one but difficult to estimate over time.
Doing It Right: Focusing on Numbers
The idea of resources filling and draining seems simple enough. After all, we see it happening around us all the time, from the water in our bathtub, to the cash in our bank, to cars in a city, to rabbits in a field. But merely being aware of this process is not enough if we want to take control. We need to know the following:
- how many customers, staff, or other resource there are currently
- how quickly these numbers are changing
- how strongly these factors are being influenced by things under our control and by other forces
Figure 3.2 "Working Out Growth and Loss of Customers Through Time" shows what would happen to the number of customers in your business if you were to win 50 new people per month but also lose an increasing number of customers every month. You lose 40 people in the first month and an extra 5 people every month thereafter.
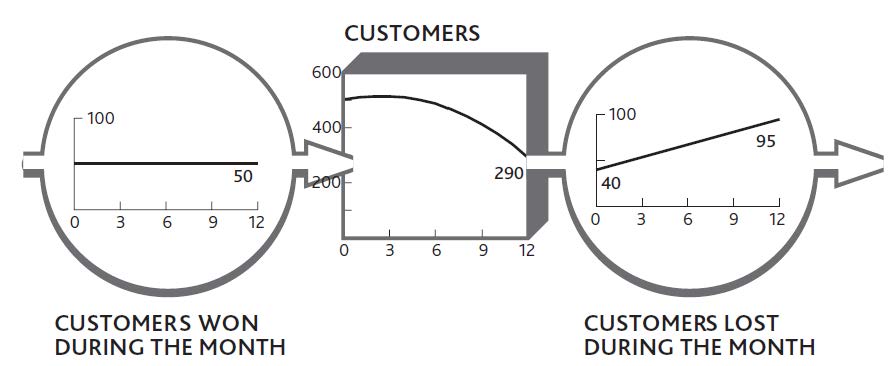
The case was made in Chapter 1 "Performance Through Time" and Chapter 2 "Resources: Vital Drivers of Performance" that you should always be looking at how things change over time, so these monthly numbers, too, can be shown as time charts. We can still keep the image of the bathtub or tank of customers and the pipes and pumps showing the rate at which customers are flowing in and out of your business (Figure 3.3 "The Change in Customer Numbers Over Time").
The idea that resources fill and drain over time has long been recognized in strategy research (Dierickx & Cool, 1989), so what we will do here is make this mechanism practical to use and connect it to how the rest of the business system works.
Figure 3.2 Working Out Growth and Loss of Customers Through Time
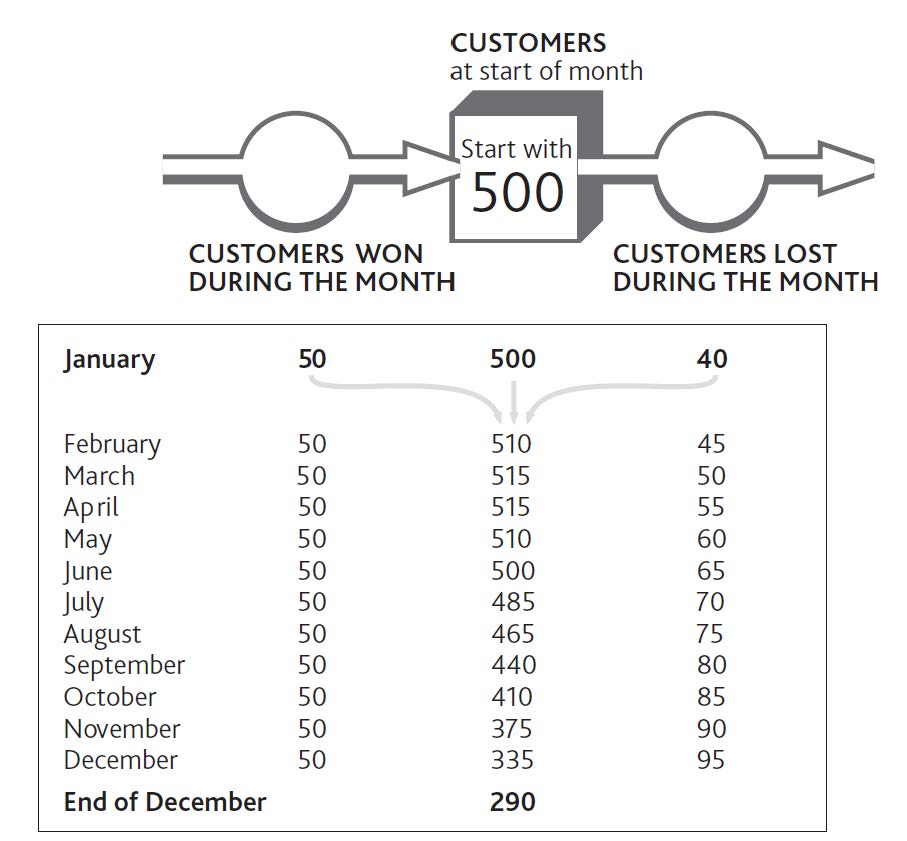
Figure 3.3 The Change in Customer Numbers Over Time
3.2 How Management Control Affects Resources
Why are we so concerned about this “bathtub behavior” that all resources follow? Remember the problem we set out to solve, namely, what determines performance through time and how can management affect performance in the future. The logic is simple:
- The resources in place drive performance at every moment.
- Therefore we must know how the quantity of each resource changes through time.
- These quantities are only explained by their inflows and outflows.
- Thus to manage performance through time, the only way of exerting control is by managing the flows of resources into and out of the system.
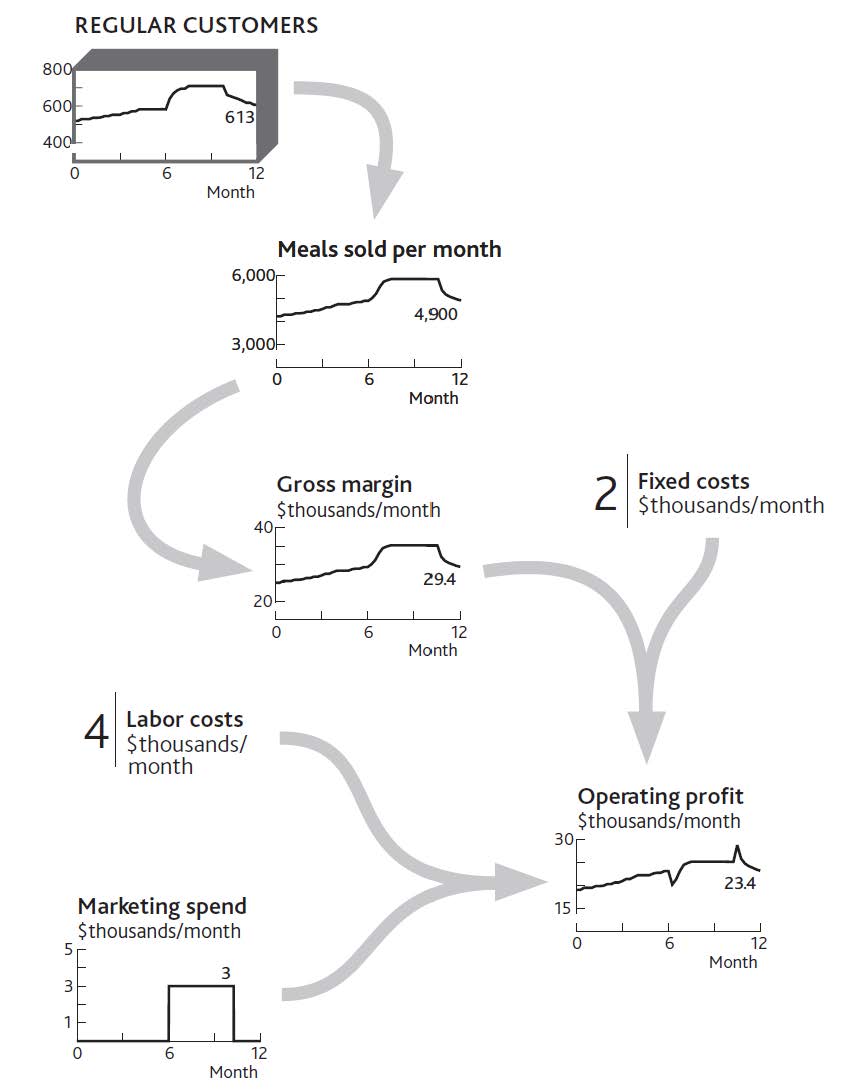
Consider your restaurant and see how these connections work (Figure 3.4 "How Changing Customer Numbers Drives Performance Over Time (for clarity, some items are not shown)"). In Chapter 2 "Resources: Vital Drivers of Performance" we looked at how the number of meals sold and the operating profits had changed during the previous 12 months and showed how these figures were driven by the number of customers and staff. Following the same logic, we next need to know what happened to customers and staff to bring about the performance history in Figure 2.1 "The Explanation for Restaurant Sales and Labor Costs" and the inflows and outflows to these two resources.
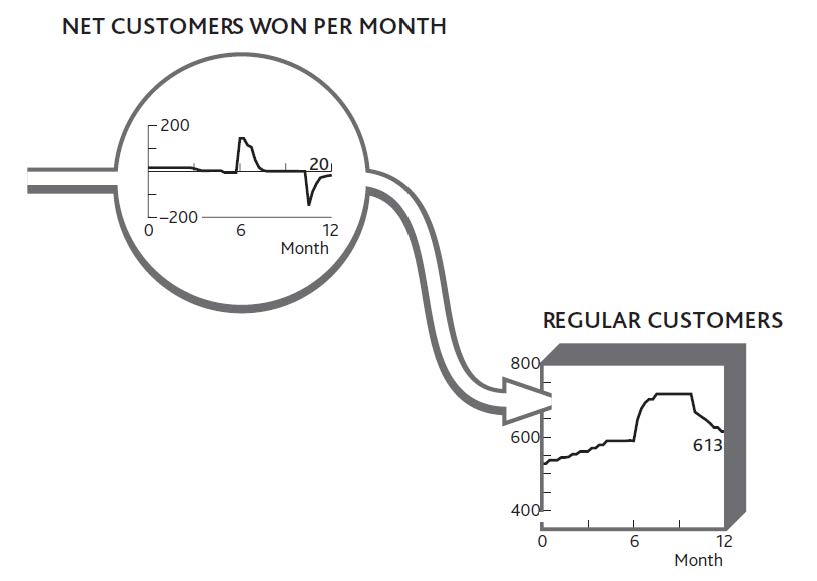
It is crucial to explain why the resource of customers developed over time as it did, and the only way to do this is to understand the flows (Figure 3.5 "The Net Flow of Customers Into and Out of Your Regular Customer Group").
Figure 3.4 How Changing Customer Numbers Drives Performance Over Time (for clarity, some items are not shown)
Doing It Right: Units for Resources and Flows
Figure 3.2 "Working Out Growth and Loss of Customers Through Time" and Figure 3.3 "The Change in Customer Numbers Over Time" label the flows entering and leaving the customer resource as “Customers won/lost during the month.” This is always the relationship between resources and the flows that fill or drain them: Whatever the resource in the tank, the flows are “[resource] per [time period].”
There is never any exception to this rule!
- It looks as if you had an early small inflow of customers, but this slowed.
- So you did some serious marketing, which brought a flood of customers.
- But this soon died away again, and your customer stock settled down at a steady but higher level, with seemingly no inflow or outflow at all.
- Toward the end of the year, you experienced another flood of customers, but this time it was negative (the downward slope on the customer flow): You were losing customers fast.
- Once again the flood soon slowed to a mere trickle and your stock of customers steadied at a lower level, again apparently with no inflow or outflow.
Figure 3.5 The Net Flow of Customers Into and Out of Your Regular Customer Group
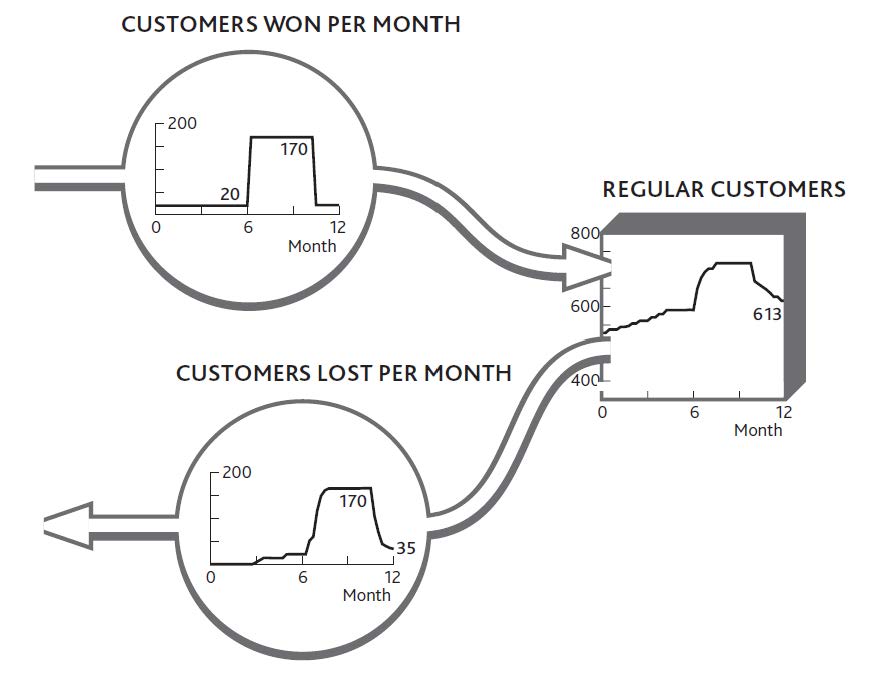
You can put flesh on these bones. By asking your customers if and when they have previously visited, you get a good idea of the inflow rate. Although you cannot easily ask how many people become ex-customers each month (because they are not there to be asked!), you can work out what the outflow must have been to reconcile with the net change each month (Figure 3.6 "The Separate Flows of Customers Into and Out of Your Regular Customer Group").
Figure 3.6 The Separate Flows of Customers Into and Out of Your Regular Customer Group
Doing It Right: Separating Inflows From Outflows
If your restaurant experienced only the flows shown in Figure 3.5 "The Net Flow of Customers Into and Out of Your Regular Customer Group", you might be tempted to take the complacent view that nothing much is happening. Apart from the two puzzling spikes of customer gains around month 7 and losses around month 11, everything seems to be ticking along steadily enough.
But appearances are misleading. During the middle period, turbulent activity is taking place, with lots of customers arriving and many others leaving. In fact, customer churn is so rapid that by months 9 and 10, you are almost certainly losing many of the customers that your marketing efforts brought in just a short time before.
The factors driving resource gains are typically quite different from those driving losses, so you stand little chance of solving these challenges without distinguishing between the two flows.
Always try to identify resource “gain” and “loss” rates separately.
3.3 Developing Resources
External Resources
Trying to build resources can be frustrating. For example, take hiring: Suitable staff may be scarce, and you may have to fight your competitors for the limited number of good people. Even if you win that battle or you have no strong competitors, potential staff may be looking at other opportunities that have nothing to do with the market in which you operate. A customer service person at Ryanair could leave to work in a hotel or even to become a teacher, for example.
At least with staff, there may be a continuous stream of new talent coming onto the market. Many other resources are finite. Once everyone has a cell phone, for example, there is no one left to be won and sales efforts have to switch to upgrades and luring people away from rivals. Similarly, chain stores run out of new locations, airlines run out of good routes that passengers may want to fly, and so on.
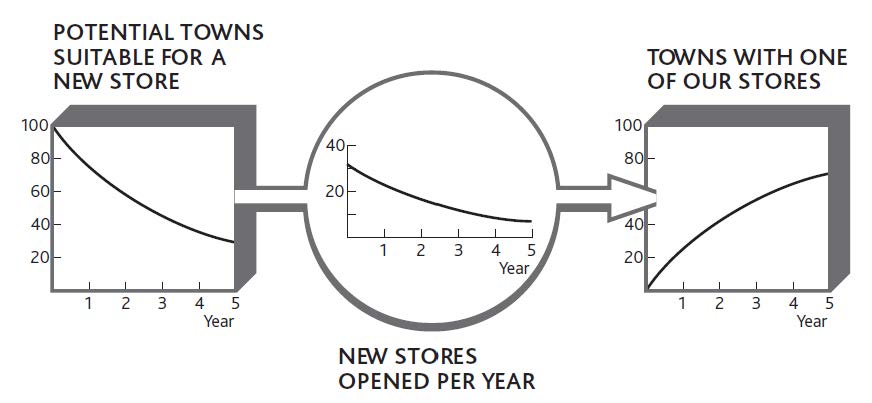
To capture this phenomenon, we need to be explicit about the stock of potential resourcesResources that have to be developed if they are to be turned into active resources. as well as the stock of developed resourcesResources that have been brought newly into a business or a business's internal resources that continue to be developed., plus the rate at which we convert one to the other. Figure 3.7 "Developing Potential Locations for a Retail Chain" shows these elements for a new retail company that has developed a specialty store format and now wants to build outlets in all the towns where it may be successful. On the left are the towns thought to have enough of the right consumers to provide the demand for the stores; there are 100 of these at the outset. On the right is the increasing number of stores operating, and in between is the rate at which stores are being opened.
Figure 3.7 Developing Potential Locations for a Retail Chain
Understanding how to manage the development of resources from a potential pool is vital.
- Identify the scale of potential resources—just how many are there in the potential pool?
- Assess the rate at which the potential resource can be developed.
- Look for ways to accelerate this development rate.
- Look to stimulate growth of the potential resource itself.
The story of Alibaba.com in Chapter 1 "Performance Through Time" is a great example of a company identifying a specific potential resource—the large number of smaller Chinese companies seeking to go global—and developing that potential very rapidly. Once that opportunity was well exploited, it moved on to repeat the trick in other markets.
Resources Within the Business
The challenge of resource development is not confined to the bringing of potential resources into your business system: Certain resources must continue to be developed within the organization. The most common of these is staff, though the same challenge also applies to products and customers.
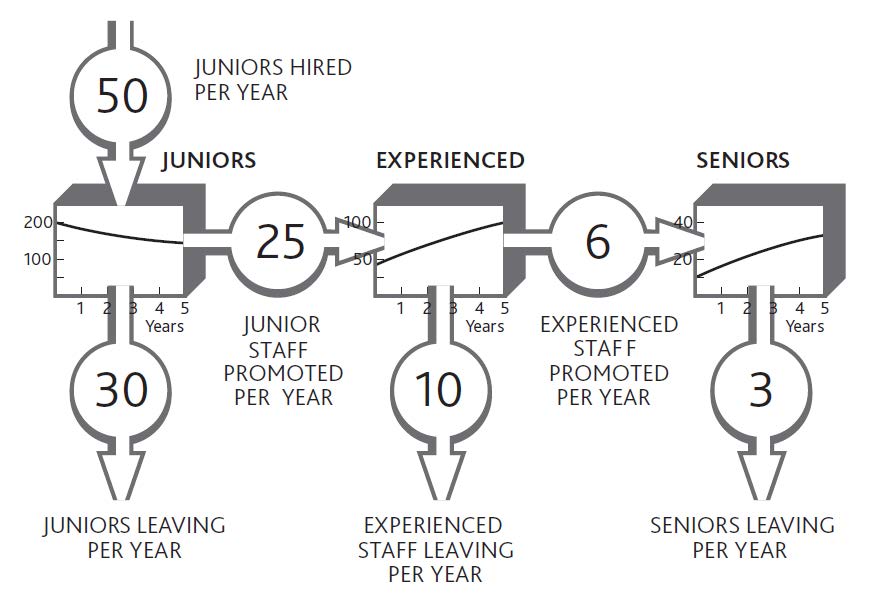
Figure 3.8 "The Staff Promotion Chain" shows an organization that has become badly out of balance because the flows of people through its internal development chain have been running at the wrong rates. At the most senior levels, promotions appear to be happening slowly, at just six per year. But turnover among senior staff is also low, so the upper ranks have become crowded.
The organization has clearly been promoting experienced staff to senior positions faster than other senior people have been leaving. But things are not quite that simple. Promoting 6 experienced people out of 50 each year, as we were in year 1, meant that experienced people had to wait more than 8 years for promotion. By the time we get to year 5, the wait has grown to 20 years, because of the 100 experienced staff we have, only 5 are promoted each year. So reducing the promotion rate risks leaving experienced staff frustrated and may increase the rate at which they leave. Juniors, on the other hand, are not being hired fast enough to replace those who are leaving or are being promoted.
Figure 3.8 The Staff Promotion Chain
Doing It Right: Conserving Resources
Figure 3.8 "The Staff Promotion Chain" illustrates a further critical principle when resources flow from state to state. The sum of these stocks must add up to the total number of staff. They are said to be “mutually exclusive” (i.e., any resource item can appear in only one state at any time) and “collectively exhaustive” (i.e., taken together, they account for all of this resource in the system)—a principle known as MECE (pronounced “mee-see”).
This principle is easily overlooked. It is common, for example, for management to continue talking about a market’s total potential even after most of that potential has already been taken up.
This is why some companies pursue a seemingly perverse staff policy known as “up or out,” in which people are expected to seek promotion and are helped to leave if they are not successful. This can apply all the way up to top levels, where retirement or moving on to other organizations is also encouraged. The policy is all about making space for talented people to progress.
The “Choice Chain”
The last extension of this resource development idea concerns an almost universal phenomenon: the development of awareness, understanding, and choice among customers, employees, investors, donors, and other stakeholder groups (Desmet et al., 1998; Finskud, 2009).
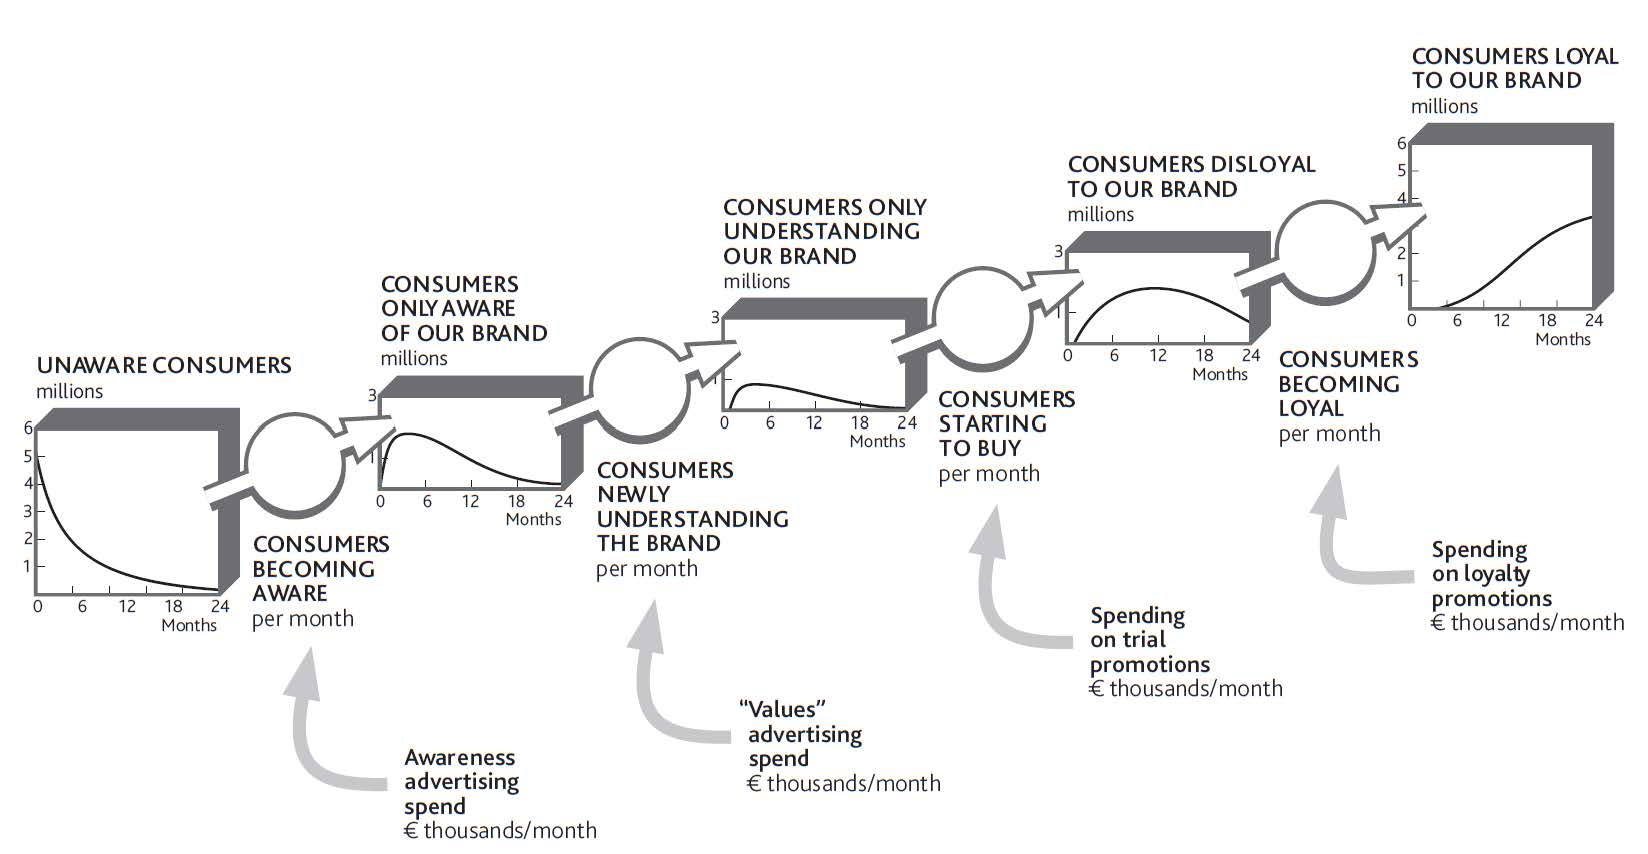
We can start by considering a new consumer brand: a soft drink such as Coca-Cola’s Powerade sports drink, for example. An individual is unlikely to switch on a single day from complete ignorance of the brand to being a regular and loyal consumer. So we do not simply have a tank of “potential” consumers and a tank of “loyal” consumers; rather, consumers move through a series of stages (Figure 3.9 "The Choice Chain for Consumers"):
- Initially, the consumers who we may want will be unaware that our brand exists. The first challenge is to pump them into being aware: ensuring that they will have at least heard of the brand, even if it means nothing to them.
- Once they are aware, we need them to understand the brand and associate meaning with it—preferably a meaning relating to values that are significant for them.
- When they understand that the brand means something they can relate to, we can hope that they will try the brand, at least on a disloyal basis. They may continue purchasing competing brands, but at least we are on their list of options.
- Ideally, we would like consumers to be loyal and always choose our brand. This “certain future choice” is rare, but highly valuable if it can be achieved. Coca-Cola itself has attained this status for many consumers, as have brands such as BMW, Wal-Mart, and CNN.
Now, these pumps are expensive to drive. Every advertising and promotional activity costs money, so it is vital to make judicious choices about which ones to drive and how fast, and how to change priorities as time passes. Moreover, while you are trying to do all this, your pool is draining back down the hillside: Consumers are forgetting why your brand is important to them, choosing to buy other brands, or simply forgetting about it altogether, hence the continuing efforts of even the strongest brands to keep reinforcing consumer choice.
Figure 3.9 The Choice Chain for Consumers
In principle, it looks as if you should drive the lower pumps first, then slow them down while speeding up the upper pumps as your pool gets pushed up the hill. But this qualitative approach simply will not do; you need to know how much of each activity to do at each moment. Many firms get these choices badly wrong.
One innovative industrial products firm consistently underinvests in all stages of this chain. The only reason it can boast of the high proportion of sales derived from new products is that this underinvestment forces sales managers to switch their effort from older products to the latest novelty. No sooner has the company pumped customers to within reach of becoming loyal then it abandons the effort and they slip back down again into the arms of grateful rivals!
In contrast, the pharmaceutical industry commonly overspends on sales. Sales representatives constantly struggle to get to see doctors who already prescribe their product and fully intend to continue doing so. With everyone in the industry making the same futile efforts, it is hardly surprising that one study found only 20% of sales calls in the United States even got to see the doctor and less than half of these calls were remembered (Elling, Fogle, McKhann, & Simon, 2002).
Similar development chains arise for other resources (Sterman, 2000, chap. 12). For some, however, such as product development, you have direct control over how individual items move through the system. Nevertheless, it is still important to know the quantity of resources at each stage and be aware of how your decisions are affecting their development. It is common, for example, for companies to invest effort and cost in developing promising products, only to fail to finalize them and drive them into the market.
Action Checklist: Developing Resources
Work out what is happening over time to the quantity of your resources and what you want to happen in the future. How are the flows of each resource changing? Can you complete a chart like Figure 3.3 "The Change in Customer Numbers Over Time" for your customers, staff, and other critical resources?
Understand the scale of potential resources you are developing. In the case of customers, useful questions to ask include the following:
- How many potential customers are there?
- Does this scarcity impose any constraints on the rate at which you can develop customers in future?
- Is anything happening to the potential customer pool itself? For example, are your efforts and those of competitors filling up the tank of potential customers, even while others are being converted to active customers?
- What exactly defines this overall population? Who are they, and how many of them are there in total?
- Again, what distinct stages do they move through?
- How many are in each stage, and at what rate are they moving up and down the chain?
- Do the numbers add up? Everyone in your defined group should be in one stage, and one stage only, at any moment.
- Is anything happening to the group overall? Are demographic changes bringing new potential customers into existence?
- And, of course, what are you doing, to what extent, that influences these flows, and by how much?