This is “Resources: Vital Drivers of Performance”, chapter 2 from the book Business Strategy (v. 1.0). For details on it (including licensing), click here.
For more information on the source of this book, or why it is available for free, please see the project's home page. You can browse or download additional books there. To download a .zip file containing this book to use offline, simply click here.


Chapter 2 Resources: Vital Drivers of Performance
Overview
Managers already know that building and conserving resources is vital, whether these are tangible items such as staff, cash, and customers, or intangibles such as reputation and investor support. They also understand that resources are interdependent; a firm’s winning product range is of little value if poor delivery damages its reputation.
Resources thus represent the crucial foundation. Leadership, capabilities, vision, and all the other subtle and complex concepts we bring to bear can improve performance only if they help us win and retain the necessary resources. This chapter will do the following:
- explain the link between resources and performance
- show you how to identify resources, keeping the list down to those few simple items that really matter
- explain how to define and measure resources, giving you the quantitative understanding you need to manage and use resources successfully
2.1 What Makes a Resource Valuable?
The idea that resources are important in business performance goes back more than 40 years but took hold strongly during the 1980s. Today, most strategy books for business students include a chapter on analyzing resources (Grant, 2008). Capabilities and competences are related, but different issues. Think of capabilitiesActivities that an organization is good at performing. They are important drivers of an organization's performance through time. as “activities we are good at doing,” whereas resources are “useful things that we have, or can use, even if we don’t own them” (Mainardi, Leinwand, & Lauster, 2008; Stalk, Evans, & Shulman, 1992).
Generally, managers focus on the truly strategic resourcesUnique resources that contribute to one firm's being more profitable than another. in their business—those few special items that might explain why one firm is more profitable than another. It is widely accepted that resources contribute to sustained competitive advantage only if they score well on most of the following questions (Barney, 2006; Collis & Montgomery, 1994).
- Is the resource durable? A resource that quickly deteriorates or becomes obsolete is unlikely to provide sustainable advantage. The more durable the resource, the better.
- Is the resource mobile? Many resources are so easily moved between firms that they provide little sustainable advantage. People are a clear example. The less mobile the resource, the better.
- Is the resource tradable? Resources are particularly mobile if they can be bought and sold. The less tradable the resource, the better.
- Is the resource easily copied? Many resources are easy for competitors to copy, leaving little scope for competitive advantage. The less easily copied the resource, the better.
- Can the resource be substituted by something else? Even if a resource cannot be bought or copied, an alternative serving the same purpose can erode any advantage. Dell Computers, for example, has negligible presence in retail stores, but its direct supply system is a great substitute. Video conferencing and collaborative working over the Web are substitutes for business air travel. The less easily substituted the resource, the better.
- Is the resource complementary with other resources? Some resources work well to support one another. The more complementary the resource, the better.
Of course, any resource you have that is difficult to copy, buy, substitute, and so on can give you an advantage, but these accepted criteria are neither necessary nor sufficient to explain why one firm beats others.
Consider this situation. You and I run competing restaurants that are next door to each other and identical in almost all respects: same size, same menu, same number of staff with the same experience, and the same likelihood that a passing customer will drop in. The only difference is that you have a million dollars in the bank and I do not.
Now, resources do not get more tradable than cash. I could go and raise a million dollars, but it would cost me more in interest than you will make in interest on your million. It would also take time and effort to obtain, assuming, that is, that I could raise the money at all. What could you do with your million dollars? Develop new products, hire more staff, do more marketing, cut your prices for a while. You have a range of options, any one of which could start winning you more customers and sales than I have. Then you can plough back that extra income to build still more advantage.
Moreover, even if I had one of those supposedly strategic resources, you could still beat me. I might have a secret recipe, for example, or exceptionally skilled and loyal staff. All the same, you could quite feasibly overwhelm me simply by spending your extra money on some mundane resources.
This is not just a theoretical game; there are plenty of examples of firms winning with little evidence that they rely on such special resources. Consider McDonald’s: Its operating system is crystal clear. Thousands of executives have been through the company and know its operating manuals from cover to cover. Many have used what they learned to start their own fast-food operations. Yet none has come close to overtaking the leader.
Similar observations apply to Southwest Airlines and Ryanair. The day Ryanair started, any one of thousands of airline executives could have set up the same business. There is nothing mysterious about its operating methods. So the only criterion for strategic resources that remains from the list above is, are your resources “complementary”? In other words, do they work well together?
2.2 Identifying Resources
First, we need to identify resources, and then we need to understand a crucial feature of how they behave. Let us go back to the example of your restaurant and see how we can explain the history of your business performance over the past 12 months, shown in Figure 1.4 "Restaurant Performance Example".
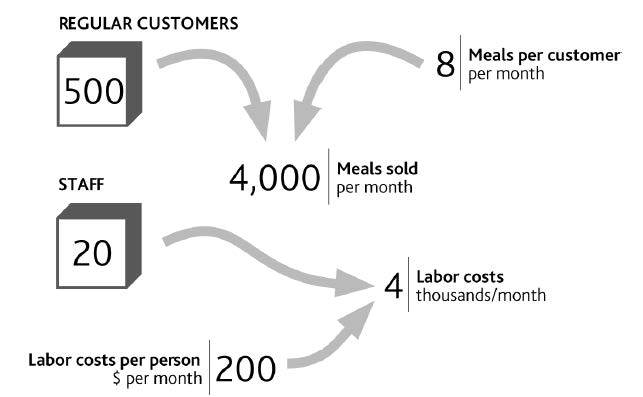
Your restaurant is well known in its local market and largely relies on regular customers who on average visit eight times per month. You estimate that you have about 500 regular customers. You have 20 staff in total, each costing you $200 per month for the hours they work. The explanation for your sales and labor costs are therefore as shown in Figure 2.1 "The Explanation for Restaurant Sales and Labor Costs".
“Regular customers” and “Staff” are shown in boxes here because they are two major tangible resources in this business. Your cash and your restaurant’s seating capacity are two further resources. These items are critically important because if they do not change, neither does your business performance, provided of course that outside conditions such as competitive prices, the frequency with which customers visit your restaurant, and so on do not change either. If these resource levels do change, your profits must change immediately.
The first point to note is that resourcesUseful items that are owned or to which an organization has reliable access. They are the foundation of an organization's performance. are useful items that you own or to which you have reliable access. “Useful” simply means that they contribute to the rest of the business, either directly by providing sales or indirectly by supporting other items. You do not have to possess a resource for it to be useful. You do not “own” customers or agents, for example, but they are still somewhat reliable: There is a good chance that they will be with you tomorrow.
Figure 2.1 The Explanation for Restaurant Sales and Labor Costs
There is, however, one fundamental feature that customers and staff share, along with all other resources: The quantity of a resource that you have today is precisely the total of everything you have ever won minus everything you have ever lost. We will look at the implications of this in Chapter 3 "Resources and Bathtub Behavior". But for now we simply need to connect your restaurant’s resources to sales and costs to create a complete explanation for your operating profit at the start of the year (Figure 2.2 "Your Restaurant’s Resources and Operating Profits").
To understand why customer numbers change through time to create our profit history, we need to learn more about how resources behave. Again, we will cover this in Chapter 3 "Resources and Bathtub Behavior".
2.3 Defining and Measuring Resources
Resources Involved in Airlines
The case of low-fare airline Ryanair from Chapter 1 "Performance Through Time" provides a useful example of business resources and their link to performance. We can take part of the airline’s financial history, add data on certain resources, and lay them out in the same graphical form that we used for your restaurant (Figure 2.3 "Explanation of Ryanair’s Revenue from 1995 to 2006, and a Possible Future to 2011"). Operating profitA company's earnings before interest and tax., on the right of the diagram, comes from revenues minus costs. Revenues result from the number of journeys made by customers and the average revenue from each journey (the fare paid by the passenger plus other items they may buy). “Journeys” do not equate with “customers,” however, since customers may travel several times in the course of a year.
Doing It Right: What Our Diagrams Mean
Word-and-arrow diagrams that at first sight look like Figure 2.1 "The Explanation for Restaurant Sales and Labor Costs" and Figure 2.2 "Your Restaurant’s Resources and Operating Profits" are common in business books. Often, though, all they mean is that two items have some general connection.
The diagrams used in this book are different. Every element within them has a specific meaning. The boxes denote resources. The curved arrows indicate that one item can be immediately calculated or estimated from another, as with a formula in a spreadsheet. For example, if you know how many regular customers you have and the frequency with which they buy, you can estimate sales volume; and if you know sales volume and price, you can calculate revenue.
Figure 2.2 Your Restaurant’s Resources and Operating Profits
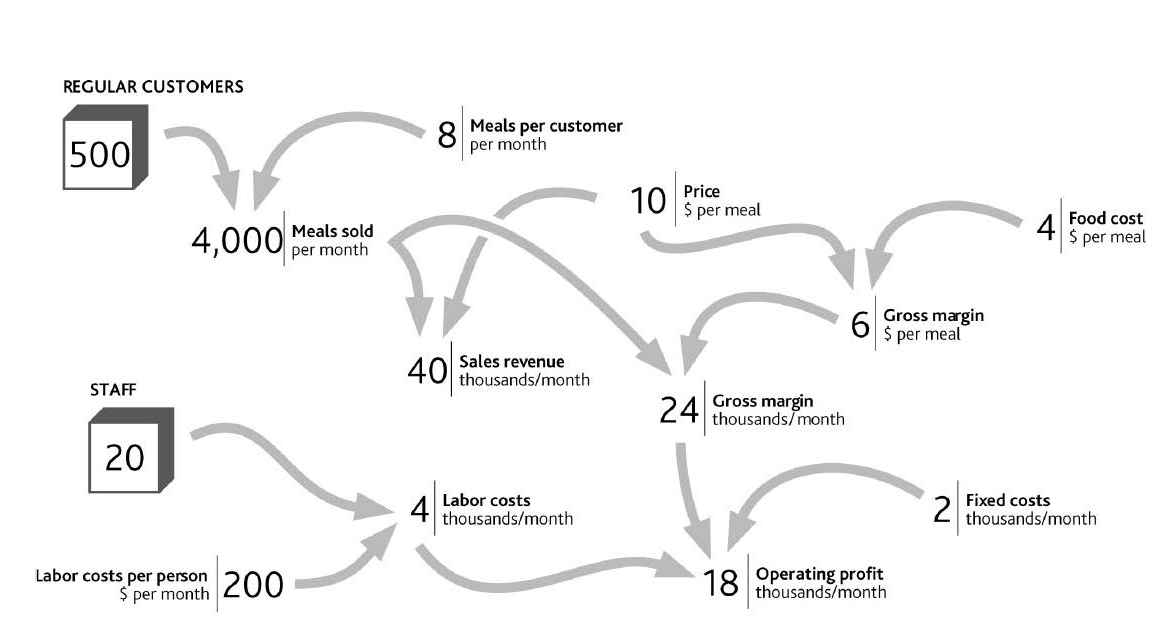
Figure 2.3 Explanation of Ryanair’s Revenue from 1995 to 2006, and a Possible Future to 2011
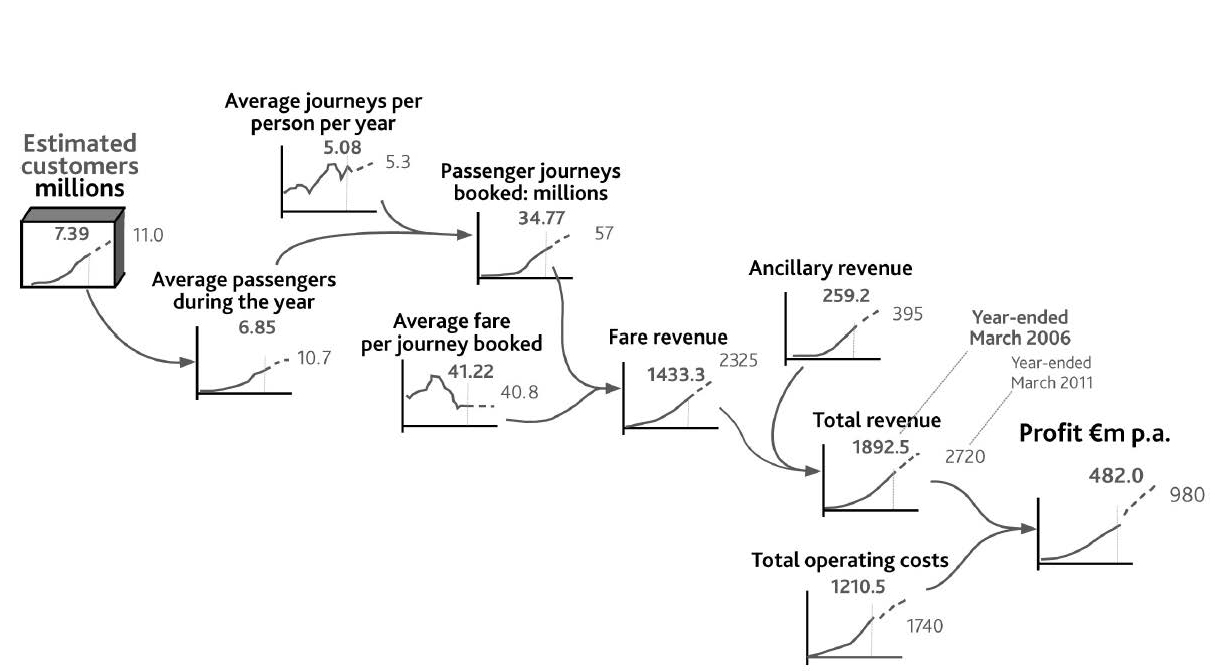
The number of people who travel on Ryanair and the frequency with which they do so are not public knowledge, so we have used indications of plausible historical values. Nevertheless, a number of individuals do travel frequently; others regularly, but less often; and others only occasionally.
Note that, just as customer numbers have driven journeys and revenues up to 2006 (solid lines, bold text values), they will continue to do so into the future, so the exhibit also shows numbers the company might aim for in 2011 (dashed lines and normal text values).
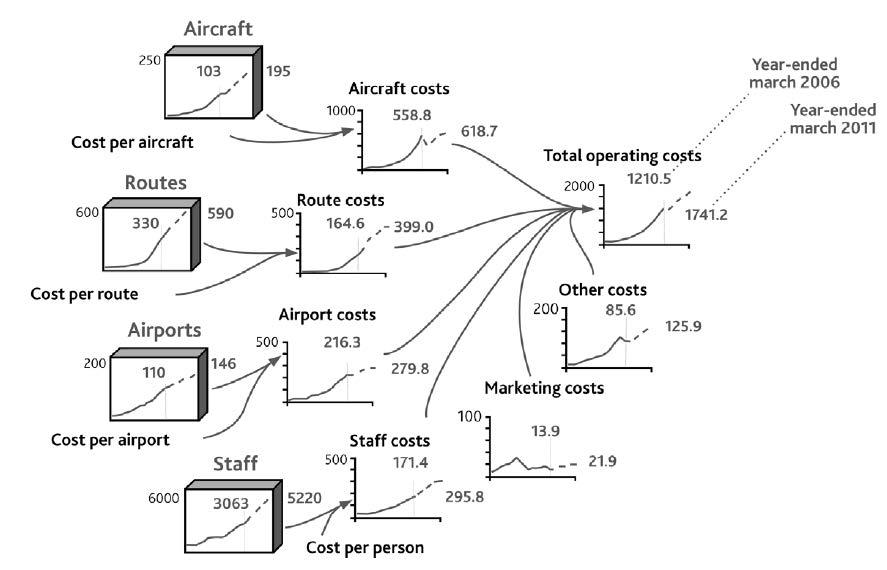
To get the profit number shown on the right of Figure 2.3 "Explanation of Ryanair’s Revenue from 1995 to 2006, and a Possible Future to 2011", we also need an explanation for the history and possible future of Ryanair’s costs. These are driven by other resources (Figure 2.4 "Explanation of Ryanair’s Costs"). Staff numbers drive salaries, aircraft incur fixed operating costs, and there are minimum costs involved in operating each route. An important detail is still missing, however. CostsThe value of money or resources used to produce some product or service. are not driven only by having resources. It is also costly to win, develop, and keep resources. It is costly, for example, to start operations at a new airport, to hire staff, and to acquire aircraft.
Figure 2.4 Explanation of Ryanair’s Costs
Note that this picture of the company’s results is not merely a diagrammatic display of the arithmetic of its profit and loss statement. It is a rigorous, causal explanation. It therefore provides the start of a sound “theory” of performance. Theory has something of a bad reputation among executives. Believing (correctly!) that management is a practical profession, many see theoretical concepts as the opposite of what should concern them. They also have good reason to be skeptical about theory, given its patchy record when it comes to providing good advice for organizations. Consequently, few theories are used by management or consulting firms for designing strategy or making strategic decisions. However, executives use some kind of theory every time they make a decision, since they have assumptions about what the consequences will be and why (Christensen & Raynor, 2003). We need to ensure they use good theory!
Standard Types of Resource
The airline case features a number of resources shown in the “tanks” on the left of Figure 2.3 "Explanation of Ryanair’s Revenue from 1995 to 2006, and a Possible Future to 2011" and Figure 2.4 "Explanation of Ryanair’s Costs". These four items are examples of some standard and commonly encountered types of resources:
- Passengers are the customers that determine demand.
- Airports and routes are effectively the airline’s product range.
- Aircraft constitute its capacity.
- Staff are the human resources that operate the whole thing.
Resources often fall into two basic categories: those that drive demand for the product (passengers for our airline) and those that are needed to create the supply of the product (routes, planes, and staff, in this case).
Demand-Side Resources
The obvious demand-side resourceResources such as customers (primary) and intermediaries (secondary). is customers. There is one special case in which firms do not have identifiable customers: when they sell into commodity markets such as those for oil, minerals, and agricultural products. For just about everyone else, customers or clients are most important.
However, customers alone may not be all you need to enjoy demand for your product. In many cases you can reach your ultimate customers only through dealers or other intermediaries: another demand-side resource. Producers of fast-moving consumer goods (FMCGs) have supermarket companies as their immediate customers, but they ultimately depend on consumers wanting their products. Intel sells processors to computer makers, who sell to stores and resellers, who sell to companies and consumers. All three groups are vital in determining demand for Intel’s products.
Demand-driving resources also arise in noncommercial cases. Charities serving the needs of groups suffering disability or homelessness experience demand that reflects the number of people in the group they seek to serve. Nor is demand always a desirable factor: The rate of crime that places demand on police forces reflects the number of criminals.
One thing to be careful about is choosing a performance objective that is itself a resource. For example, DVD rental firm Netflix, whose attack on Blockbuster’s stores we discussed in Chapter 1 "Performance Through Time", is typical of many firms that feature objectives for customer numbers. Cell phone operators and TV broadcasters also choose to set targets for customer numbers, since they are the key driver of revenues.
Supply-Side Resources
On the supply sideResources such as products and services (primary) and production capacity and people (secondary)., the first resource is the products and services that an organization offers in order to satisfy demand. Your restaurant has its menu, a car manufacturer has a range of models, and a law firm has the range of legal services it can provide.
Doing It Right: Numbers Matter
Although our list of common resource types may be helpful, the fundamental principle in identifying the core resources involved in your specific situation is to work back from the performance you want to explain. This is where sticking to the numbers is so helpful. If you want to explain the “sales” number, you must, in most cases, know the number of customers. If you want to explain “labor costs,” you must know the number of staff, and so on. So start from the chart of performance over time that is bothering you, work back through the way each variable is calculated, and sooner or later you will bump into one or more of these things that fill up and drain away through time.
Next, you need some production capacity to manufacture or produce your product or service: the capacity of your kitchen to cook meals, or a carmaker’s factories and equipment that enable it to manufacture cars at a certain rate.
Making the whole system work requires people: Your restaurant’s cooks and waiters, a carmaker’s production-line workers, and a law firm’s lawyers are all resources that enable the organization to function. In certain cases, the production capacity itself may largely be made up of people. The capacity of a law firm, for example, consists of the lawyers who do the work.
Noncommercial organizations have many close parallels to these supply-side resources. Voluntary groups and public utilities offer services and sometimes products to their beneficiaries. Housing charities, health services, and police forces all need capacity to deliver their services. All of these rely on their staffs to deliver their services.
If you are concerned with a functional strategy challenge rather than the overall performance of the organization, Chapter 1 "Performance Through Time" mentioned that you will have objectives for indicators relating specifically to that function, such as staff turnover or product launch rate. Here, too, it is possible that you might focus on an objective that is itself a resource. A law firm or an education service, for example, may well have targets to build staff numbers (lawyers or teachers) to certain levels by a certain date.
Financial Resources
We must not forget money! Cash itself is a resource and definitely obeys the rules for resources. The quantity of cash in your bank account today is precisely the sum of all cash ever added to the account minus all cash ever taken out. Debt can be thought of as a “negative” resource.
Action Checklist: Define and Quantify Resources Driving Performance
From Chapter 1 "Performance Through Time", you should have a sound time chart of past and future performance describing the challenge your organization is facing. The next step is to work back along the logical path of factors that account for the values on that chart.
Here are some tips for laying out the link from performance back to the resources that drive it:
- Put your performance time chart to the right of your page.
- Ask what this performance outcome is calculated from (e.g., profit = sales – costs). Put time charts for these items to the left and connect them with arrows to the time chart of the performance outcome (see Figure 2.3 "Explanation of Ryanair’s Revenue from 1995 to 2006, and a Possible Future to 2011").
- If you are not focusing on overall financial outcomes as much as some less tangible outcome, such as customer service quality, you may not have such precise arithmetic relationships. Service quality, for example, may depend on “average staff workload.” Nevertheless, do try to specify this causal factor precisely in a way that you can quantify.
- Continue asking the question “what causes what” to work back across the page to the left, adding time charts and connections as you go. Stick firmly to the rule that if you know items to the left, you can calculate or estimate the values of items they link to on the right.
- Repeat this until you hit one or more “resource” items. You should not need to make more than two to four links before you hit these items, and you should not find very many of these resources (refer back to examples of typical resources described in this chapter).
Beware of being tempted by relationships that are outside the organization. Sales, for example, are not determined by “market size” multiplied by “market share,” but by “customers” multiplied by “sales per customer.” (Market size is the sum of all companies’ sales, and market share is your sales divided by this total.)
If your objective is itself a resource (e.g., to grow the number of customers or staff to some scale by some point in time), there is good news. You do not need to do any of this! You can simply move on to the next step in Chapter 3 "Resources and Bathtub Behavior".