This is “Cash Flows from Investing and Financing Activities”, section 17.4 from the book Business Accounting (v. 2.0). For details on it (including licensing), click here.
For more information on the source of this book, or why it is available for free, please see the project's home page. You can browse or download additional books there. To download a .zip file containing this book to use offline, simply click here.
17.4 Cash Flows from Investing and Financing Activities
Learning Objectives
At the end of this section, students should be able to meet the following objectives:
- Analyze the changes in assets that are not operating assets to determine cash inflows and outflows from investing activities.
- Analyze the changes in liabilities (that are not operating liabilities) and stockholders’ equity accounts to determine cash inflows and outflows from financing activities.
- Recreate journal entries to determine the individual effects on ledger accounts where several cash transactions have occurred.
Determining Cash Flows from Investing Activities
Question: As shown in Figure 17.9 "The Walt Disney Company Investing Activity Cash Flows for Year Ended October 2, 2010", The Walt Disney Company reported a net cash outflow of over $4.5 billion as a result of investing activities undertaken during the year ended October 2, 2010.
Figure 17.9 The Walt Disney Company Investing Activity Cash Flows for Year Ended October 2, 2010

This section of Disney’s statement of cash flows shows that a number of transactions involving assets (other than operating assets such as inventory and accounts receivable) created this $4.5 billion reduction in cash. Information about management decisions is readily available. For example, a potential investor can see that officials chose to spend over $2.1 billion in cash during this year in connection with Disney’s parks, resorts and other property. Interestingly, this expenditure level is approximately 20 percent higher than the monetary amount invested in those assets the previous year. With a strong knowledge of financial accounting, a portrait of a business and its activities begins to become clear.
After the various cash amounts are determined, conveyance of this information does not appear particularly complicated. How does a company arrive at the investing activity figures that are disclosed within the statement of cash flows?
Answer: Here, the accountant is not interested in assets such as inventory, accounts receivable, and prepaid rent because they are included within operating activities. Instead, each of the other asset accounts (land, buildings, equipment, patents, trademarks, and the like) is investigated to determine the individual transactions that took place during the year. The amount of every cash change is identified and reported. A sale of land can create a cash inflow whereas the acquisition of a building may well require the payment of some amount of cash.
The difficulty in this process frequently comes from having to sort through multiple purchases and sales to compute the exact amount of cash involved in each transaction. At times, determining the individual cash effects can resemble the work needed to solve a puzzle with many connecting pieces. Often, the journal entries that were made originally must be replicated. Even then, the cash portion of these transactions may have to be determined by mathematical logic. To illustrate, assume that the Hastings Company reports the account balances that appear in Figure 17.10 "Account Balances to Illustrate Cash Flows from Investing Activities".
Figure 17.10 Account Balances to Illustrate Cash Flows from Investing Activities
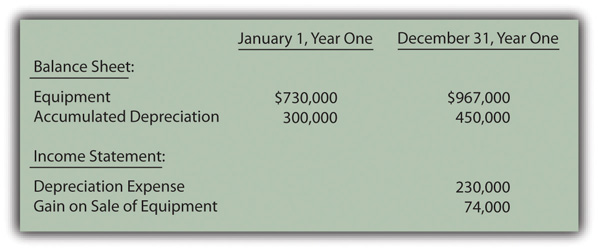
In looking through the financial records maintained by this business, assume the accountant finds two additional pieces of information about the accounts in Figure 17.10 "Account Balances to Illustrate Cash Flows from Investing Activities":
- Equipment costing $600,000 was sold this year for cash.
- Other equipment was acquired, also for cash.
Sale of equipment. This transaction is analyzed first because the cost of the equipment is already provided. However, the accumulated depreciation relating to the disposed asset is not known. The accountant must study the available data to determine that missing number because that balance is also removed when the asset is sold.
Accumulated depreciation at the start of the year was $300,000 but depreciation expense of $230,000 was then reported as shown in Figure 17.10 "Account Balances to Illustrate Cash Flows from Investing Activities". This expense was apparently recognized through the year-end adjustment recreated in Figure 17.11 "Assumed Adjusting Entry for Depreciation".
Figure 17.11 Assumed Adjusting Entry for Depreciation

The depreciation entry increases the accumulated depreciation account to $530,000 ($300,000 plus $230,000). However, the end-of-year balance is not $530,000 but only $450,000. What caused the $80,000 drop in this contra asset account?
Accumulated depreciation represents the cost of a long-lived asset that has already been expensed. Virtually the only situation in which accumulated depreciation is reduced is the disposal of the related asset. Here, the accountant knows equipment was sold. Although the amount of accumulated depreciation relating to that asset is unknown, the assumption can be made that the sale caused this reduction of $80,000. No other possible decrease in accumulated depreciation is mentioned.
Thus, the accountant believes equipment costing $600,000 but with accumulated depreciation of $80,000 (and, hence, a net book value of $520,000) was sold. The amount received must have created the $74,000 gain that is shown in the reported balances in Figure 17.10 "Account Balances to Illustrate Cash Flows from Investing Activities".
A hypothetical journal entry can be constructed in Figure 17.12 "Assumed Journal Entry for Sale of Equipment" from this information.
Figure 17.12 Assumed Journal Entry for Sale of Equipment

This journal entry only balances if the cash received is $594,000. Equipment with a book value of $520,000 was sold during the year at a reported gain of $74,000. Apparently, $594,000 was the cash received. How does all of this information affect the statement of cash flows?
- A cash inflow of $594,000 is reported within investing activities. It is labeled something like “cash received from sale of equipment.”
- Depreciation of $230,000 is eliminated from net income in computing the cash flows from operating activities because this expense had no impact on cash flows.
- In determining the cash flows from operating activities, the $74,000 gain is also eliminated from net income. The $594,000 cash collection comes from an investing activity rather than an operating activity.
Purchase of equipment. According to the information provided, another asset was acquired this year but its cost is not provided. Once again, the accountant must puzzle out the amount of cash involved in the transaction.
The equipment account began the year with a $730,000 balance. The sale of equipment costing $600,000 was just discussed. This transaction should have dropped the ledger account to $130,000 ($730,000 less $600,000). However, at the end of the period, the amount reported for this asset is actually $967,000. How did the cost of equipment rise from $130,000 to $967,000? If no other transaction is mentioned, the most reasonable explanation is that additional equipment was acquired at a cost of $837,000 ($967,000 less $130,000). Unless information is available indicating that part of this purchase was made on credit, the journal entry that was recorded originally must have been made as shown in Figure 17.13 "Assumed Journal Entry for Purchase of Equipment".
Figure 17.13 Assumed Journal Entry for Purchase of Equipment

At this point, the changes in all related accounts (equipment, accumulated depreciation, depreciation expense, and the gain on sale of equipment) have been used to determine the two transactions for the period and their related cash inflows and outflows. In the statement of cash flows for this company, the investing activities are listed as shown in Figure 17.14 "Statement of Cash Flows—Investing Activities".
Figure 17.14 Statement of Cash Flows—Investing Activities

Test Yourself
Question:
The following accounts appear on Red Company’s balance sheets at the beginning and end of Year One:
Figure 17.15
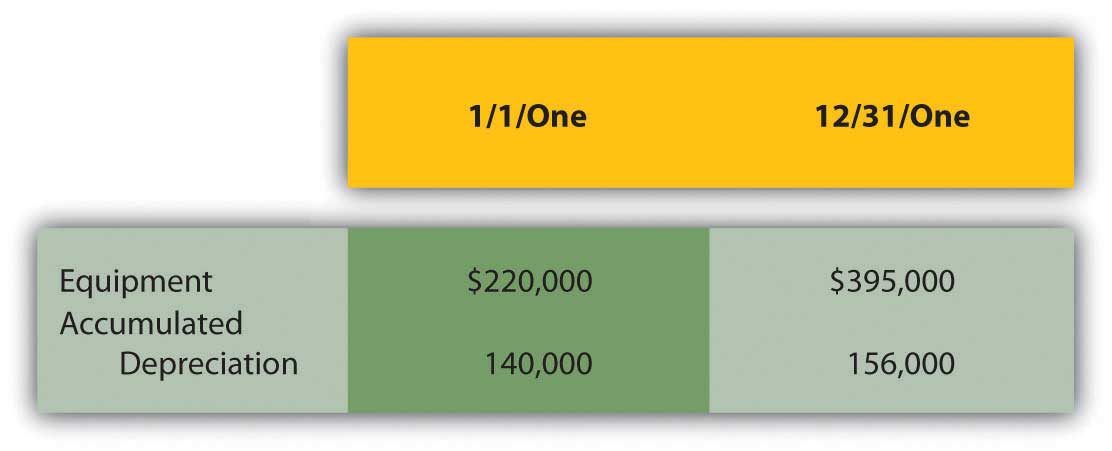
During Year One, equipment with an original cost of $30,000 and accumulated depreciation of $18,000 was sold at a loss of $3,000. What is the cash received on the sale of that equipment?
- $9,000
- $12,000
- $15,000
- $16,000
Answer:
The correct answer is choice a: $9,000.
Explanation:
The book value of this equipment is $12,000 ($30,000 cost less $18,000 accumulated depreciation). Because the equipment was sold at a loss of $3,000, cash received must have been only $9,000 ($12,000 less $3,000). The transaction can also be recreated through the following entry.
Figure 17.16

The loss is eliminated from income in determining the cash flows from operating activities. If the direct method is used, the loss is simply omitted. If the indirect method is used, the loss (because it is a negative within net income) is added back to net income. The $9,000 cash inflow appears in the investing activity section of the statement of cash flows.
Test Yourself
Question:
The following accounts appear on White Company’s balance sheets at the beginning and end of Year One.
Figure 17.17
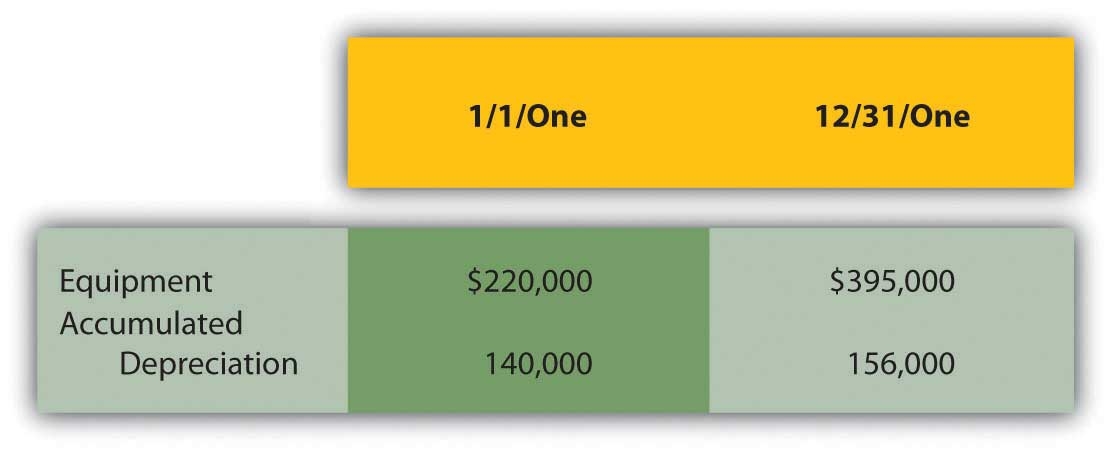
One piece of equipment—with an original cost of $30,000 and accumulated depreciation of $18,000—was sold at a loss of $3,000. On a statement of cash flows, what amount should be reported as cash paid for additional equipment bought during the period?
- $145,000
- $175,000
- $205,000
- $235,000
Answer:
The correct answer is choice c: $205,000.
Explanation:
Based on the information provided, the equipment account decreased by the $30,000 cost of the asset that was sold. The reported balance would have fallen from $220,000 to $190,000. At year’s end, equipment was not reported as $190,000 but rather as $395,000. With no other transactions mentioned, the $205,000 increase from $190,000 to $395,000 must have been created by purchase of additional equipment. This $205,000 acquisition appears in the investing activities section as a cash outflow.
Test Yourself
Question:
The following accounts appear on Blue Company’s balance sheets at the beginning and end of Year One.
Figure 17.18

Equipment with an original cost of $30,000 and accumulated depreciation of $18,000 was sold at a loss of $3,000. What is the depreciation expense recognized during the year and, if the indirect method is used, how is this reported in the statement of cash flows?
- $19,000 is subtracted from net income
- $28,000 is added to net income
- $34,000 is added to net income
- $46,000 is subtracted from net income
Answer:
The correct answer is choice c: $34,000 is added to net income.
Explanation:
Because of the sale of equipment, accumulated depreciation drops by $18,000 from $140,000 to $122,000. By the end of Year One, the account is $156,000. Accumulated depreciation only increases as a result of recording depreciation expense. The increase from $122,000 to $156,000 points to an expense of $34,000. Depreciation is a negative noncash item in net income and is removed in presenting cash flows from operating activities. With the indirect method is used, depreciation is added back.
Determining Cash Flows from Financing Activities
Question: For the year ended January 2, 2011, Johnson & Johnson reported a net cash outflow from financing activities of over $4.9 billion. Within the statement of cash flows, this total was broken down into seven specific categories as replicated in Figure 17.19 "Financing Activity Cash Flows Reported by Johnson & Johnson for Year Ended January 2, 2011".
Figure 17.19 Financing Activity Cash Flows Reported by Johnson & Johnson for Year Ended January 2, 2011
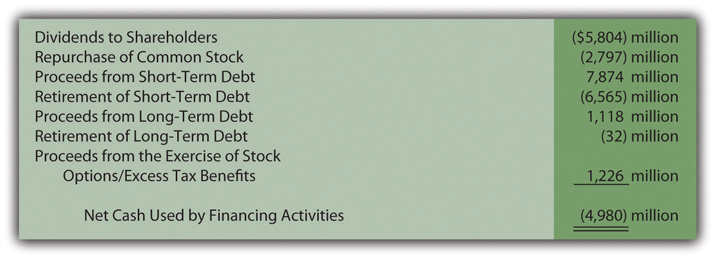
In preparing a statement of cash flows, how does a company such as Johnson & Johnson determine the amounts that were paid and received as a result of its various financing activities?
Answer: As has been indicated, financing activities reflect transactions that are not part of a company’s central operations and involve either a liability or a stockholders’ equity account. Johnson & Johnson paid over $5.8 billion in cash dividends in this year and nearly $2.8 billion to repurchase common stock (treasury shares). During the same period, approximately $7.9 billion in cash was received from borrowing money on short-term debt and another $1.1 billion from long-term debt. None of these amounts are directly associated with the company’s operating activities. However, they do involve either liabilities or stockholders’ equity accounts and are appropriately reported as financing activities.
The procedures used in determining the cash amounts to be reported as financing activities are the same as demonstrated above for investing activities. The change in each relevant balance sheet account is analyzed to determine cash payments and receipts. In starting this process, many liabilities such as accounts payable, rent payable, and salaries payable are ignored because they relate only to operating activities. However, the remaining liabilities and all stockholders’ equity accounts must be studied. The recording of individual transactions can be replicated so that the cash effect is isolated.
To illustrate, various account balances for the Hastings Corporation are presented in the schedule included in Figure 17.20 "Account Balances to Illustrate Cash Flows from Financing Activities".
Figure 17.20 Account Balances to Illustrate Cash Flows from Financing Activities
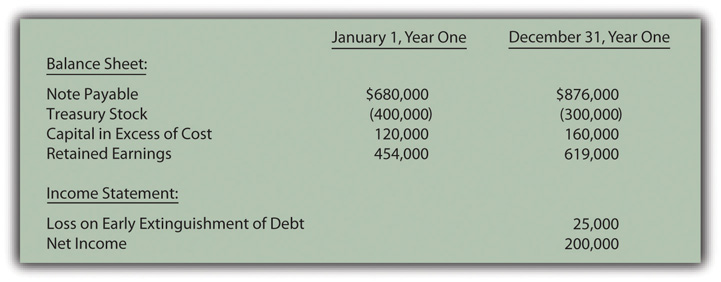
In examining the financial records for the Hastings Corporation for this year, the accountant finds several additional pieces of information:
- Cash of $400,000 was borrowed by signing a note payable with a local bank.
- Another note payable was paid off prior to its maturity date because of a drop in interest rates.
- Treasury stock was reissued to the public for cash.
- A cash dividend was declared and distributed.
Once again, the various changes in each account balance can be analyzed to determine the cash flows, this time to be reported as financing activities.
Borrowing on note payable. Complete information about this transaction is available. Hastings Corporation received $400,000 in cash from a bank by signing a note payable. Figure 17.21 "Assumed Journal Entry for Signing of Note Payable" provides the journal entry to record the incurrence of this liability.
Figure 17.21 Assumed Journal Entry for Signing of Note Payable

On a statement of cash flows, this transaction is listed within the financing activities as a $400,000 cash inflow.
Paying note payable. Incurring the $400,000 debt raises the note payable balance from $680,000 to $1,080,000. By the end of the year, this account only shows a total of $876,000. The company’s notes payable have decreased in some way by $204,000 ($1,080,000 less $876,000). According to the information gathered by the accountant, a debt was paid off this year prior to maturity. In addition, the general ledger reports a $25,000 loss on the early extinguishment of a debt. When a bond or note is settled before its maturity, a penalty payment is often required. Once again, the journal entry for this transaction can be recreated by logical reasoning as shown in Figure 17.22 "Assumed Journal Entry for Extinguishment of Debt".
Figure 17.22 Assumed Journal Entry for Extinguishment of Debt

To balance this entry, cash of $229,000 must have been paid. Spending this amount of money to extinguish a $204,000 liability creates the $25,000 reported loss. The cash outflow of $229,000 relates to a liability and is, thus, listed on the statement of cash flows as a financing activity.
Issuance of treasury stock. This equity balance reflects the cost of all repurchased shares. During the year, the total in the T-account fell by $100,000 from $400,000 to $300,000. Apparently, $100,000 was the cost of the company’s shares reissued to the public. At the same time, the capital in excess of cost balance rose from $120,000 to $160,000. That $40,000 increase in contributed capital must have been created by this issuance since no other stock transaction is mentioned. The shares were sold for more than their purchase price. The journal entry must have looked like the one presented in Figure 17.23 "Assumed Journal Entry for Sale of Treasury Stock".
Figure 17.23 Assumed Journal Entry for Sale of Treasury Stock

If the original cost of the treasury stock was $100,000 and $40,000 was added to the capital in excess of cost, the cash inflow from this transaction had to be $140,000. Cash received from the issuance of treasury stock is reported as a financing activity of $140,000 because it relates to a stockholders’ equity account.
Distribution of dividend. A dividend has been paid to the company’s stockholders, but the amount is not shown in the information provided. However, other information is available. Net income for the period was reported as $200,000. Those profits increase retained earnings. As a result, the beginning balance of $454,000 increases to $654,000. Instead, retained earnings only rose to $619,000 by the end of the year. The unexplained drop of $35,000 ($654,000 less $619,000) must have resulted from the payment of the dividend. No other possible reason is given for this reduction. The appropriate journal entry is found in Figure 17.24 "Assumed Journal Entry for Payment of Dividend". Hence, a cash dividend distribution of $35,000 is shown within the statement of cash flows as a financing activity.
Figure 17.24 Assumed Journal Entry for Payment of Dividend

In this example, four specific financing activity transactions have been identified as created changes in cash. This section of Hasting’s statement of cash flows can be created in Figure 17.25 "Statement of Cash Flows—Financing Activities". All the sources and uses of this company’s cash (as related to financing activities) are apparent from this schedule. Determining the cash amounts can take some computational logic, but the information is then clear and useful.
Figure 17.25 Statement of Cash Flows—Financing Activities

Test Yourself
Question:
The Abraham Company begins the year with bonds payable having a reported balance of $600,000. The ending balance is $700,000. This company’s income statement for the year reports a gain on extinguishment of bond of $9,000. During the year, new bonds were issued at their face value of $300,000. How much cash was paid for the bonds that were extinguished?
- $191,000
- $209,000
- $291,000
- $309,000
Answer:
The correct answer is choice a: $191,000.
Explanation:
The issuance of $300,000 in new debt would increase the liability balance from $600,000 to $900,000. However, the account ended the year at only $700,000. The unexplained reduction of $200,000 must have been the face value of the debt paid off ($900,000 less $700,000). Because a gain of $9,000 was recognized on this transaction, the company managed to eliminate the debt by paying only $191,000.
Test Yourself
Question:
The Oregon Company’s total stockholders’ equity on January 1 was $870,000. By the end of the year, stockholders’ equity had risen to $990,000. This company bought treasury stock this year. The shares had originally been issued for $120,000 but were reacquired for $150,000. In addition, Oregon reported net income for the year of $340,000. No other stock transactions occurred but a cash dividend was paid. How much should Oregon report on the statement of cash flows for the dividend distribution?
- $50,000
- $60,000
- $70,000
- $80,000
Answer:
The correct answer is choice c: $70,000.
Explanation:
Acquisition of the treasury stock reduces stockholders’ equity by $150,000 while net income increases it by $340,000. If nothing else took place, stockholders’ equity at the end of the period would be $1,060,000 ($870,000 less $150,000 but plus $340,000). Instead, the ending total is actually $990,000. Because only the dividend distribution is left to include, it must have been the amount needed to reduce stockholders’ equity to its final reported total ($70,000 or $1,060,000 less $990,000).
Key Takeaway
In determining cash flows from investing activities, current assets such as inventory, accounts receivable, and prepaid rent are ignored because they relate to operating activities. The accountant then analyzes all changes that have taken place in each remaining asset such as buildings and equipment. Hypothetical journal entries can be recreated to replicate the impact of each transaction and lead to the amount of cash involved. For financing activities, a similar process is applied. Liabilities such as accounts payable, interest payable, and salaries payable are not excluded; they only impact operating activities. Monetary changes in the remaining liabilities (notes and bonds payable, for example) and all stockholders’ equity accounts are analyzed. Again, the journal entries that were recorded to report individual events can be recreated so that the cash amounts are known. Once all changes in these accounts have been determined, the various sections of the statement of cash flows can be produced.
Talking with a Real Investing Pro (Continued)
Following is the conclusion of our interview with Kevin G. Burns.
Question: Many investors watch the movement of a company’s reported net income and earnings per share and make investment decisions based on increases or decreases. Other investors argue that the amount of cash flows generated by operating activities is really a more useful figure. When you make investing decisions are you more inclined to look at net income or the cash flows generated by operating activities?
Kevin Burns: As I have said previously, net income and earnings per share have a lot of subjectivity to them. Unfortunately, cash flow information can be badly misused also. A lot of investors seem fascinated by the calculation of EBITDA which is the company’s earnings before interest, taxes, depreciation, and amortization. I guess you could say that determining EBITDA is like blending net income and cash flows. But, to me, interest and taxes are real cash expenses so why exclude them? The biggest mistake I ever made as an investor or financial advisor was putting too much credence in EBITDA as a technique for valuing a business. Earnings are earnings and that is important information. A lot of analysts now believe that different cash flow models should be constructed for different industries. If you look around, you can find cable industry cash flow models, theater cash flow models, entertainment industry cash flow models, and the like. I think that is a lot of nonsense. You have to obtain a whole picture to know if an investment is worthwhile. While cash generation is important in creating that picture so are actual earnings and a whole lot of other financial information found in a company’s annual report.


