This is “Rectangular Coordinate System”, section 3.1 from the book Beginning Algebra (v. 1.0). For details on it (including licensing), click here.
For more information on the source of this book, or why it is available for free, please see the project's home page. You can browse or download additional books there. To download a .zip file containing this book to use offline, simply click here.


3.1 Rectangular Coordinate System
Learning Objectives
- Plot points using the rectangular coordinate system.
- Calculate the distance between any two points in the rectangular coordinate plane.
- Determine the midpoint between any two points.
Rectangular Coordinate System
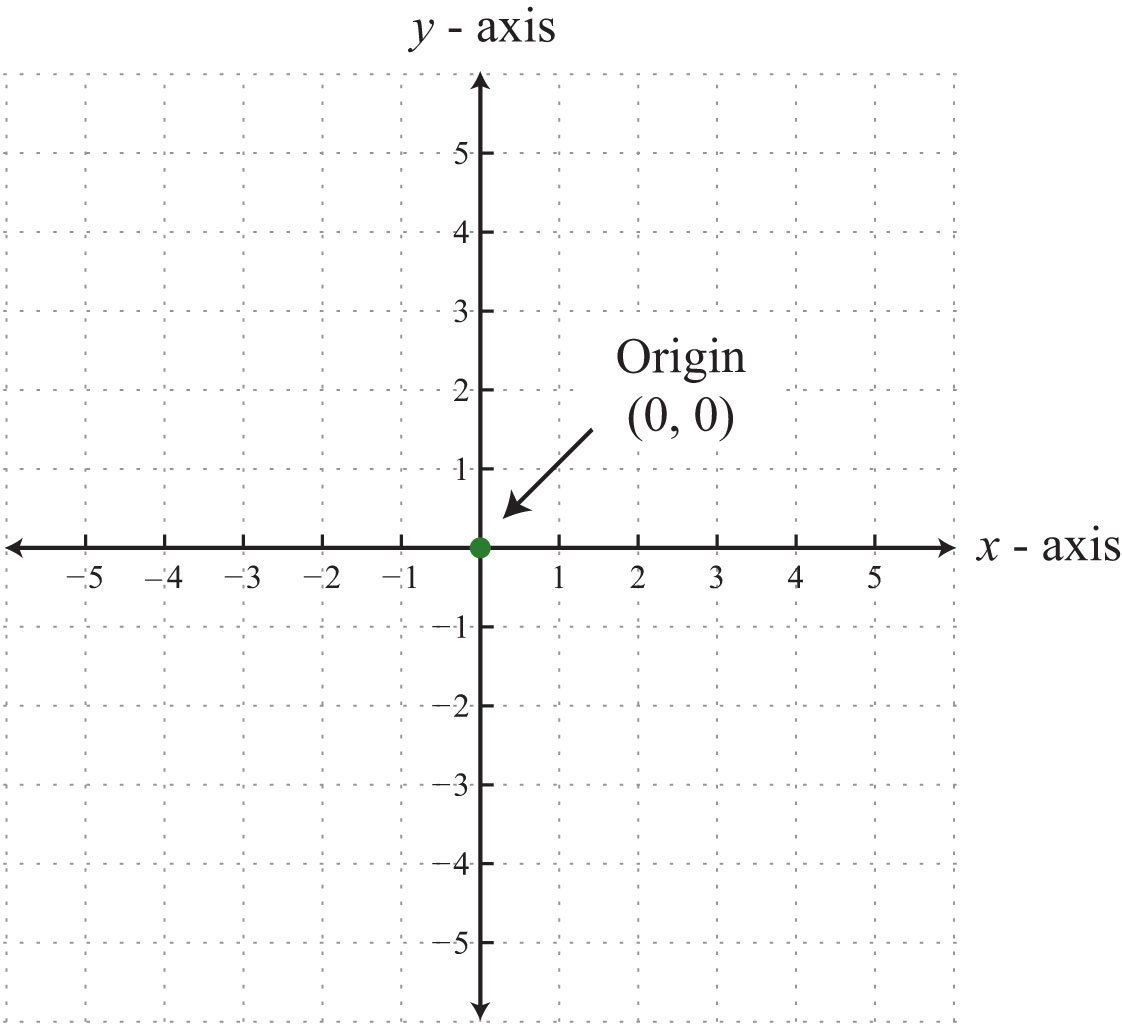
The rectangular coordinate systemA system with two number lines at right angles uniquely specifying points in a plane using ordered pairs (x, y). consists of two real number lines that intersect at a right angle. The horizontal number line is called the x-axisThe horizontal number line used as reference in the rectangular coordinate system., and the vertical number line is called the y-axisThe vertical number line used as reference in the rectangular coordinate system.. These two number lines define a flat surface called a planeThe flat surface defined by the x- and y-axes., and each point on this plane is associated with an ordered pairA pair (x, y) that identifies position relative to the origin on a rectangular coordinate plane. of real numbers (x, y). The first number is called the x-coordinate, and the second number is called the y-coordinate. The intersection of the two axes is known as the originThe point where the x- and y-axes cross, denoted by (0, 0)., which corresponds to the point (0, 0).
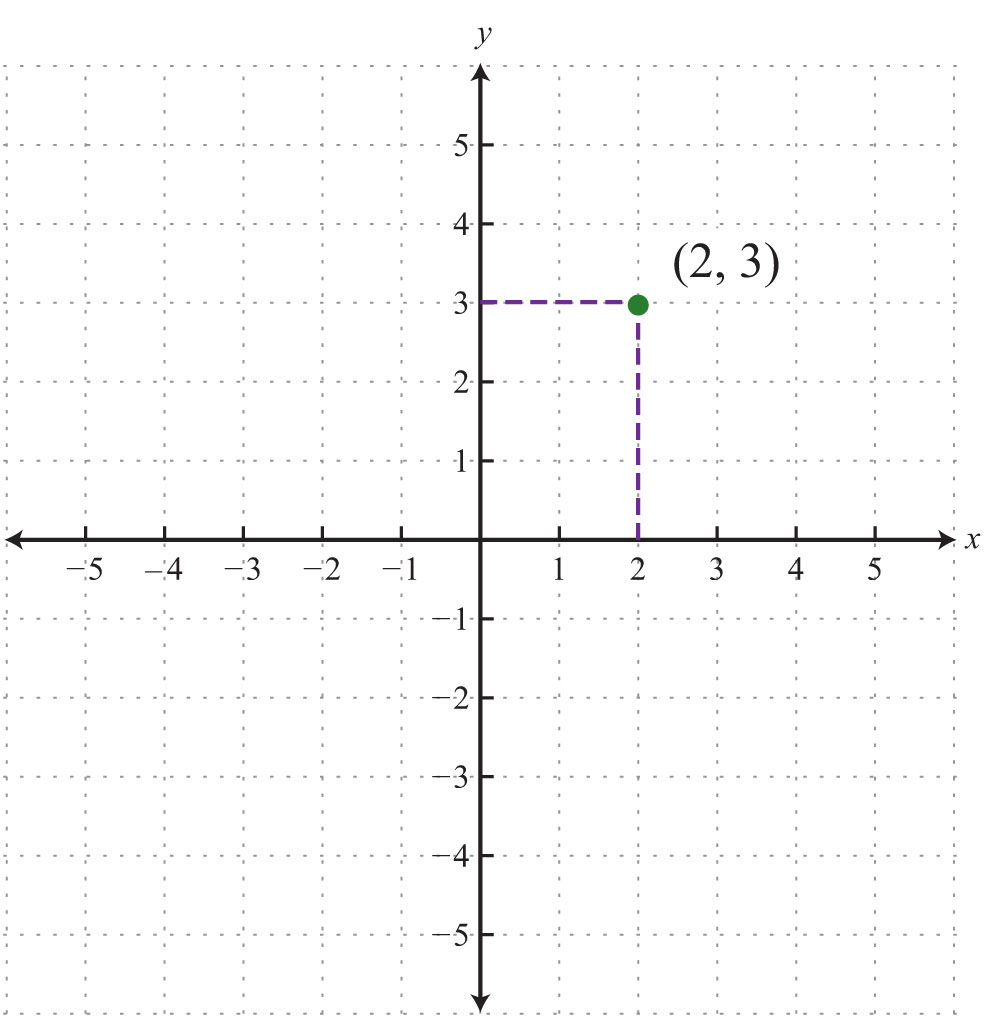
An ordered pair (x, y) represents the position of a point relative to the origin. The x-coordinate represents a position to the right of the origin if it is positive and to the left of the origin if it is negative. The y-coordinate represents a position above the origin if it is positive and below the origin if it is negative. Using this system, every position (point) in the plane is uniquely identified. For example, the pair (2, 3) denotes the position relative to the origin as shown:

Portrait of René Descartes (1596–1650) after Frans Hals, from http://commons.wikimedia.org/wiki/File:Frans_Hals_-_Portret_van_Ren%C3%A9_Descartes.jpg.
This system is often called the Cartesian coordinate systemUsed in honor of René Descartes when referring to the rectangular coordinate system., named after the French mathematician René Descartes (1596–1650).
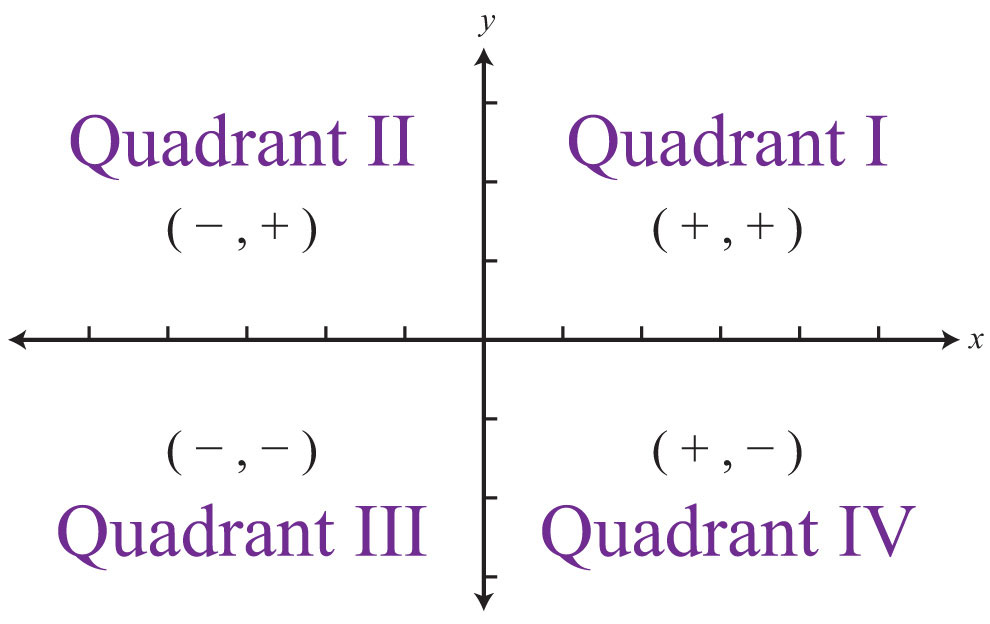
The x- and y-axes break the plane into four regions called quadrantsThe four regions of a rectangular coordinate plane partly bounded by the x- and y-axes and numbered using the roman numerals I, II, III, and IV., named using roman numerals I, II, III, and IV, as pictured. In quadrant I, both coordinates are positive. In quadrant II, the x-coordinate is negative and the y-coordinate is positive. In quadrant III, both coordinates are negative. In quadrant IV, the x-coordinate is positive and the y-coordinate is negative.
Example 1: Plot the ordered pair (−3, 5) and determine the quadrant in which it lies.
Solution: The coordinates and indicate a point 3 units to the left of and 5 units above the origin.
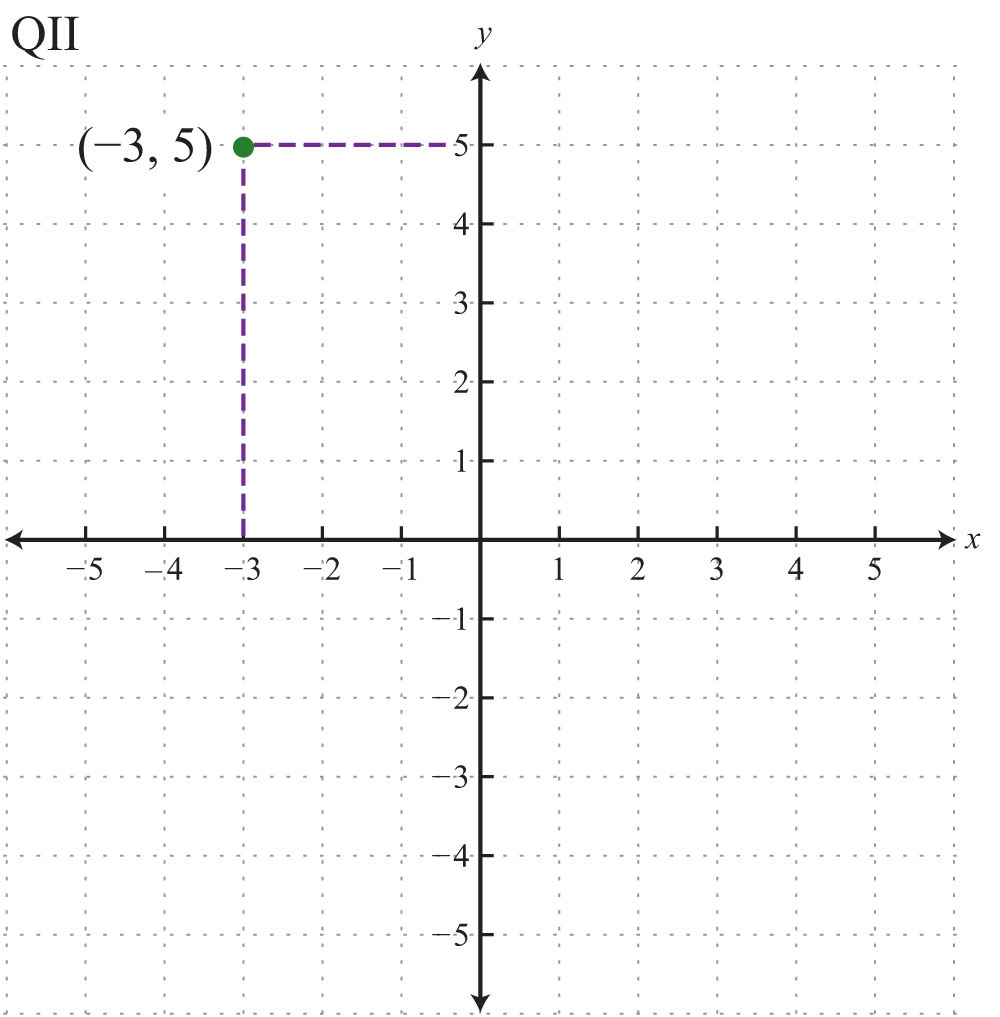
Answer: The point is plotted in quadrant II (QII) because the x-coordinate is negative and the y-coordinate is positive.
Ordered pairs with 0 as one of the coordinates do not lie in a quadrant; these points are on one axis or the other (or the point is the origin if both coordinates are 0). Also, the scale indicated on the x-axis may be different from the scale indicated on the y-axis. Choose a scale that is convenient for the given situation.
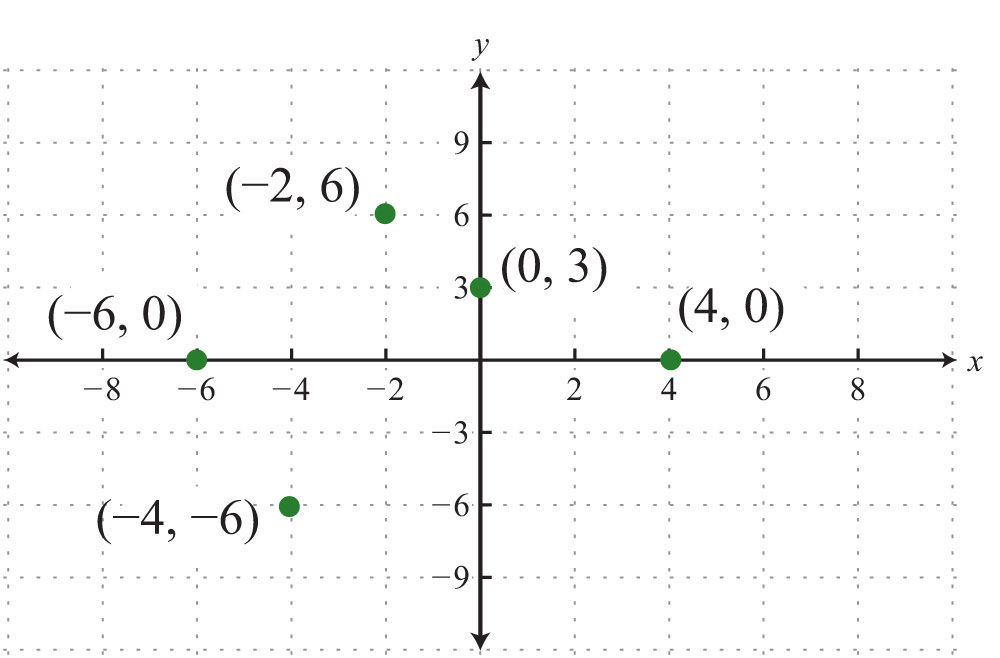
Example 2: Plot this set of ordered pairs: {(4, 0), (−6, 0), (0, 3), (−2, 6), (−4, −6)}.
Solution: Each tick mark on the x-axis represents 2 units and each tick mark on the y-axis represents 3 units.
Example 3: Plot this set of ordered pairs: {(−6, −5), (−3, −3), (0, −1), (3, 1), (6, 3)}.
Solution:
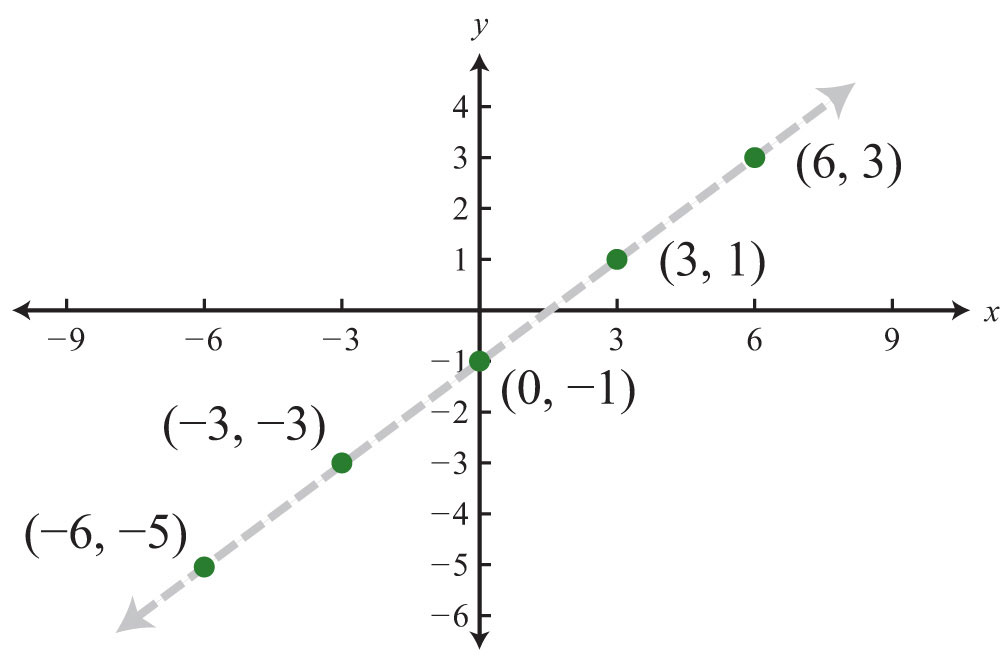
In this example, the points appear to be collinearDescribes points that lie on the same line., or to lie on the same line. The entire chapter focuses on finding and expressing points with this property.
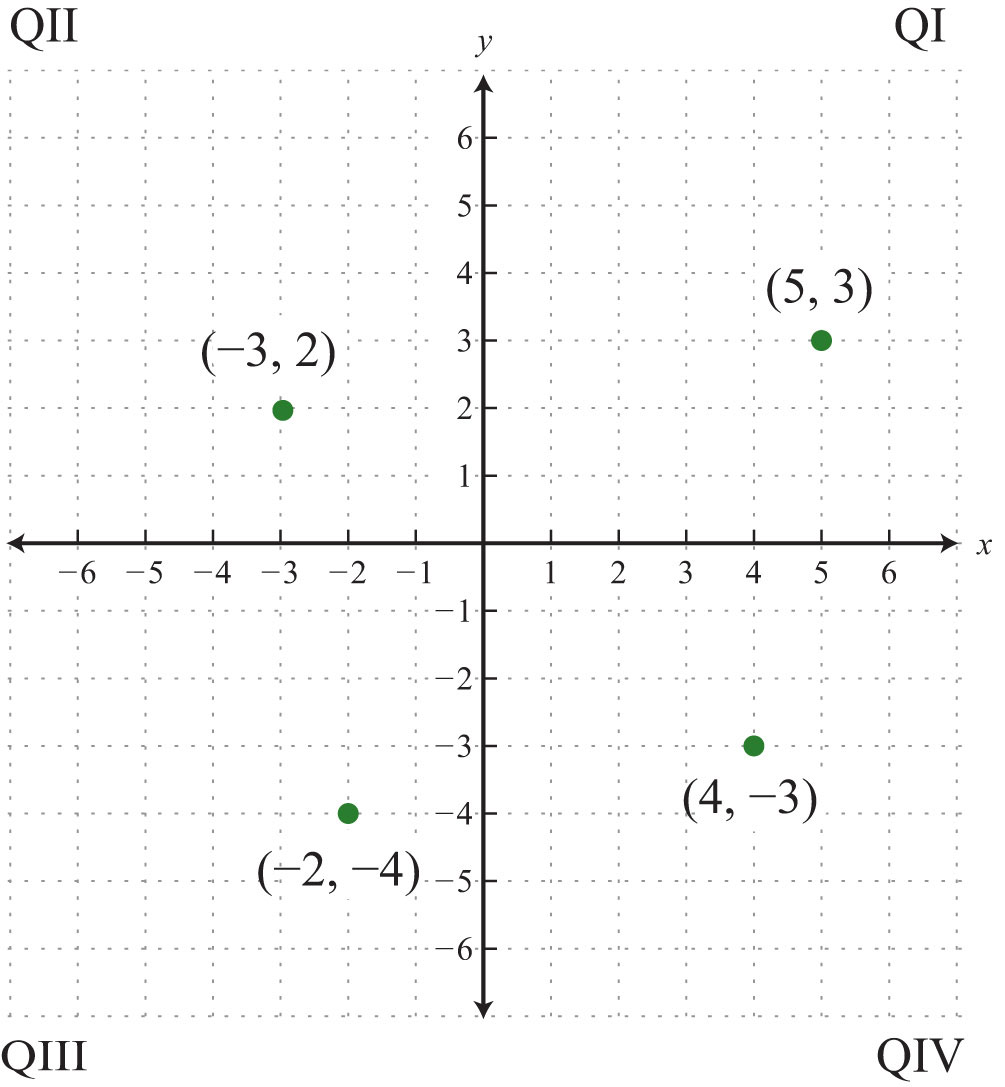
Try this! Plot the set of points {(5, 3), (−3, 2), (−2, −4), (4, −3)} and indicate in which quadrant they lie. ([Link: Click here for printable graph paper in PDF.])
Answer:
Video Solution
(click to see video)Graphs are used in everyday life to display data visually. A line graphA set of related data values graphed on a coordinate plane and connected by line segments. consists of a set of related data values graphed on a coordinate plane and connected by line segments. Typically, the independent quantity, such as time, is displayed on the x-axis and the dependent quantity, such as distance traveled, on the y-axis.
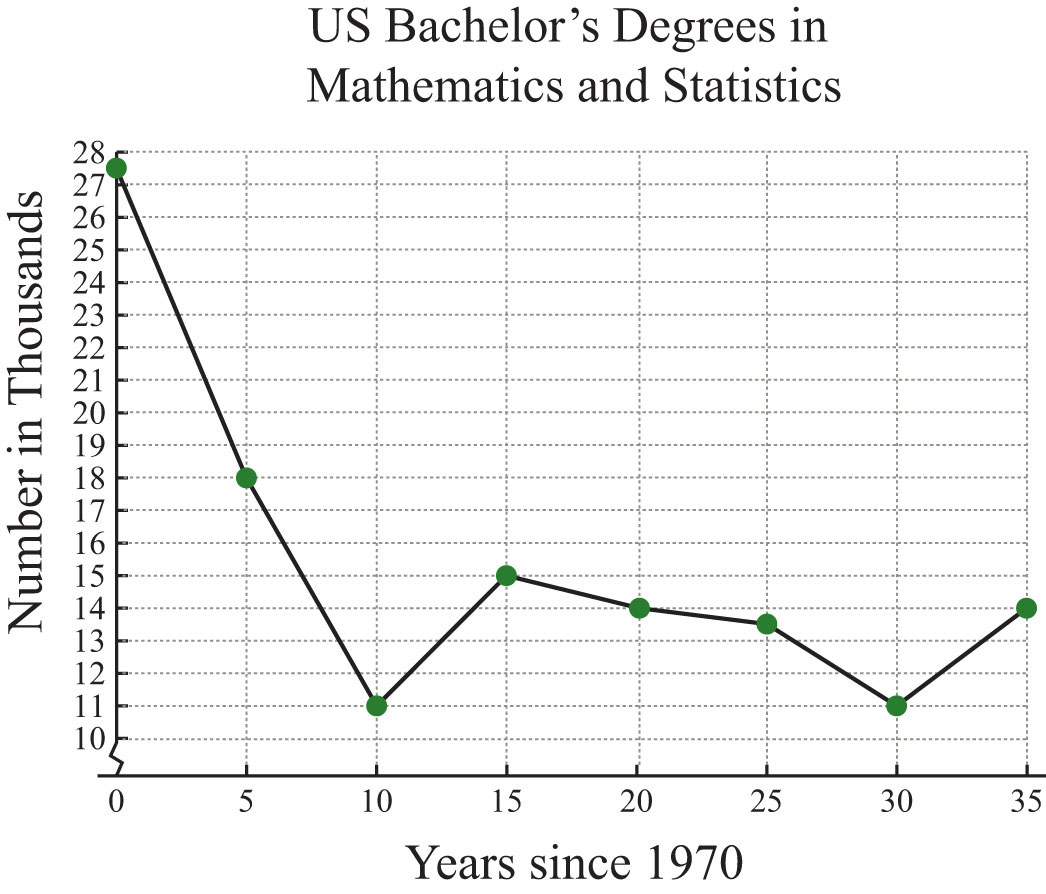
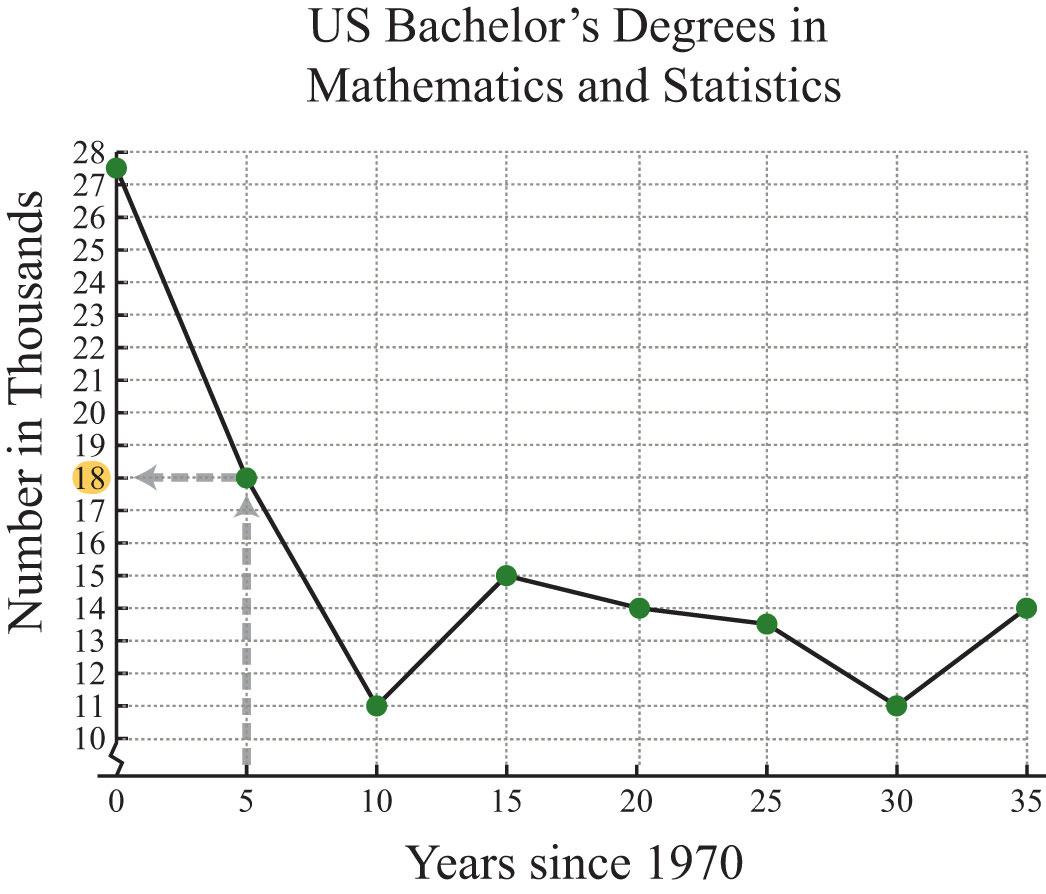
Example 4: The following line graph shows the number of mathematics and statistics bachelor’s degrees awarded in the United States each year since 1970.
Source: Digest of Education Statistics.
a. How many mathematics and statistics bachelor’s degrees were awarded in 1975?
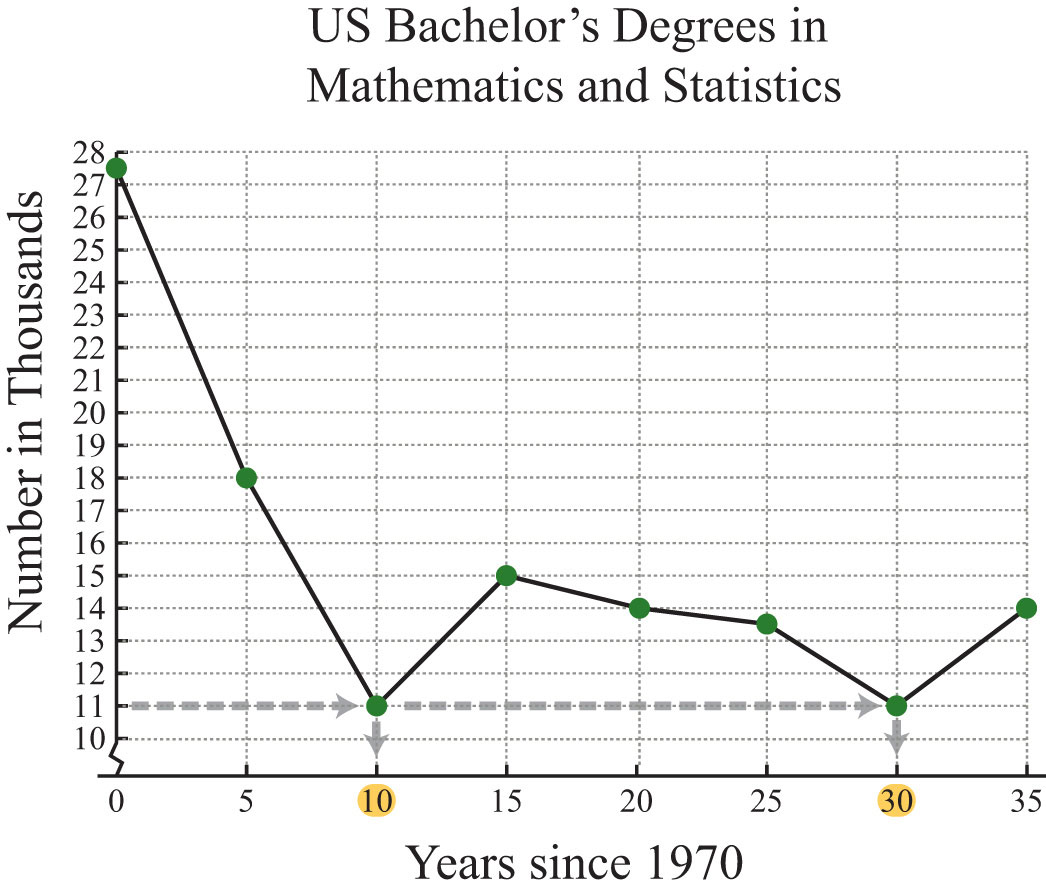
b. In which years were the number of mathematics and statistics degrees awarded at the low of 11,000?
Solution:
a. The scale on the x-axis represents time since 1970, so to determine the number of degrees awarded in 1975, read the y-value of the graph at x = 5.
Source: Digest of Education Statistics.
The y-value corresponding to x = 5 is 18. The graph indicates that this is in thousands; there were 18,000 mathematics and statistics degrees awarded in 1975.
b. To find the year a particular number of degrees was awarded, first look at the y-axis. In this case, 11,000 degrees is represented by 11 on the y-axis; look to the right to see in which years this occurred.
Source: Digest of Education Statistics.
The y-value of 11 occurs at two data points, one where x = 10 and the other where x = 30. These values correspond to the years 1980 and 2000, respectively.
Answers:
a. In the year 1975, 18,000 mathematics and statistics degrees were awarded.
b. In the years 1980 and 2000, the lows of 11,000 mathematics and statistics degrees were awarded.
Distance Formula
Frequently you need to calculate the distance between two points in a plane. To do this, form a right triangle using the two points as vertices of the triangle and then apply the Pythagorean theorem. Recall that the Pythagorean theoremGiven any right triangle with legs measuring a and b units and hypotenuse measuring c units, then . states that if given any right triangle with legs measuring a and b units, then the square of the measure of the hypotenuse c is equal to the sum of the squares of the legs: . In other words, the hypotenuse of any right triangle is equal to the square root of the sum of the squares of its legs.

Example 5: Find the distance between (−1, 2) and (3, 5).
Solution: Form a right triangle by drawing horizontal and vertical lines through the two points. This creates a right triangle as shown below:
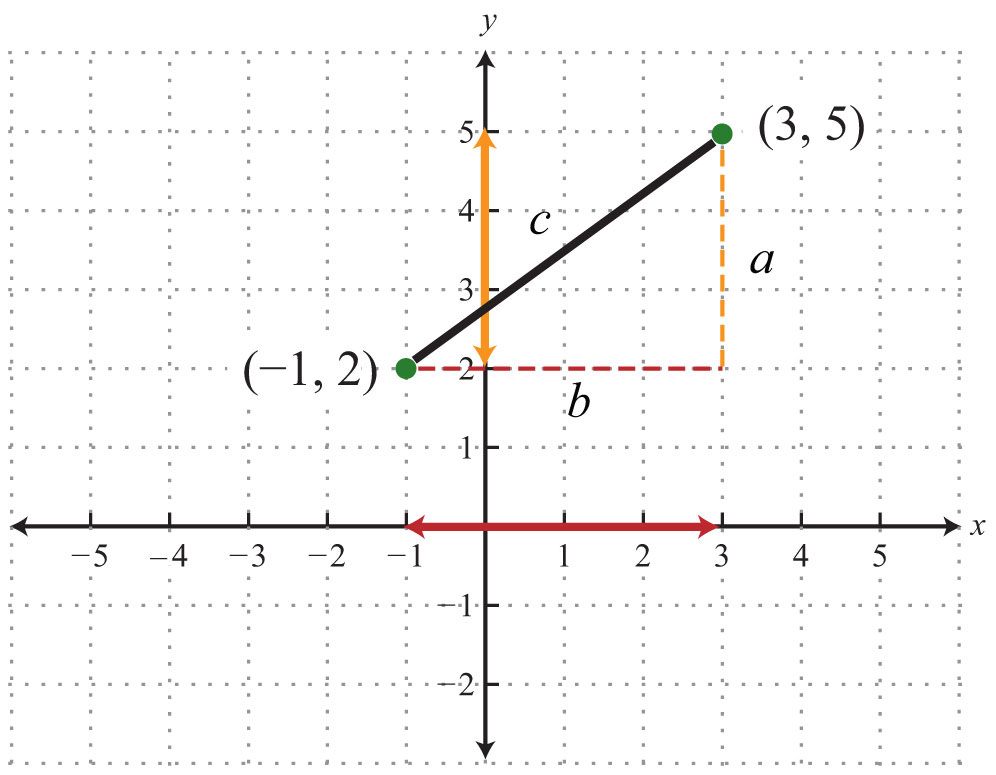
The length of leg b is calculated by finding the distance between the x-values of the given points, and the length of leg a is calculated by finding the distance between the given y-values.

Next, use the Pythagorean theorem to find the length of the hypotenuse.

Answer: The distance between the two points is 5 units.
Generalize this process to produce a formula that can be used to algebraically calculate the distance between any two given points.

Given two points, and , then the distance, d, between them is given by the distance formulaGiven two points and , calculate the distance d between them using the formula :
Example 6: Calculate the distance between (−3, −1) and (−2, 4).
Solution: Use the distance formula.

It is a good practice to include the formula in its general form as a part of the written solution before substituting values for the variables. This improves readability and reduces the chance for errors.
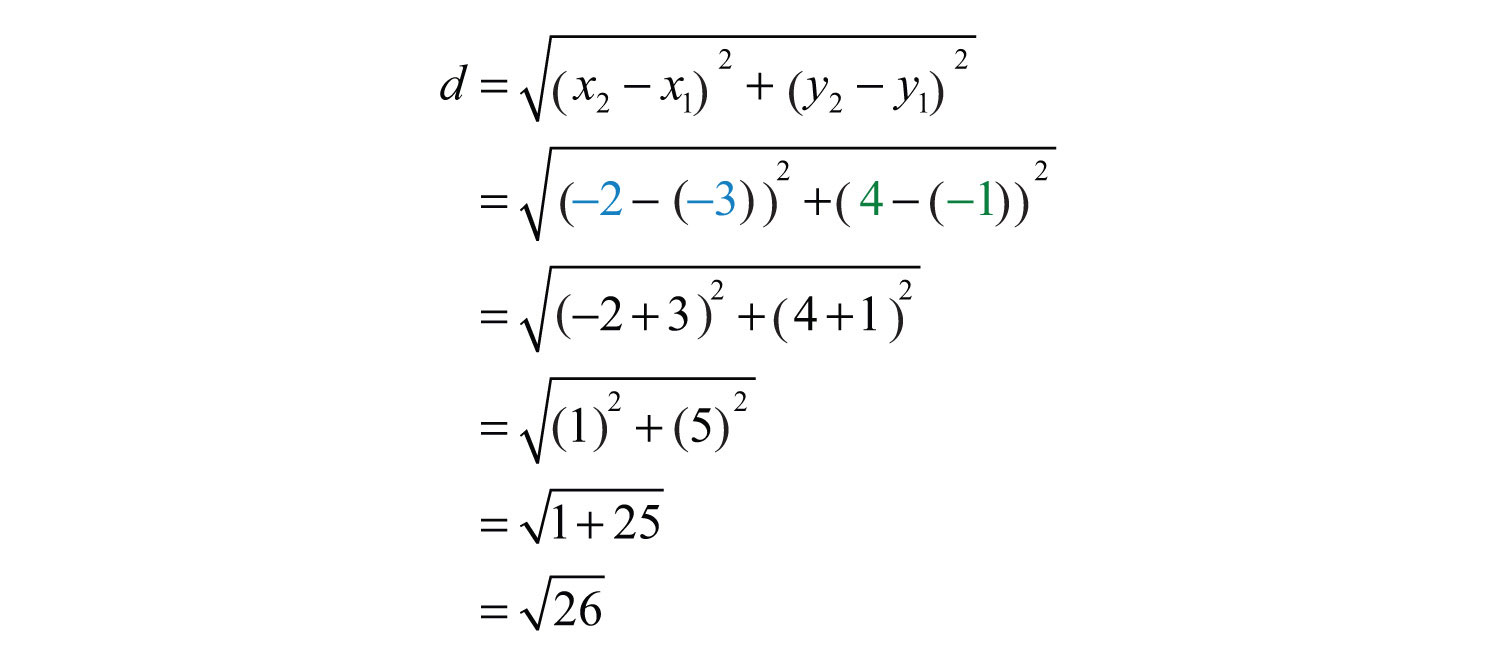
Answer: units
Try this! Calculate the distance between (−7, 5) and (−1, 13).
Answer: 10 units
Video Solution
(click to see video)
Example 7: Do the three points (1, −1), (3, −3), and (3, 1) form a right triangle?
Solution: The Pythagorean theorem states that having side lengths that satisfy the property is a necessary and sufficient condition of right triangles. In other words, if you can show that the sum of the squares of the leg lengths of the triangle is equal to the square of the length of the hypotenuse, then the figure must be a right triangle. First, calculate the length of each side using the distance formula.
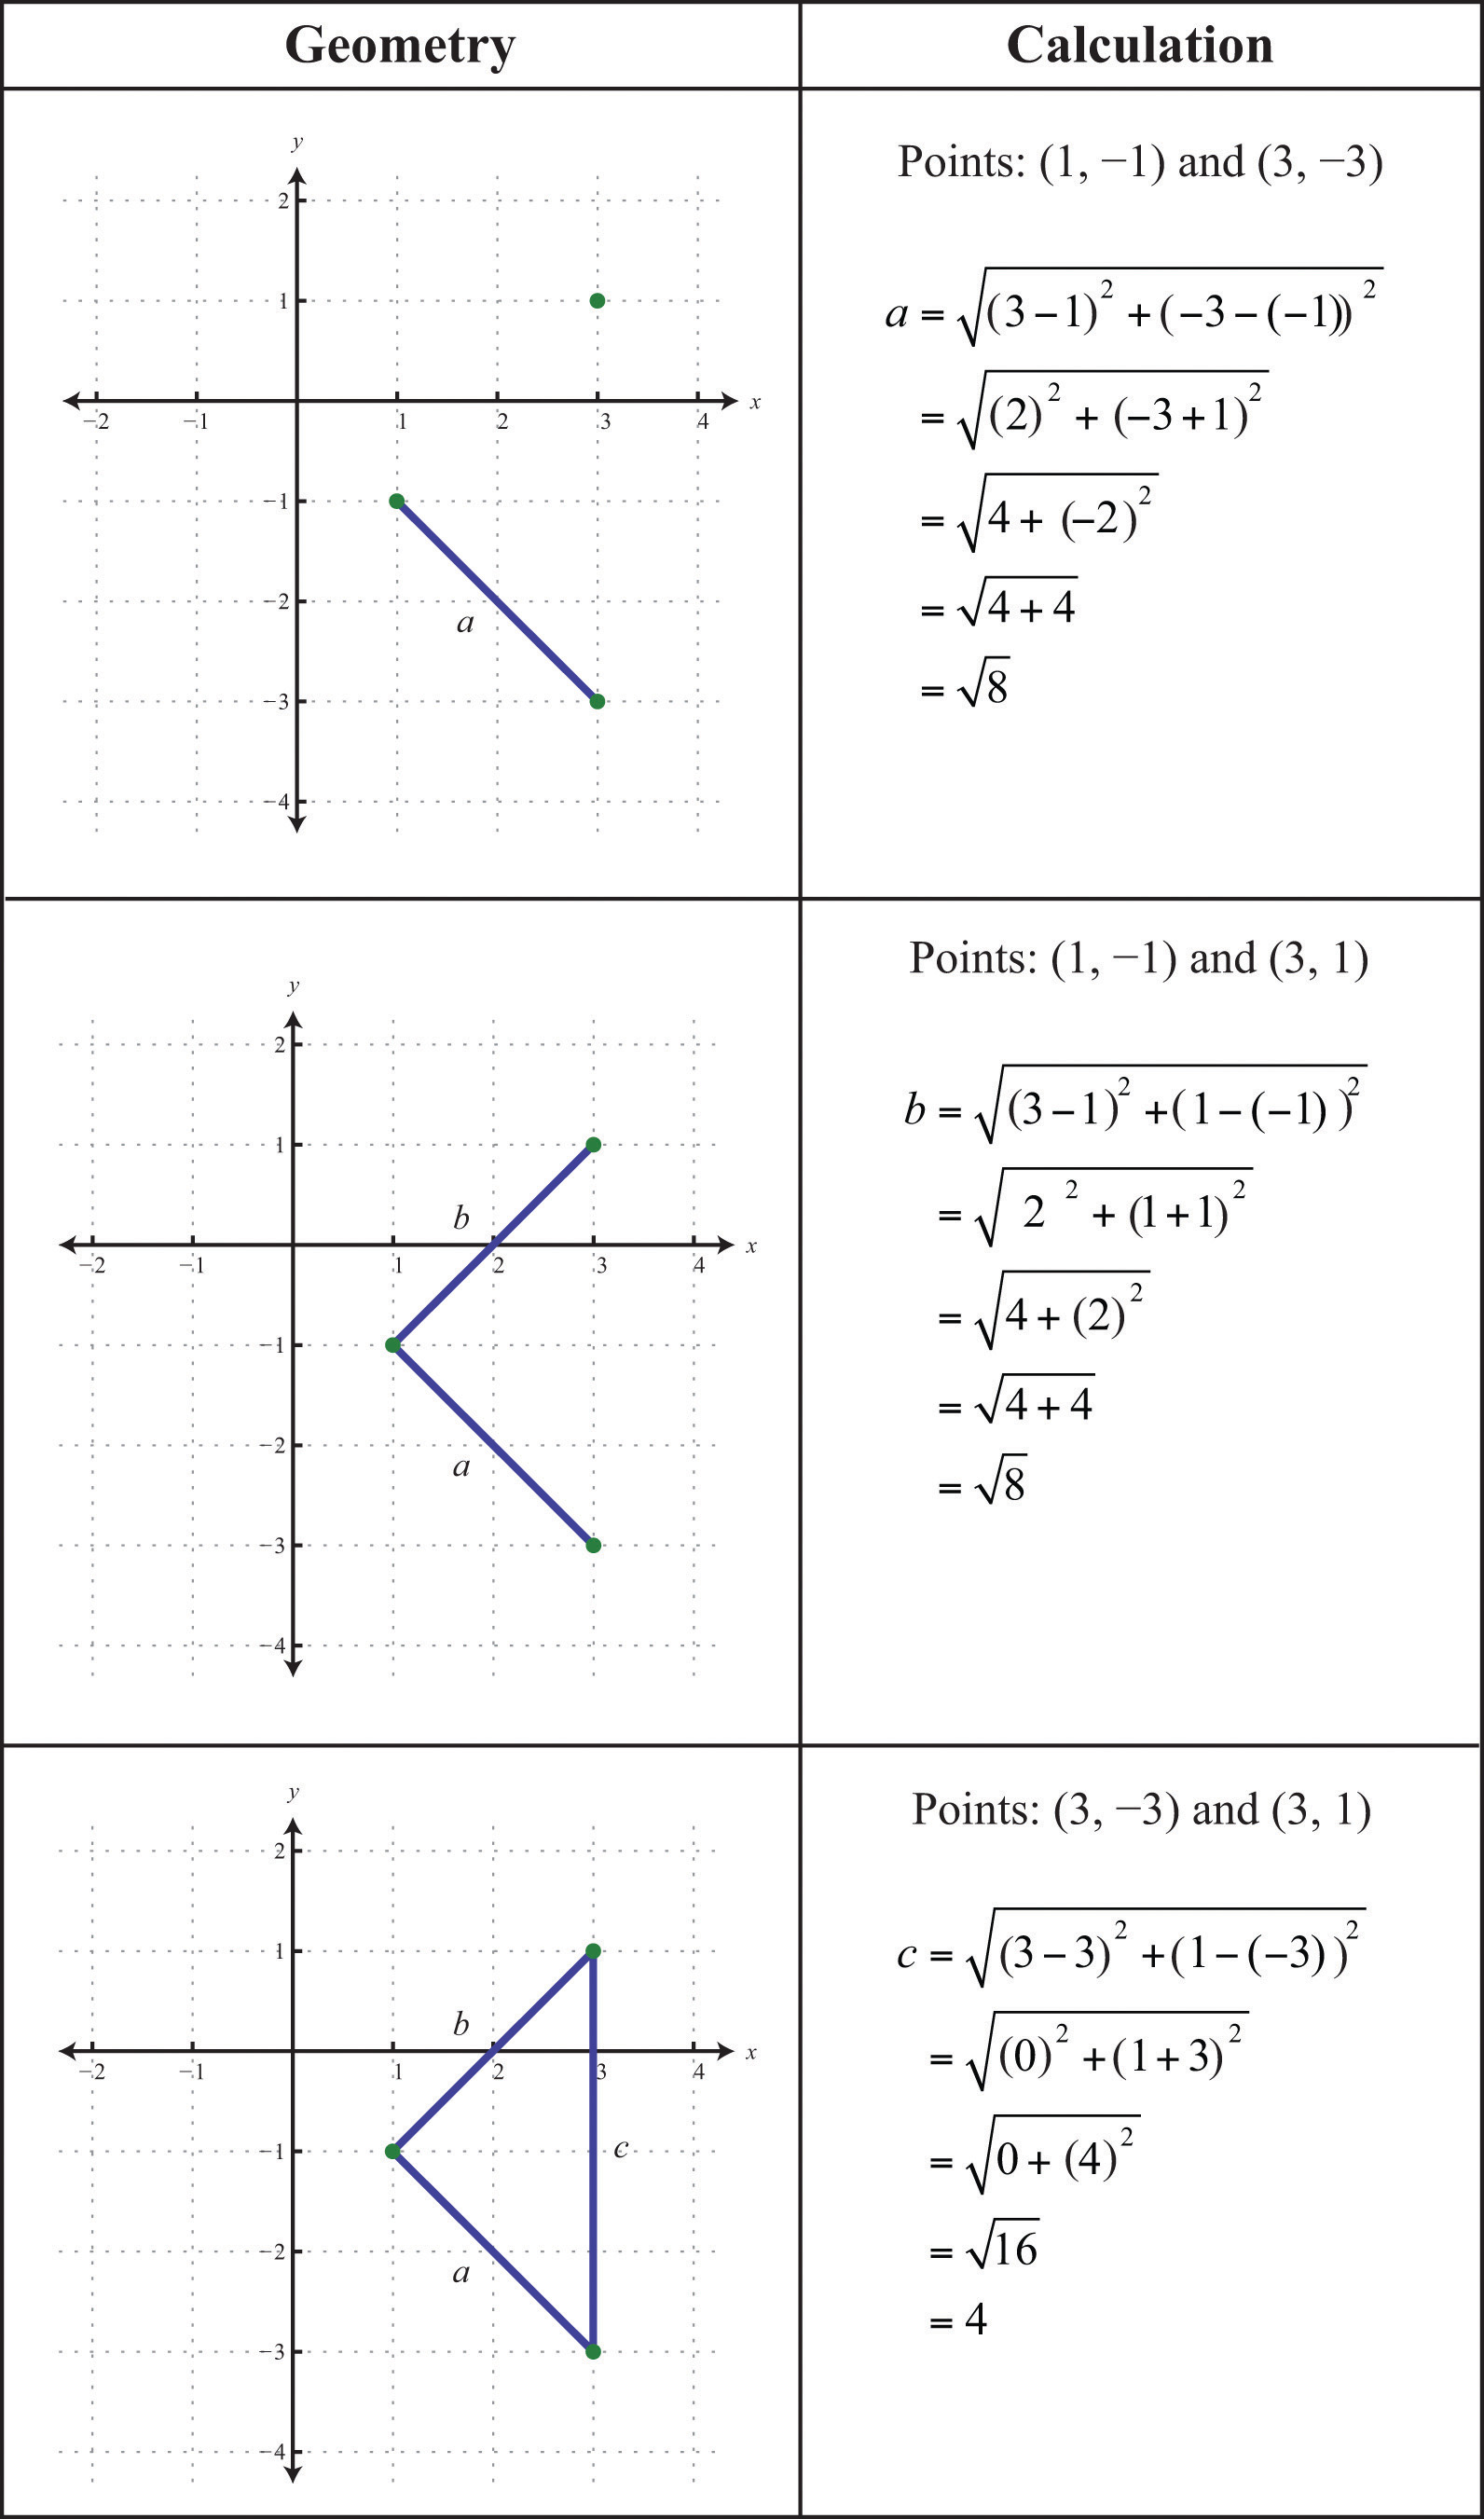
Now we check to see if .

Answer: Yes, the three points form a right triangle. In fact, since two of the legs are equal in length, the points form an isosceles right triangle.
Midpoint Formula
The point that bisects the line segment formed by two points, and , is called the midpointGiven two points, and , the midpoint is an ordered pair given by . and is given by the following formula:

The midpoint is an ordered pair formed by finding the average of the x-values and the average of the y-values of the given points.
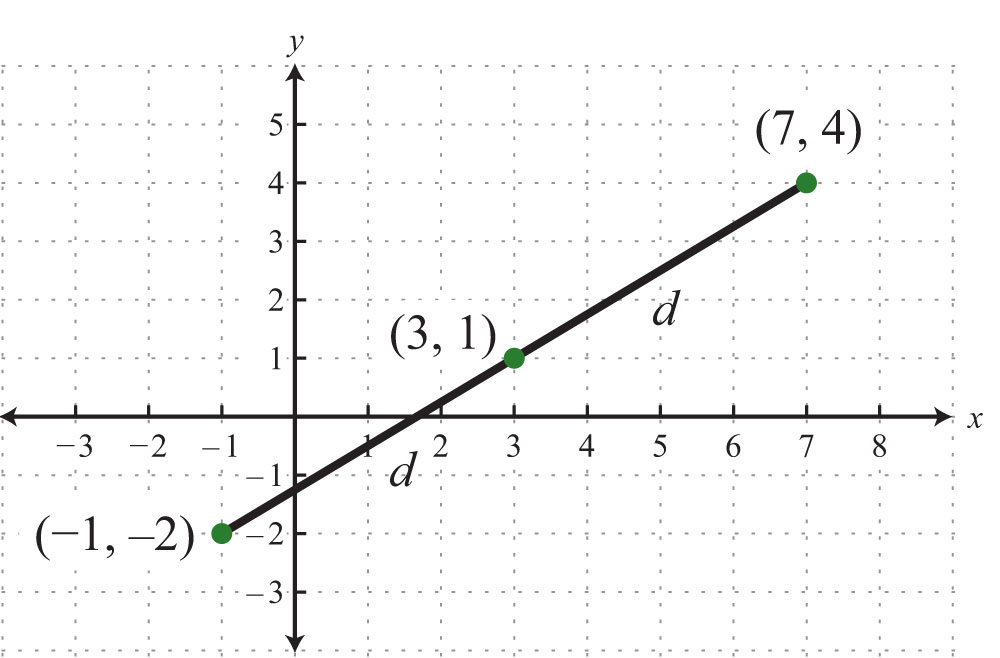
Example 8: Calculate the midpoint between (−1, −2) and (7, 4).
Solution: First, calculate the average of the x- and y-values of the given points.
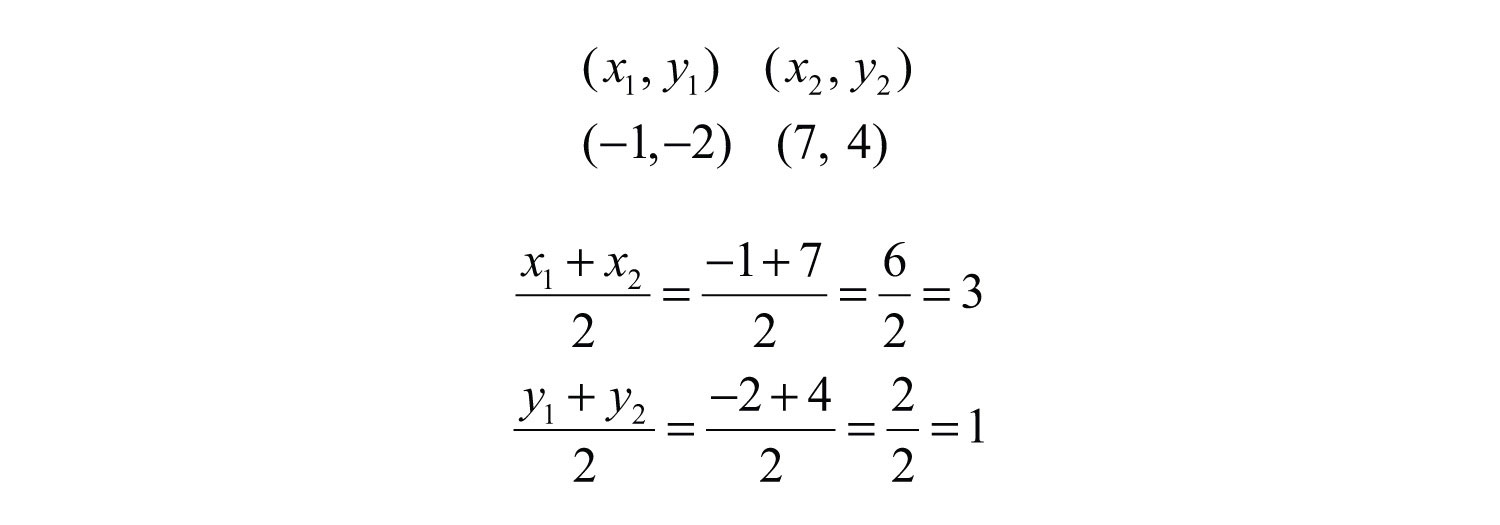
Next, form the midpoint as an ordered pair using the averaged coordinates.

Answer: (3, 1)
To verify that this is indeed the midpoint, calculate the distance between the two given points and verify that the result is equal to the sum of the two equal distances from the endpoints to this midpoint. This verification is left to the reader as an exercise.
Try this! Find the midpoint between (−6, 5) and (6, −11).
Answer: (0, −3)
Video Solution
(click to see video)Key Takeaways
- Use the rectangular coordinate system to uniquely identify points in a plane using ordered pairs (x, y). Ordered pairs indicate position relative to the origin. The x-coordinate indicates position to the left and right of the origin. The y-coordinate indicates position above or below the origin.
- The scales on the x-axis and y-axis may be different. Choose a scale for each axis that is appropriate for the given problem.
- Graphs are used to visualize real-world data. Typically, independent data is associated with the x-axis and dependent data is associated with the y-axis.
- The Pythagorean theorem gives us a necessary and sufficient condition of right triangles. Given a right triangle, then the measures of the sides satisfy . Conversely, if the sides satisfy , then the triangle must be a right triangle.
- The distance formula, , is derived from the Pythagorean theorem and gives us the distance between any two points, and , in a rectangular coordinate plane.
- The midpoint formula, , is derived by taking the average of each coordinate and forming an ordered pair.
Topic Exercises
Part A: Ordered Pairs
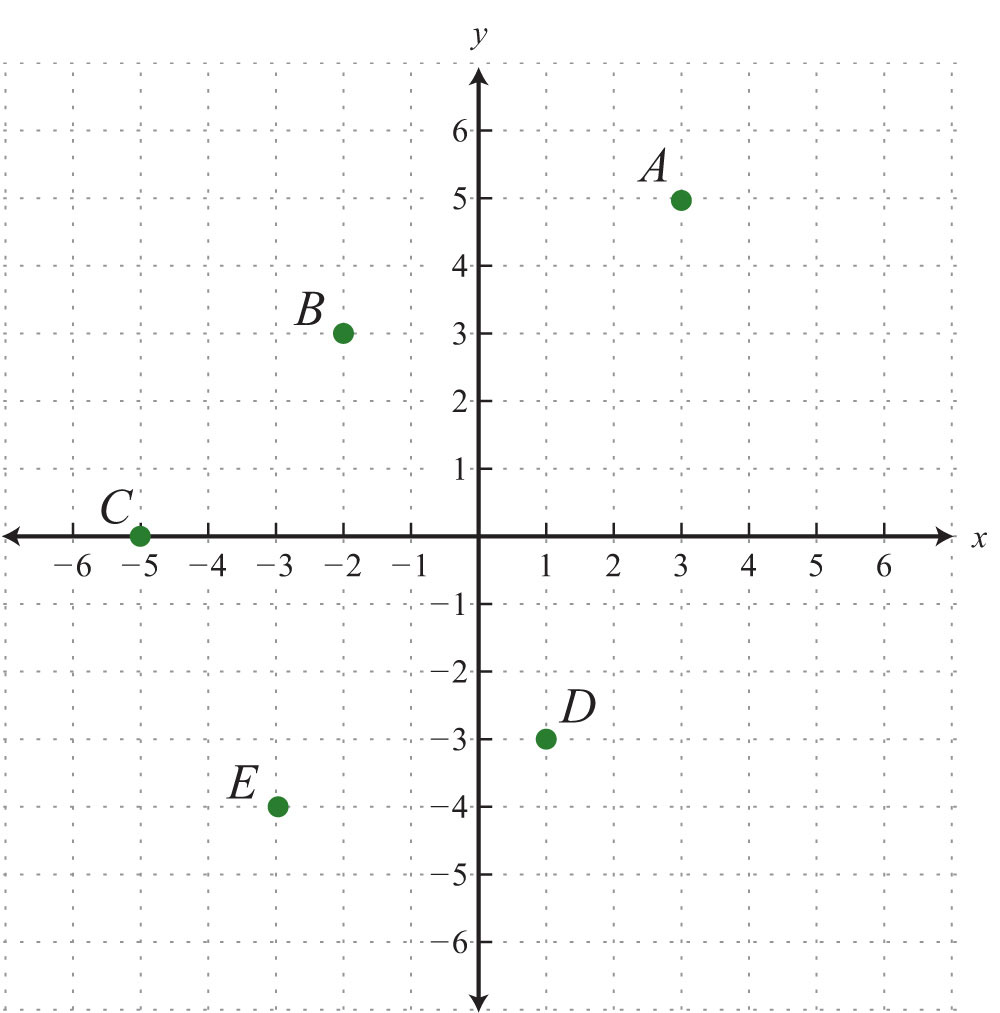
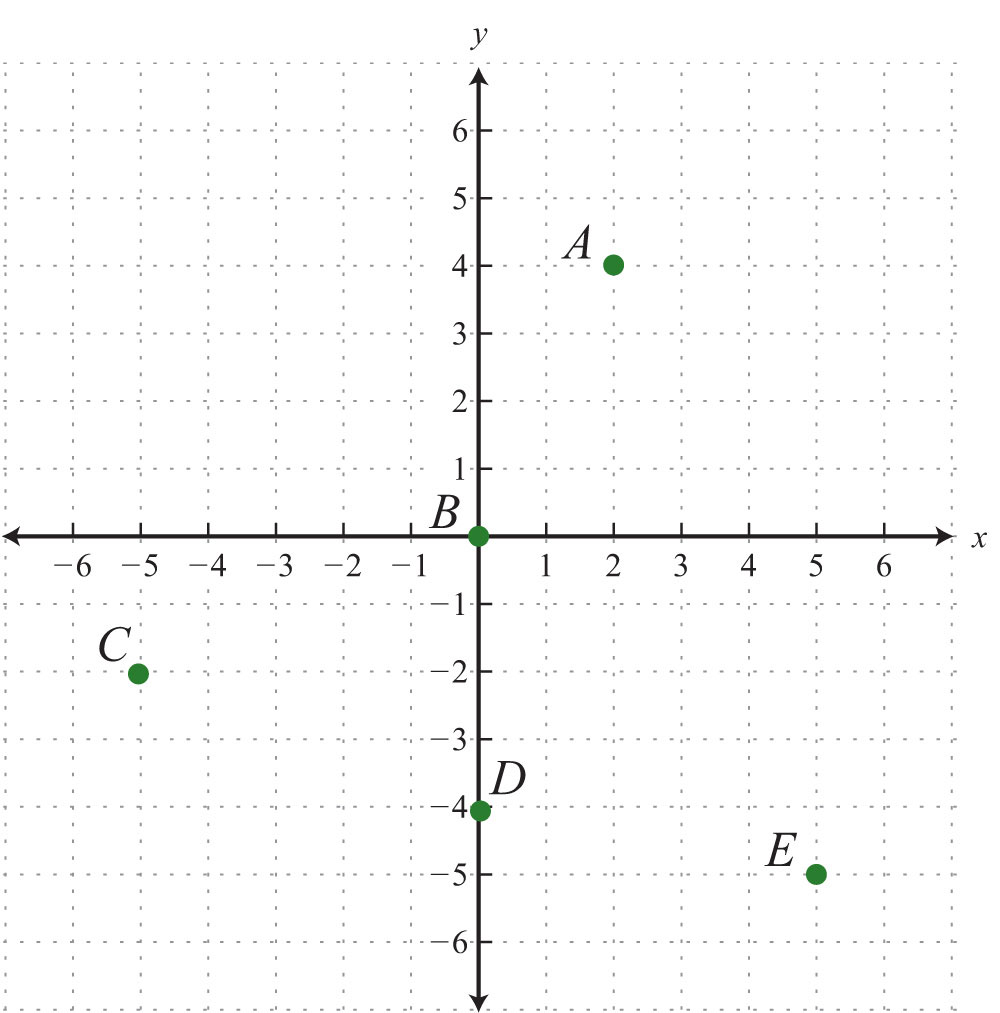
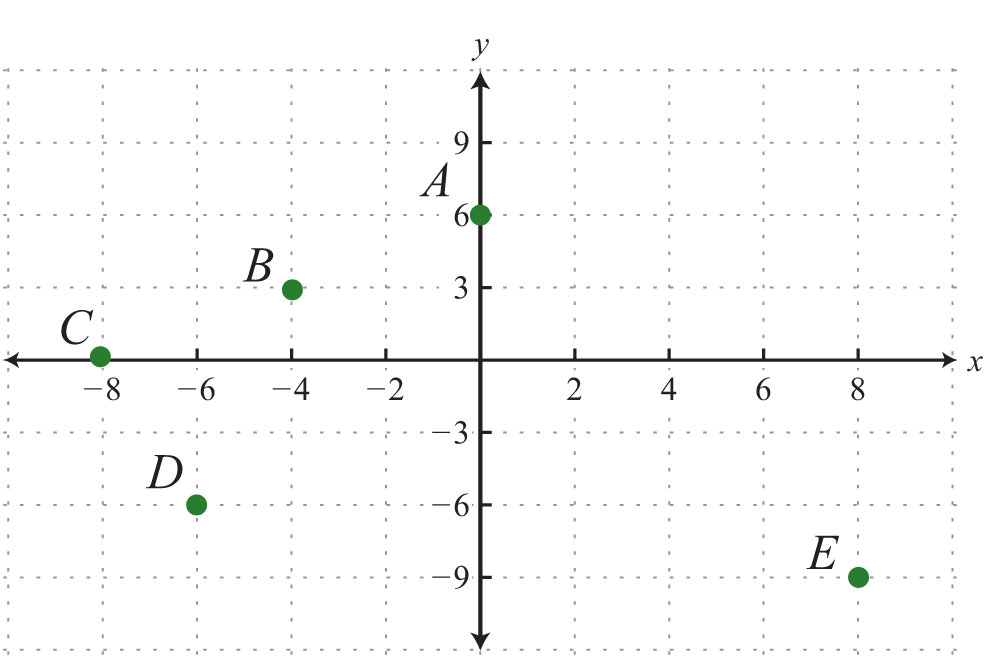
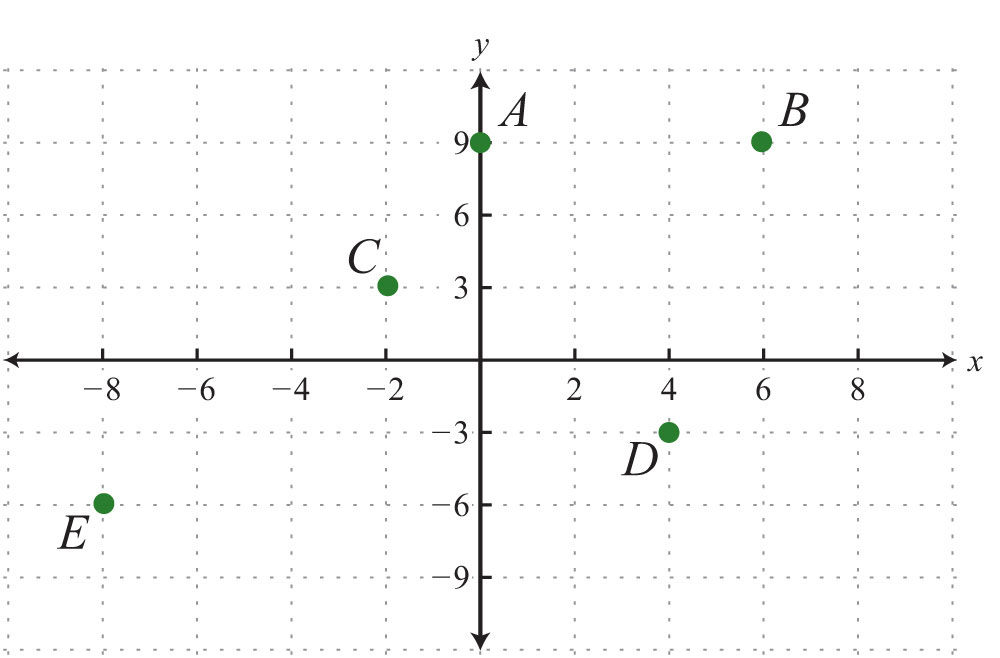
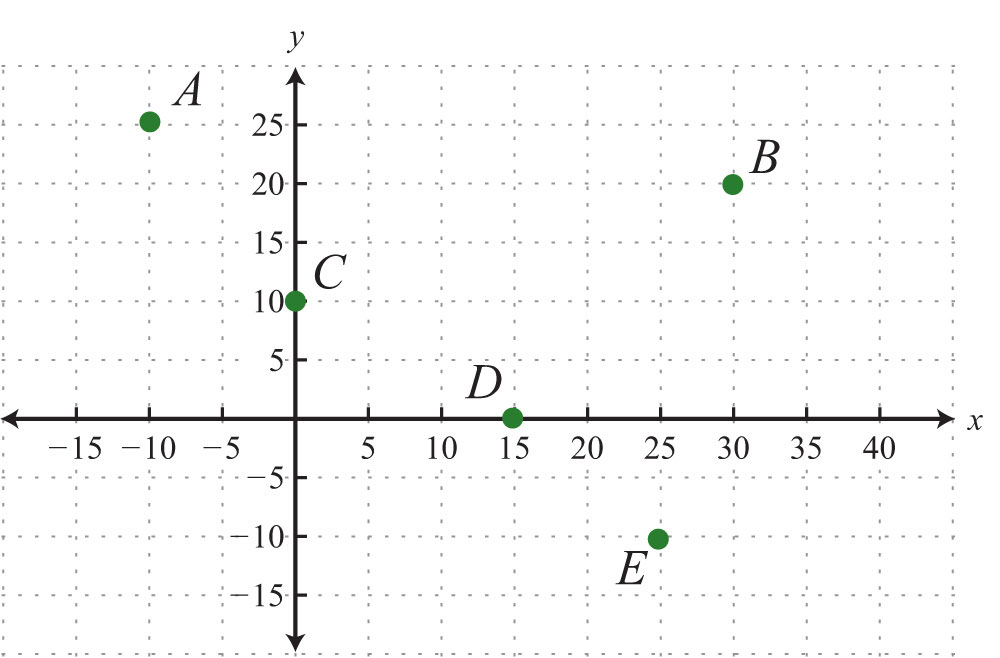
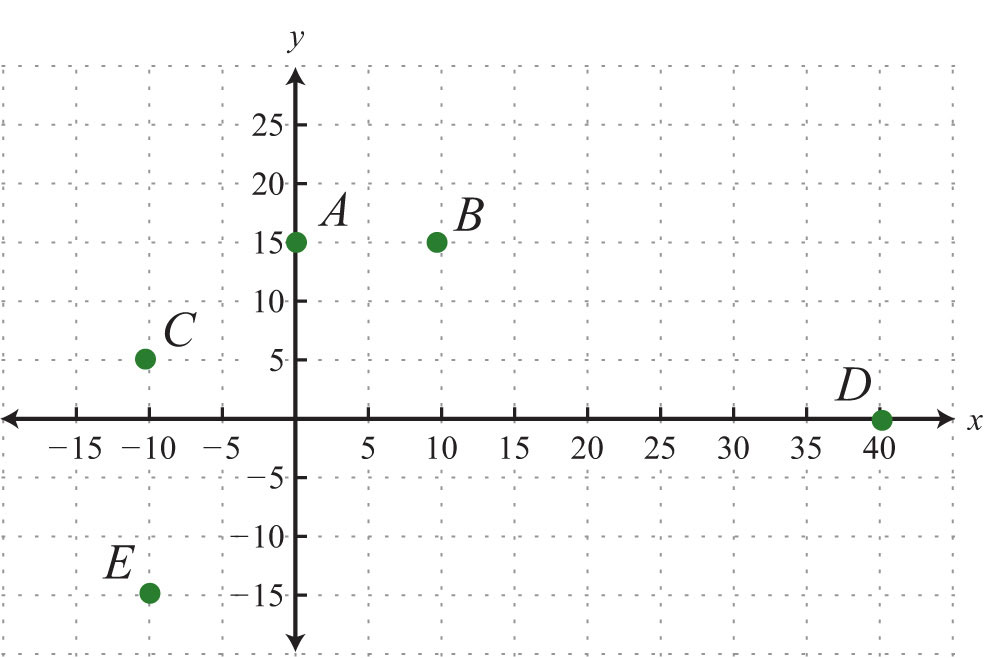
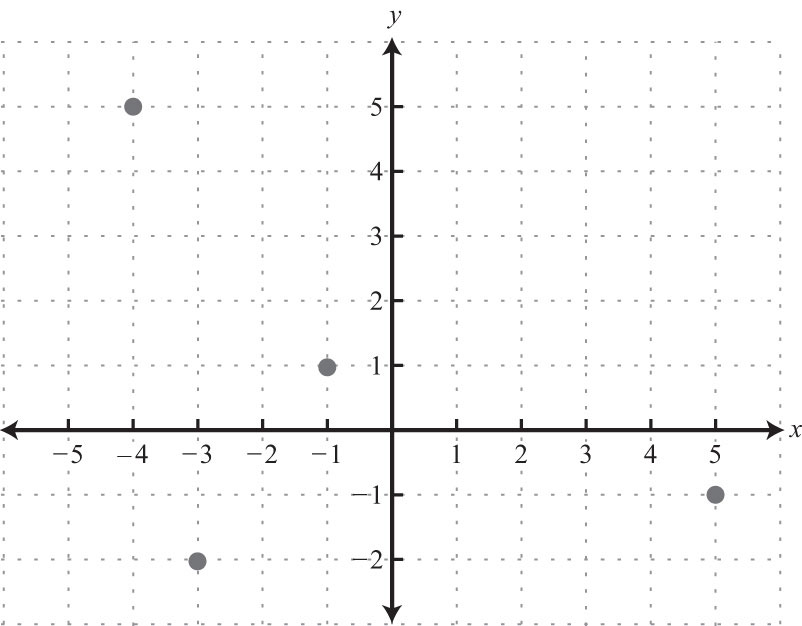
Give the coordinates of points A, B, C, D, and E.
1.
2.
3.
4.
5.
6.
Graph the given set of ordered pairs.
7. {(−4, 5), (−1, 1), (−3, −2), (5, −1)}
8. {(−15, −10), (−5, 10), (15, 10), (5, −10)}
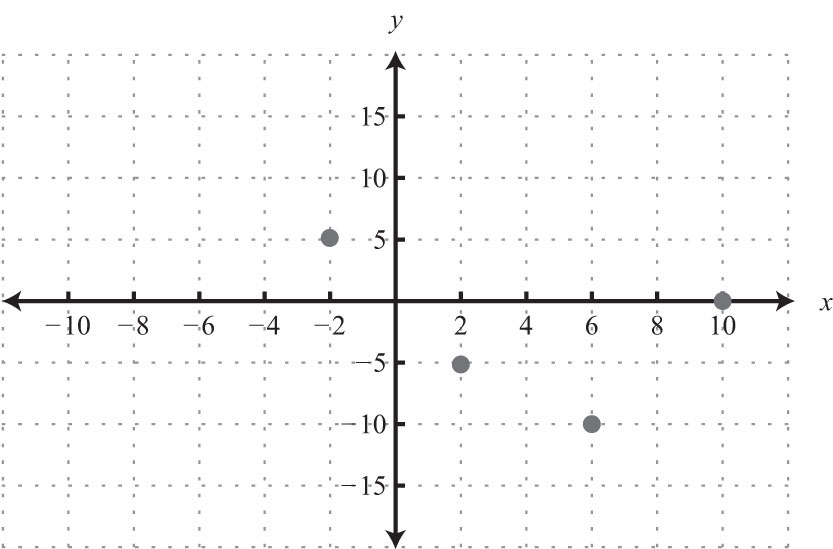
9. {(−2, 5), (10, 0), (2, −5), (6, −10)}
10. {(−8, 3), (−4, 6), (0, −6), (6, 9)}
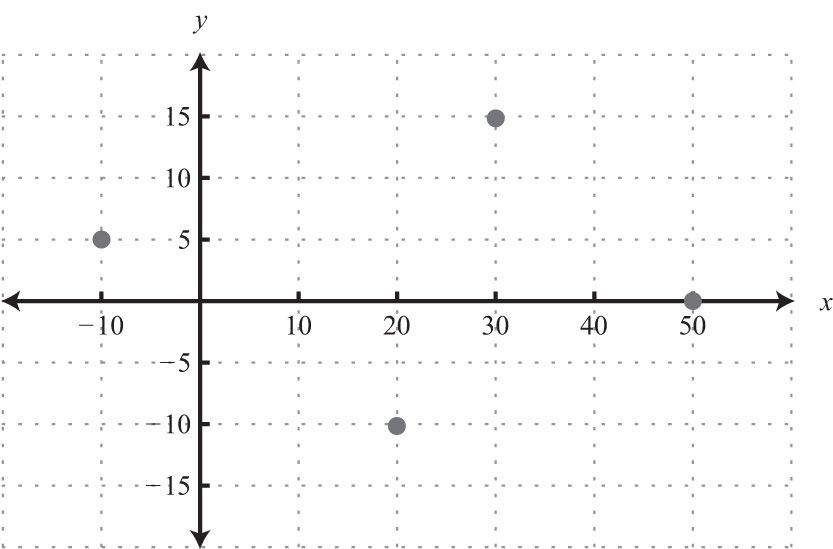
11. {(−10, 5), (20, −10), (30, 15), (50, 0)}
12.
13.
14. {(−3.5, 0), (−1.5, 2), (0, 1.5), (2.5, −1.5)}
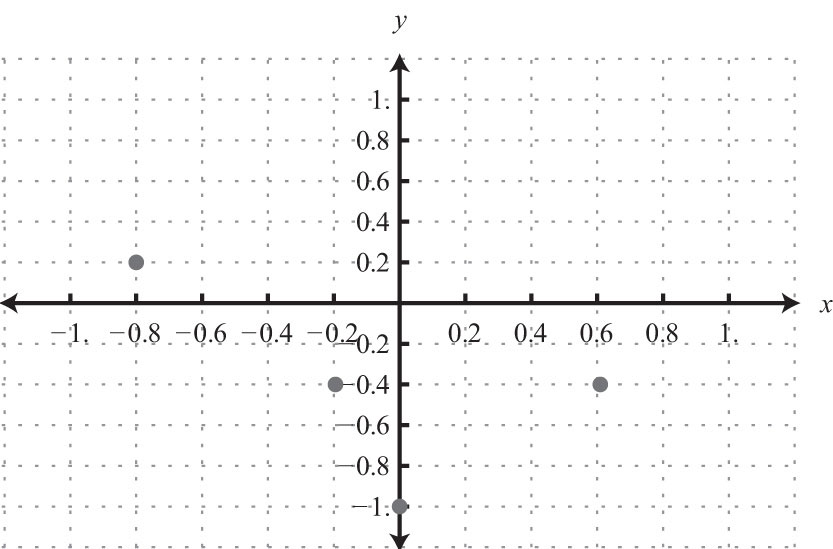
15. {(−0.8, 0.2), (−0.2, −0.4), (0, −1), (0.6, −0.4)}
16. {(−1.2, −1.2), (−0.3, −0.3), (0, 0), (0.6, 0.6), (1.2, 1.2)}
State the quadrant in which the given point lies.
17. (−3, 2)
18. (5, 7)
19. (−12, −15)
20. (7, −8)
21. (−3.8, 4.6)
22. (17.3, 1.9)
23.
24.
25.
26.
27.
28.
The average price of a gallon of regular unleaded gasoline in US cities is given in the following line graph. Use the graph to answer the following questions.
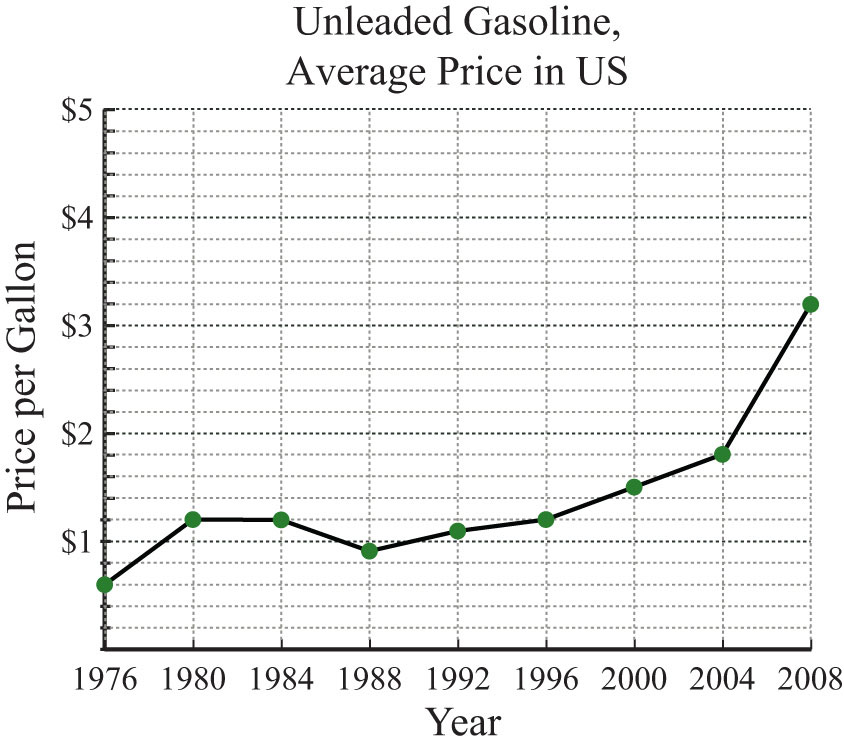
Source: Bureau of Labor Statistics.
29. What was the average price of a gallon of unleaded gasoline in 2004?
30. What was the average price of a gallon of unleaded gasoline in 1976?
31. In which years were the average price of a gallon of unleaded gasoline $1.20?
32. What is the price increase of a gallon of gasoline from 1980 to 2008?
33. What was the percentage increase in the price of a gallon of unleaded gasoline from 1976 to 1980?
34. What was the percentage increase in the price of a gallon of unleaded gasoline from 2000 to 2008?
The average price of all-purpose white flour in US cities from 1980 to 2008 is given in the following line graph. Use the graph to answer the questions that follow.
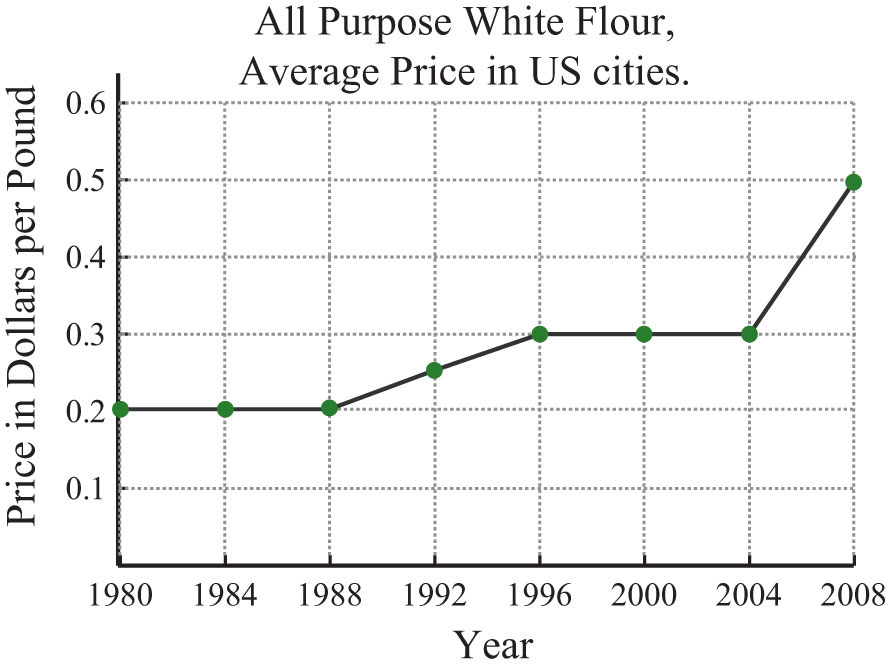
Source: Bureau of Labor Statistics.
35. What was the average price per pound of all-purpose white flour in 2000?
36. What was the average price per pound of all-purpose white flour in 2008?
37. In which year did the price of flour average $0.25 per pound?
38. In which years did the price of flour average $0.20 per pound?
39. What was the percentage increase in flour from the year 2000 to 2008?
40. What was the percentage increase in flour from the year 1992 to 2000?
Given the following data, create a line graph.
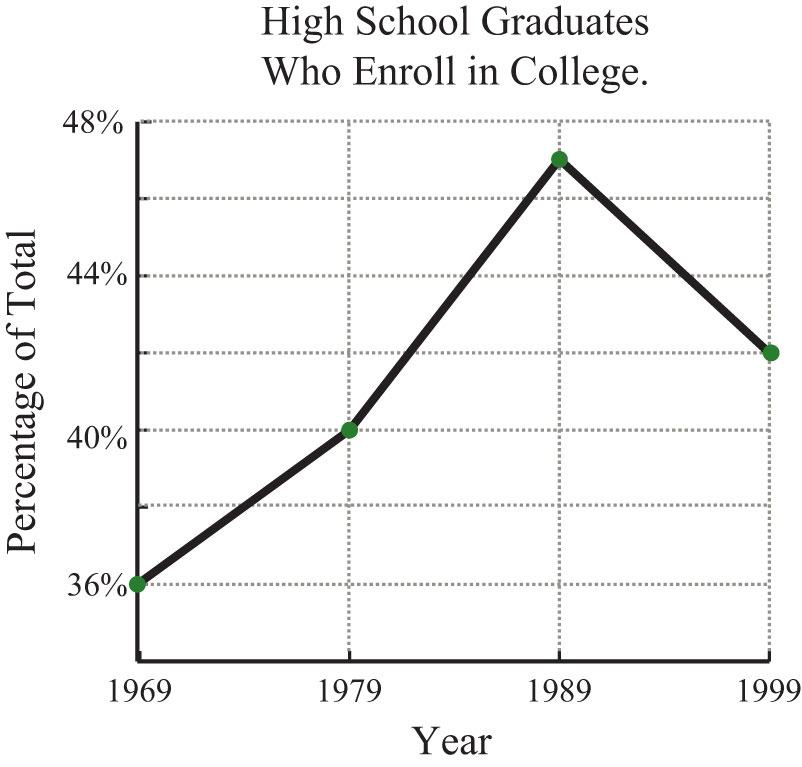
41. The percentage of total high school graduates who enrolled in college.
| Year | Percentage |
|---|---|
| 1969 | 36% |
| 1979 | 40% |
| 1989 | 47% |
| 1999 | 42% |
Source: Digest of Education Statistics.
42. The average daily temperature given in degrees Fahrenheit in May.
| Exam | Temperature |
|---|---|
| 8:00 am | 60 |
| 12:00 pm | 72 |
| 4:00 pm | 75 |
| 8:00 pm | 67 |
| 12:00 am | 60 |
| 4:00 am | 55 |
Calculate the area of the shape formed by connecting the following set of vertices.
43. {(0, 0), (0, 3), (5, 0), (5, 3)}
44. {(−1, −1), (−1, 1), (1, −1), (1, 1)}
45. {(−2, −1), (−2, 3), (5, 3), (5, −1)}
46. {(−5, −4), (−5, 5), (3, 5), (3, −4)}
47. {(0, 0), (4, 0), (2, 2)}
48. {(−2, −2), (2, −2), (0, 2)}
49. {(0, 0), (0, 6), (3, 4)}
50. {(−2, 0), (5, 0), (3, −3)}
Part B: Distance Formula
Calculate the distance between the given two points.
51. (−5, 3) and (−1, 6)
52. (6, −2) and (−2, 4)
53. (0, 0) and (5, 12)
54. (−6, −8) and (0, 0)
55. (−7, 8) and (5, −1)
56. (−1, −2) and (9, 22)
57. (−1, 2) and (−7/2, −4)
58. and
59. and
60. and
61. (1, 2) and (4, 3)
62. (2, −4) and (−3, −2)
63. (−1, 5) and (1, −3)
64. (1, −7) and (5, −1)
65. (−7, −3) and (−1, 6)
66. (0, 1) and (1, 0)
67. (−0.2, −0.2) and (1.8, 1.8)
68. (1.2, −3.3) and (2.2, −1.7)
For each problem, show that the three points form a right triangle.
69. (−3, −2), (0, −2), and (0, 4)
70. (7, 12), (7, −13), and (−5, −4)
71. (−1.4, 0.2), (1, 2), and (1, −3)
72. (2, −1), (−1, 2), and (6, 3)
73. (−5, 2), (−1, −2), and (−2, 5)
74. (1, −2), (2, 3), and (−3, 4)
Isosceles triangles have two legs of equal length. For each problem, show that the following points form an isosceles triangle.
75. (1, 6), (−1, 1), and (3, 1)
76. (−6, −2), (−3, −5), and (−9, −5)
77. (−3, 0), (0, 3), and (3, 0)
78. (0, −1), (0, 1), and (1, 0)
Calculate the area and the perimeter of the triangles formed by the following set of vertices.
79. {(−4, −5), (−4, 3), (2, 3)}
80. {(−1, 1), (3, 1), (3, −2)}
81. {(−3, 1), (−3, 5), (1, 5)}
82. {(−3, −1), (−3, 7), (1, −1)}
Part C: Midpoint Formula
Find the midpoint between the given two points.
83. (−1, 6) and (−7, −2)
84. (8, 0) and (4, −3)
85. (−10, 0) and (10, 0)
86. (−3, −6) and (−3, 6)
87. (−10, 5) and (14, −5)
88. (0, 1) and (2, 2)
89. (5, −3) and (4, −5)
90. (0, 0) and (1, 1)
91. (−1, −1) and (4, 4)
92. (3, −5) and (3, 5)
93. and
94. and
95. and
96. and
97. Given the right triangle formed by the vertices (0, 0), (6, 0), and (6, 8), show that the midpoints of the sides form a right triangle.
98. Given the isosceles triangle formed by the vertices (−10, −12), (0, 12), and (10, −12), show that the midpoints of the sides also form an isosceles triangle.
99. Calculate the area of the triangle formed by the vertices (−4, −3), (−1, 1), and (2, −3). (Hint: The vertices form an isosceles triangle.)
100. Calculate the area of the triangle formed by the vertices (−2, 1), (4, 1), and (1, −5).
Part D: Discussion Board Topics
101. Research and discuss the life and contributions to mathematics of René Descartes.
102. Research and discuss the history of the right triangle and the Pythagorean theorem.
103. What is a Pythagorean triple? Provide some examples.
104. Explain why you cannot use a ruler to calculate distance on a graph.
105. How do you bisect a line segment with only a compass and a straightedge?
Answers
1: A: (3, 5); B: (−2, 3); C: (−5, 0); D: (1, −3); E: (−3, −4)
3: A: (0, 6); B: (−4, 3); C: (−8, 0); D: (−6, −6); E: (8, −9)
5: A: (−10, 25); B: (30, 20); C: (0, 10); D: (15, 0); E: (25, −10)
7:
9:
11:
13:
15:
17: QII
19: QIII
21: QII
23: QIII
25: QIV
27: QII
29: $1.80
31: 1980 to 1984, 1996
33: 100%
35: $0.30
37: 1992
39: 67%
41:
43: 15 square units
45: 28 square units
47: 4 square units
49: 9 square units
51: 5 units
53: 13 units
55: 15 units
57: 13/2 units
59: 5/3 units
61: units
63: units
65: units
67: 2.8 units
69: Proof
71: Proof
73: Proof
75: Proof
77: Proof
79: Perimeter: 24 units; area: 24 square units
81: Perimeter: units; area: 8 square units
83: (−4, 2)
85: (0, 0)
87: (2, 0)
89: (9/2, −4)
91: (3/2, 3/2)
93: (1/2, 1)
95: (3/4, −5/8)
99: 12 square units