This is “The Global Financial Crisis”, chapter 15 from the book Theory and Applications of Macroeconomics (v. 1.0). For details on it (including licensing), click here.
For more information on the source of this book, or why it is available for free, please see the project's home page. You can browse or download additional books there. To download a .zip file containing this book to use offline, simply click here.


Chapter 15 The Global Financial Crisis
A World in Crisis
The following quotation describes a meeting held in Washington, DC, among the G-20 countries.Associated Press, “World Leaders Pledge to Combat Global Crisis,” Minnesota Public Radio News, November 17, 2008, accessed July 25, 2011, http://minnesota.publicradio.org/display/web/2008/11/17/financial_meltdown. The G-20 countries are a group of 20 of the richest countries in the world.
President George W. Bush, who served as host for the G-20 discussions, said it was the seriousness of the current crisis that had convinced him that massive government intervention was warranted.
He said he felt “extraordinary measures” were needed after being told “if you don’t take decisive measures then it’s conceivable that our country could go into depression greater than the Great Depression.”
As we wrote this chapter in 2011, the world economy was slowly emerging from the worst financial crisis since the Great Depression. Economists and others formerly thought that the Great Depression was an interesting piece of economic history and nothing more. After all, they thought, we now understand the economy much better than did the policymakers at that time, so we could never have another Great Depression. But this belief that monetary and fiscal policymakers around the world knew how to ensure economic stability was shattered by financial turmoil that began in 2007, blossomed into a full-fledged global crisis in the fall of 2008, and led to sustained downturns in many economies in the years that followed.
That was the background to the November 2008 meeting of the G-20 countries. The world leaders attending that meeting were attempting to cope with economic problems that they had never even contemplated. The events that led to this meeting were unprecedented since the Great Depression, in part because of the magnitude and worldwide nature of the crisis.
As the quotation from President George W. Bush attests, extraordinary times prompted extraordinary action. The US government passed an “emergency rescue plan” in October 2008 to provide $700 billion in funding to (among other things) buy up assets of troubled banks and firms. This was followed by a large stimulus package, called the American Recovery and Reinvestment Act of 2009, which was passed during the first year of the Obama administration. Other countries brought in similar stimulus packages. Increased government expenditures and cuts in taxes were enacted by governments around the world. Monetary authorities also took extraordinary steps, with many countries rapidly reducing interest rates to very low levels. In addition, the US Federal Reserve and other monetary authorities engaged in other unprecedented policies in an attempt to provide liquidity to the financial system.
Although the roots of the crisis can be traced to 2007 or before, and although the implications of the crisis are still being felt, the full-fledged crisis began in 2008. As shorthand, we therefore refer to all these events as the “crisis of 2008,” and the question we ask in this chapter is as follows:
What happened during the crisis of 2008?
Road Map
In this chapter, we explore the policies enacted by governments to deal with the crisis. First we need a framework to understand these events. We make sense of the events of the past few years by drawing on the tools that we have developed in this book. We aim to do more than just give a narrative account of what happened; we also offer explanations of what happened. Whereas other chapters in this book are largely self-contained, this chapter is designed as a capstone. We therefore make frequent references to topics discussed in other chapters.
The crisis of 2008 was a highly complex event, with many different and imperfectly understood causes. Moreover, some of the details involve highly arcane aspects of financial markets. We are not going to give you a comprehensive account of the crisis. But we will show you how you can use the tools you have learned in this book to make some sense of what happened. We highlight three themes in particular.
- As emphasized in Chapter 4 "The Interconnected Economy", markets in the economy and around the world are interconnected. Various connections among markets caused the crisis to spill over across different financial markets, from financial markets into the real economy, and from the United States to economies all around the world. These are sometimes called “contagion problems.”
- There were coordination failures in addition to contagion problems.
- Monetary and fiscal policies are interconnected. We will see that responses to the crisis around the globe often required monetary and fiscal authorities to work together.
We start by summarizing events in the United States. In doing so, we use a tool from game theory to study how financial instability might arise. We use this framework to consider both recent events in the United States and events from the Great Depression. We then look specifically at the housing market at the start of the 21st century.
After understanding the experience in the United States, we study how the crisis spread from the United States to other countries. We stress both financial and trade links across countries as ways in which the crisis spread. We look at a few countries in particular, such as the United Kingdom, China, Iceland, and the countries of the European Union. The crisis in the European Union is particularly interesting to economists because the interconnections between the monetary and fiscal authorities are very different to those in other places. Finally, we consider exchange rates and currency crises.
15.1 The Financial Crisis in the United States
Learning Objectives
After you have read this section, you should be able to answer the following questions:
- What was the role of coordination games in the crisis?
- What was the monetary policy response to the crisis?
- What was the fiscal policy response to the crisis?
Starting in 2007 and stretching well into 2008, the United States and other countries experienced financial crises that resembled those of the Great Depression. Through the summer of 2011 (when this chapter was written), unemployment remained high, and real gross domestic product (real GDP) growth was low in the US economy. Some countries in Western Europe, such as Greece, were close to defaulting on their government debt.
One indicator of the seriousness of these events is the dramatic action that policymakers took in response. For example, on October 3, 2008, President George W. Bush signed into law the Emergency Economic Stabilization Act of 2008, which authorized the US Treasury to spend up to $700 billion for emergency economic stabilization.The full text of the bill and related facts are available at “Bill Summary & Status: 110th Congress (2007–2008) H.R.1424,” THOMAS: The Library of Congress, accessed September 20, 2011, http://thomas.loc.gov/cgi-bin/bdquery/z?d110:h.r.01424:. As stated in the bill,
The purposes of this Act are—
- to immediately provide authority and facilities that the Secretary of the Treasury can use to restore liquidity and stability to the financial system of the United States; and
-
to ensure that such authority and such facilities are used in a manner that—
- protects home values, college funds, retirement accounts, and life savings;
- preserves homeownership and promotes jobs and economic growth;
- maximizes overall returns to the taxpayers of the United States; and
- provides public accountability for the exercise of such authority.
This was an extraordinary amount of funding—equivalent to more than $2000 for every man, woman, and child in the United States. Perhaps even more strikingly, the funding was to allow the Treasury to do something it had never done before: to purchase shares (that is, become part owners) of financial institutions, such as banks and insurance companies. The United States, unlike some other countries, has never had many cases of firms being owned by the government. Moreover, in previous decades, the trend around the world has been for less government ownership of business—not more. It would have been almost unthinkable even a few months previously for a Republican president to have put in place mechanisms to permit this extent of government involvement in the private economy.
News accounts at the time made many different claims about the financial crisis, including the following:
- Banks and other financial institutions were failing.
- Housing prices had plummeted.
- So-called subprime mortgage loans had been made to borrowers in the early part of the decade, and the default rate on mortgages was rising because borrowers were no longer able to repay the loans.
- Low interest rates fueled asset bubbles that eventually burst.
- The financial crisis started in the United States but then spread to other countries.
- Stock markets around the world fell substantially.
- The next Great Depression might be around the corner.
Each news item has an element of truth, yet each can also mislead. We first sort through the events of 2008 and the policy responses. Then we look at the current state of the economy and at more recent policy actions.
Coordination Games and Coordination Failures
As discussed in Chapter 7 "The Great Depression", the United States and other economies experienced severe economic downturns in the early 1930s, together with instability in financial markets. It was little wonder that news accounts in 2008 and 2009 were filled with discussions of the parallels and differences between then and now. When we looked at financial instability during the Great Depression in Chapter 7 "The Great Depression", we studied a “bank-run game”—a strategic situation where depositors had to decide whether to leave their money in the bank or take it out. The bank-run problem is a leading example of a coordination game—a game with two key characteristics:
- The game has multiple Nash equilibria.
- These Nash equilibria can be ranked.
In a Nash equilibrium, everyone pursues their own self-interests given the actions of others. This means that no single individual has an incentive to change his or her behavior, given the choices of others. In a coordination game, there is more than one such equilibrium, and one of the Nash equilibria is better than the others. When the outcome of the coordination game is one of the outcomes that are worse than other possible equilibrium outcomes, then we say a coordination failureThe outcome of a coordination game in which one of the equilibrium outcomes is worse than other equilibria. has occurred.
Toolkit: Section 16.9 "Nash Equilibrium"
Nash equilibrium is explained in more detail in the toolkit.
The possibility of coordination failure suggests two more fundamental questions:
- What gives rise to these coordination games?
- What can the government do about them?
Economists know that there are many situations that give rise to coordination games. Bank runs are just one example. In the crisis of 2008, actual bank runs did not occur in the United States, but they did happen in other countries. More generally, the financial instability that arose was similar in nature to a bank run.A recent article by Russell Cooper and Jonathan Willis explores in more detail the significance of coordination problems and beliefs during the recent crisis: “Coordination of Expectations in the Recent Crisis: Private Actions and Policy Responses,” Federal Reserve Bank of Kansas City Quarterly Review, First Quarter 2010, accessed July 25, 2011, http://www.kansascityfed.org/PUBLICAT/ECONREV/PDF/10q1CooperWillis.pdf. Instead of failures of small neighborhood banks, we saw the failure or the near failure of major financial institutions on Wall Street, many of which had other banks as their clients. As noted by then president of the Federal Reserve Bank of New York, Timothy Geithner, the process of intermediation has gone beyond traditional banks to create a parallel (shadow) financial system in the United States: “The scale of long-term risky and relatively illiquid assets financed by very short-term liabilities made many of the vehicles and institutions in this parallel financial system vulnerable to a classic type of run, but without the protections such as deposit insurance that the banking system has in place to reduce such risks”From an address given by Geithner to the Economic Club of New York Press: “Timothy F. Geithner: Reducing Systemic Risk in a Dynamic Financial System,” Bank for International Settlements, June 9, 2008, http://www.bis.org/review/r080612b.pdf?frames=0.
But the use of coordination games does not stop with bank runs. We can think of the decline in housing values as coming from a coordination failure. Even more strikingly, the circular flow of income itself can generate something that looks very like a coordination game. Imagine a situation where the economy is in a recession, with high unemployment and low levels of income. Because income is low, households choose low levels of spending. Because spending is low, firms choose low levels of production, leading to low income. By contrast, when income is high, then households engage in lots of spending. This leads firms to choose high levels of production, leading to high income.
What can governments do in the face of coordination games? One feature of these games is that the outcome of the game depends on the beliefs that people hold. An important aspect of economic policy may therefore be to support optimism in the economy. If people believe the economy is in trouble, this can be a self-fulfilling prophecy. But if they believe the economy is strong, they act in such a way that the economy actually is strong.
Crisis in the United States
There was no single root cause of the crisis of 2008. Economists and others have pointed to all sorts of factors that sowed the seeds of the crisis; we will not go through all these here. What is clear is that the housing market in the United States played a critical early role. As we saw in Chapter 4 "The Interconnected Economy", events in the housing market were linked to events in the credit market, the labor market, and the foreign exchange market.
We begin with an equation that teaches us how the value of a house is determined. In Chapter 9 "Money: A User’s Guide", we explained that houses are examples of assets and that the value of any asset depends on the income that the asset generates. More specifically, the value of a house this year is given by the value of the services provided by the house plus the price of the house next year:
This equation tells us that three factors determine the value of a house. One is the flow of services that the house provides over the course of the coming year. In the case of a house that is rented out, this flow of services is the rental payment. If you own the home that you live in, you can think of this flow of services as being how much you would be willing to pay each year for the right to live in your house. That value reflects the size of the house, its location, and other amenities. The higher the flow of services from a house, the higher is its current price.
The second factor is the price you would expect to receive were you to choose to sell the house next year. If you expect housing prices to be high in the future, then the house is worth more today. This is true even if you do not actually plan to sell the house next year. One way of seeing this is to recognize that if you choose not to sell the house, its worth to you must be at least as large as that price.
The third factor is the interest rate—remember that the interest factor equals (1 + the interest rate). The flow of services and next year’s price both lie in the future, and we know that income in the future is worth less than income today. We use the technique of discounted present value to convert the flow of services and the future price into today’s terms. As in the formula, we do so by dividing by the interest factor. One implication is that a change in the interest rate affects the current value of a house. In particular, a reduction in interest rates leads to higher housing prices today because a reduction in interest rates tells us that the future has become more relevant to the present.
Although we have written the equation in nominal terms, we could equally work with the real version of the same equation. In that case, the value of the service flow and the future price of the house must be adjusted for inflation, so we would use the real interest factor rather than the nominal interest factor.
Toolkit: Section 16.3 "Discounted Present Value"
You can review discounted present value in the toolkit.
Now that you understand what determines the current value of a house, imagine you are making a decision about whether or not to buy a house. Unless you have a lot of cash, you will need to take out a mortgage to make this purchase. If interest rates are low, then you are more likely to qualify for a mortgage to buy a house. In the early 2000s, mortgage rates were relatively low, with the consequence that large numbers of households qualified for loans. In addition, many lenders offered special deals with very low initial mortgage rates (which were followed by higher rates a year or so later) to entice borrowers. The low interest rates encouraged people to buy houses. We saw this link between interest rates and spending in Chapter 10 "Understanding the Fed".
Lenders are also more willing to give you a mortgage if they think the price of a house is going to increase. Normally, you need a substantial down payment to get a loan. But if your mortgage lender expects housing prices to rise, then the lender will think that it will have the option of taking back the house and selling it for a profit if you cannot repay your mortgage in the future.
Thus, the expectation of rising housing prices in the future increases the current demand for houses and thus the current price of houses. In the early and mid-2000s, rising housing prices were seen in many markets in the United States and elsewhere. The rise in prices was fueled at least in part by expectations, in a manner that is very similar to a coordination game.
However, the optimism that underlies the price increases can at some point be replaced by pessimism, leading instead to a decrease in housing prices. Looking back at our equation for the value of a house, how can we explain the decrease in housing prices in 2007 and 2008? Interest rates did not rise over that time. It also seems unlikely that the service flow from a house decreased dramatically. This suggests that the main factor explaining the collapse of housing prices was a drop in the expected future price of houses. Notice the self-fulfilling nature of expectations: if everyone expects an asset to decrease in value in the future, it decreases in value today.
But what happens when housing prices start to decrease? Suppose you had put down $20,000 and borrowed $200,000 from a bank to buy a $220,000 home. If the price of your house decreases to, say, $150,000, you might just walk away from the house and default on the loan. Of course, default does not mean that the house disappears. Instead, it is taken over by the bank. But the bank does not want the house, so it is likely to try to sell it. When lots of banks find themselves with houses that they do not want, then the supply of houses increases, and the price of houses decreases.
We now see that there is a vicious circle operating:
- Housing prices decrease.
- People default on their loans.
- Banks sell more houses in the market.
- Housing prices decrease even more.
This again looks a lot like a coordination game. If housing prices are low, there are more mortgage defaults and thus houses put on the market for sale. The increased supply of houses drives down housing prices even further.
The crisis of 2008 may have begun in the housing market, but it did not stop there. It spread beyond housing to all corners of the financial markets. As explained in Chapter 9 "Money: A User’s Guide", a loan from your perspective is an asset from the perspective of the bank. Banks that held mortgage assets did not simply hold on to those assets, but neither did they merely sell them on to other banks. Instead, they bundled them up in various creative ways and then sold these bundled assets to other financial institutions. These financial institutions in turn rebundled the assets for sale to other financial institutions and so forth. The bundling of assets was designed to create more efficient sharing of the risk in financial markets.Fannie Mae (http://www.fanniemae.com/kb/index?page=home) and Freddie Mac (http://www.freddiemac.com), two government created and supported enterprises, were among those involved in the bundling and reselling of mortgages to facilitate this sharing of risks. These companies are currently in conservatorship. But there were also costs: (1) it became harder to evaluate the riskiness of assets, and (2) the original bank had a reduced incentive to carefully evaluate the loans that it made because it knew the risk would be passed on to others. This incentive problem made the bundles of mortgage loans riskier.
The Policy Response in the United States
The US government did not stand idle as these events were unfolding. They took the following actions: (1) they provided more deposit insuranceA government program that insures the deposits (subject to some limits) of individuals at banks., (2) they decreased interest rates, (3) they facilitated various mergers and acquisitions of financial entities, and (4) they bailed out some financial institutions. Some of these actions were an outgrowth of policies enacted after the Great Depression. The most important of these, deposit insurance, is discussed next.
Guarantee Funds and the Role of Deposit Insurance
In Chapter 7 "The Great Depression", we explained that, during the Great Depression, much of the disruption to the financial system came through bank runs. But in 2007 and 2008, we did not see bank runs in the United States. This was a striking difference between the crisis of 2008 and the Great Depression. The absence of bank runs is almost certainly because deposit insurance “changes the game.” To see how, look at the bank-run coordination game in part (a) of Figure 15.1 "The Payoffs in a Bank-Run Game with and without Deposit Insurance". In particular, look at the outcome if other players run and you do not run. In that case you get zero, so this would be a bad decision. You do better if you choose to participate in the run, obtaining 20. If everybody else chooses to run on the bank, you should do the same thing. In this case, the bank fails. But if everyone else leaves their money in the bank, you should do likewise. In this case, the bank is sound. The fact that there are two possible equilibrium outcomes is what makes this a coordination game.
Deposit insurance, which is run by the Federal Deposit Insurance Corporation (FDIC; http://www.fdic.gov/deposit), insures the bank deposits of individuals (up to a limit). Suppose that deposit insurance provides each depositor who leaves money in the bank a payoff of 110 even if everyone else runs. Now the game has the payoffs shown in part (b) of Figure 15.1 "The Payoffs in a Bank-Run Game with and without Deposit Insurance". The strategy of “do not run” is now better than “run” regardless of what other people do. You choose “do not run”—as does everyone else in the game. The outcome is that nobody runs and the banks are stable. Remarkably, this policy costs the government nothing. Since there are no bank runs, the government never has to pay any deposit insurance. By changing the rules of the game, the government has made the bad equilibrium disappear.
Figure 15.1 The Payoffs in a Bank-Run Game with and without Deposit Insurance
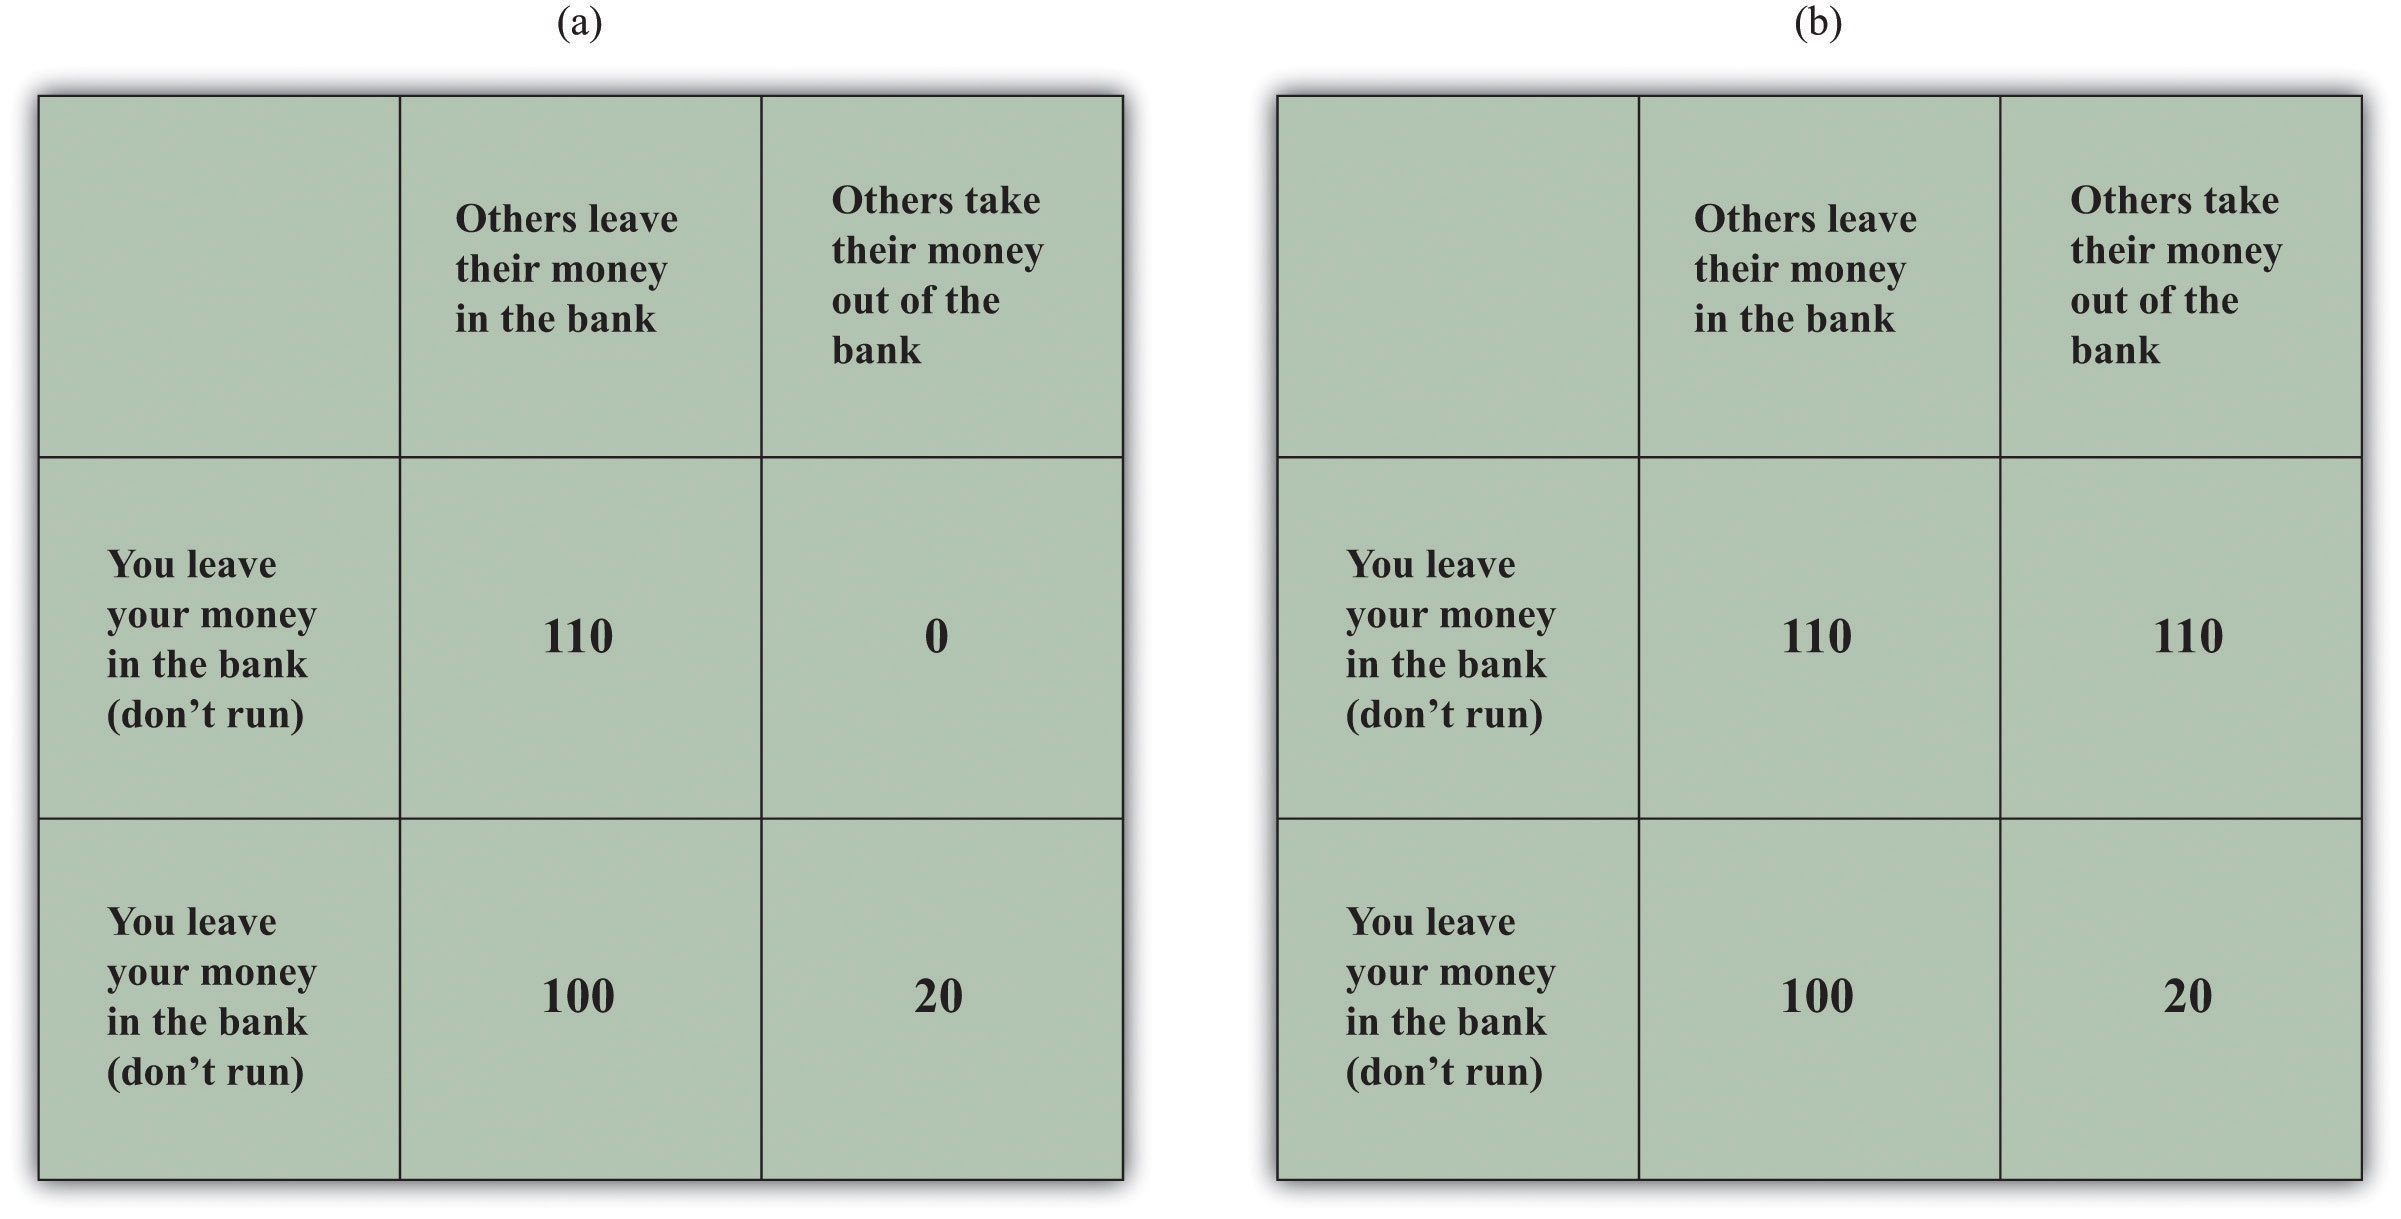
You deposit $100 in the bank. Part (a) shows payoffs without deposit insurance. There are two Nash equilibria: if all people leave their money in the bank, then you should do the same, but if all people make runs on the bank, you are better running as well. In Part (b), deposit insurance means that the game has a unique equilibrium.
Decreasing Interest Rates
Deposit insurance may have prevented bank runs, but credit markets still did not function smoothly during the crisis of 2008. So what else was going on in credit markets? During the financial crisis, the Federal Reserve (the Fed) decreased its target interest rate. The way in which it does this and its implications for the aggregate economy are covered in Chapter 10 "Understanding the Fed". The Federal Open Market Committee (FOMC) reduced the target federal funds rate from 4.75 percent in September 2007 to 1.0 percent by the end of October 2008 and 0.25 percent by the end of the year. The target rate is indicated in the last column of the Table 15.1 "The Federal Funds Rate: Target and Realized Rates".
However, the Fed lost its usual ability to tightly control the actual federal funds rate. We see this in the other columns of Table 15.1 "The Federal Funds Rate: Target and Realized Rates". The column labeled “average” is the average federal funds rate over the day. The highest and lowest rates during the day are indicated as well. Prior to September 2008, the average and target rates were very close, but from mid-September onward, the average rate frequently diverged from the target. In addition, the difference between the high and low rates was much higher after the middle of September 2008.
Table 15.1 The Federal Funds Rate: Target and Realized Rates
| Date | Average | Low | High | Target |
|---|---|---|---|---|
| October 14, 2008 | 1.1 | 0.25 | 2 | 1.5 |
| October 7, 2008 | 2.97 | 0.01 | 6.25 | 2 |
| September 29, 2008 | 1.56 | 0.01 | 3 | 2 |
| September 15, 2008 | 2.64 | 0.01 | 7 | 2 |
| July 16, 2008 | 1.95 | 0.5 | 2.5 | 2 |
Source: Data summarized from “Federal Funds Chart,” Federal Reserve Bank of New York, 2008, http://www.newyorkfed.org/charts/ff.
As we explained in Chapter 10 "Understanding the Fed", these low interest rates meant that the Fed had hit the zero lower bound on monetary policy. Because nominal interest rates cannot be less than zero, the Fed was no longer able to stimulate the economy using the normal tools of monetary policy. Because its traditional tools were proving less effective than usual, the Fed turned to other, unusual, policy measures. The Fed created several lending facilities through which it provided funds to financial markets. For example, a commercial paper funding facility was created on October 7, 2008, to promote liquidity in a market that is central to the credit needs of both businesses and households.These are summarized by the Board of Governors, “Information Regarding Recent Federal Reserve Actions,” Federal Reserve, accessed September 20, 2011, http://www.federalreserve.gov/newsevents/recentactions.htm. They are also discussed in the press release: “Press Release,” Federal Reserve, October 7, 2008, accessed September 20, 2011, http://www.federalreserve.gov/newsevents/press/monetary/20081007c.htm. The Board of Governors listed these as tools of the Fed in addition to three familiar tools: open-market operations, discount-window lending, and changes in reserve requirements.
Short-term interest rates, such as the overnight rate on interbank loans (the so-called LIBOR [London Interbank Offered Rate]), followed the Federal Funds rate down for much of 2008. (As the name suggests, this is the rate on loans that banks make to each other overnight.) But when the crisis became severe in September and October 2008, the LIBOR rose sharply.“US Dollar LIBOR Rates 2008,” accessed September 20, 2011, http://www.global-rates.com/interest-rates/libor/american-dollar/2008.aspx. This rate averaged just about 5 percent for the month of September and 4.64 percent in October.The data are from the British Bankers’ Association. Short-term rates increased despite the Fed’s attempts to reduce interest rates.
Why did these rates not decrease along with the Fed’s targeted federal funds rate? One explanation comes from the following equation:
loan rate × probability of loan repayment = cost of funds to the bank.On the left hand side is the loan rate charged by a bank—for example, the interest rate on a car loan, a household improvement loan, or a small business loan. The other term is the likelihood that the loan will actually be repaid. Together these give the expected return to the bank from making a loan. The right side is the cost of funds to the bank. This might be measured as the rate paid to depositors or the rate paid to other banks for loans from one bank to another. When this equation holds, the cost of the input into the loan process, measured as the interest cost on funds to the bank, equals the return on loans made. The bank does not then expect to make any profits or losses on the loan.
In Chapter 10 "Understanding the Fed", we argued that interest rates on loans usually follow the federal funds rate quite closely. If the Fed reduces the targeted federal funds rate, this reduces the cost of funds to banks. Banks typically follow by decreasing their lending rates. This close connection between the cost of funds and the loan rate holds true provided there is a stable probability of loan repayment. In normal times, that is (approximately) true, so variations in the federal funds rate lead directly to variations in loan rates.
During the fall of 2008, the link was weakened. Though the Fed reduced its targeted interest rate so that the cost of funds decreased, loan rates did not decrease. The reason was a fall in the perceived probability of loan repayment: banks perceived the risk of default to be much higher. Banks were cautious because they had suffered through the reduction in the value of mortgage-based assets and had seen some financial institutions fail. The state of the economy, with increasing unemployment and decreasing asset prices, led banks to be more prudent. In terms of our equation, the probability of repayment was decreasing at the same time as the cost of funds was decreasing. As a consequence, loan rates did not decrease as rapidly as the bank’s costs of funds.
There was also a reduction in the amount of lending. The quantity of loans decreased because banks became more careful about whom to lend to. When you go to a bank to borrow, it makes an evaluation of how likely you are to repay the loan. During the fall of 2008, bank loans became much more difficult to obtain because many customers were viewed as higher credit risks. Even more significantly, the uncertainty of repayment was not limited only to loans from banks to households. Many of the loans in the short-term market are from banks to other banks or to firms. Uncertainty over asset valuations, growing out of the belief that some mortgage securities were overvalued, permeated the market, making lenders less willing to extend credit to other financial institutions.
Another factor in keeping interest rates high was the behavior of investors who held deposits that were not covered by federal deposit insurance—particularly deposits in “money market funds.” In the early part of October 2008, there were huge outflows from money market funds into insured deposits as investors sought safety. This was a problem for the banking system, because it left the financial system with fewer funds to provide to borrowers. It also led short-term interest rates to rise.
So while the presence of deposit insurance was valuable in reducing the risk faced by individual households, banks still perceived higher lending risks. They therefore looked for ways to limit this risk. One prominent device they used is known as a credit default swap. This is a fancy term for a kind of financial insurance contract. The buyer of the contract pays a premium to the seller of the contract to cover bankruptcy risk. For example, suppose an institution owns some risky bonds issued by a bank. To shed this risk, the institution engages in a credit swap with an insurance provider.
These swaps played a big role in the stories of two key players in the financial crisis: American International Group (AIG) and Lehman Brothers. The US government eventually bailed out AIG, but Lehman Brothers went bankrupt. Because Lehman Brothers was an active trader of credit default swaps, their exit severely curtailed the functioning of this market. Without the added protection of these default swaps, lenders directly faced default risk and hence decided to charge higher loan rates. AIG was also a prominent player in the credit swap market.PBS Newshour provides a full report on AIG and credit swaps. They state that “AIG wrote some $450 billion worth of credit default swap insurance” of the $62 trillion of credit swaps. “Risky Credit Default Swaps Linked to Financial Troubles,” PBS Newshour, October 7, 2008, accessed September 20, 2011, http://www.pbs.org/newshour/bb/business/july-dec08/solmancredit_10-07.html. They sold insurance to cover many defaults, some linked directly to the holding of mortgages. As the mortgage crisis loomed, likely claims against AIG increased, putting them too on the brink of bankruptcy.
So although there were no bank runs during the crisis in the United States, credit markets were still severely disrupted. Given the centrality of the financial sector in the circular flow, disruption in the credit markets led to a downturn in overall economic activity. Put yourself in the place of a builder of new homes. Your customers are finding it hard to qualify for mortgages. As a result, the demand for your product is lower (the demand curve has shifted inward). Meanwhile (since the construction of a new home takes time), you need to borrow from a bank to finance payments to your suppliers of raw materials and to pay your carpenters and other workers. Tight credit markets mean that you find it more expensive to obtain funds: interest rates are higher, and the terms are less generous. Not surprisingly, disruption in the credit markets shows up particularly starkly in the market for new houses.
Facilitating Takeovers of Financial Firms
The problems of AIG, Lehman Brothers, and other financial firms led policymakers to worry about such firms going bankrupt. In some cases, these firms had too many bad assets on their books and were not able to continue in the market. One example is Bear Stearns, which was heavily involved in the trading of assets that were backed by mortgages. In March 2008, it became clear that those assets were highly overvalued. When the prices of these assets decreased, Bear Stearns was close to bankruptcy. With the help of a loan (http://www.federalreserve.gov/newsevents/press/other/other20080627a2.pdf) from the Board of Governors of the Federal Reserve (operating through the Federal Reserve Bank of New York), JPMorgan Chase and Company acquired Bear Stearns.
It is perhaps remarkable that the Fed took such an active role in this acquisition. When a local grocer goes out of business, you simply shift your business to another seller. Nobody expects the government to take a role in rescuing the store. But when we are talking about large financial firms, shifting from one financial intermediary to another may not be as easy. When a large institution fails, it is highly disruptive to the financial system as a whole. The minutes of the March 16, 2008, meeting of the Board of Governors confirm this view:
The evidence available to the Board indicated that Bear Stearns would have difficulty meeting its repayment obligations the next business day. Significant support, such as an acquisition of Bear Stearns or an immediate guarantee of its payment obligations, was necessary to avoid serious disruptions to financial markets.
Thus the Fed thought it was necessary to ensure the takeover of Bear Stearns and hence the continuation of its operations. In fact, prior to this takeover, Bear Stearns was listed among a small set of financial firms as “primary dealers.” These are financial intermediaries that are viewed as central to the orderly operation of financial markets and the conduct of monetary policy.The list of primary dealers is available at “Primary Dealers List,” Federal Reserve Bank of New York, accessed July 25, 2011, http://www.newyorkfed.org/markets/pridealers_current.html.
AIG received a loan up to $85 billion from the Fed in September 2008. The monetary authority was concerned that a failure of AIG would further destabilize financial markets. As part of this deal, the US government acquired a 79.9 percent equity ownership in AIG.See the announcement by the Board of Governors: “Press Release,” Board of Governors of the Federal Reserve System, September 16, 2008, accessed July 25, 2011, http://www.federalreserve.gov/newsevents/press/other/20080916a.htm. As authority for this action, this announcement by the Fed cites Section 13(3) of the Federal Reserve Act, which allows the Fed to provide this type of funding in “unusual and exigent” circumstances: “Section 13: Powers of Federal Reserve Banks,” Board of Governors of the Federal Reserve System, December 14, 2010, accessed July 25, 2011, http://www.federalreserve.gov/aboutthefed/section13.htm. AIG was special enough to warrant this government loan because of its role in providing insurance (through credit default swaps) against the default on debt by individual companies. Without this insurance, the debt of these companies becomes riskier, and they find it harder to borrow. AIG was a large enough actor in this market for its departure to have meant severe disruptions in the provision of insurance.
In contrast to these actions for Bear Stearns and AIG, the Fed did nothing to help Lehman Brothers, a 158-year-old financial firm. It went out of business in September 2008. There was no bailout for this company from the Fed or the US Treasury. It simply disappeared from the financial markets.
A $700 Billion Bailout
In October 2008, Congress passed and the president signed legislation called the “Emergency Economic Stabilization Act of 2008” to provide $700 billion in funding available to the Department of the Treasury. The legislation authorized the Treasury (http://www.house.gov/apps/list/press/financialsvcs_dem/essabill.pdf) to purchase mortgages and other assets of financial institutions (including shares) to create a flow of credit within the financial markets. The Treasury Department then set up a Troubled Asset Relief Program as a vehicle for making asset purchases. In addition to these measures, the legislation called for an increase in FDIC deposit insurance to cover deposits up to a cap of $250,000 instead of the standard cap of $100,000.See “Insured or Not Insured?,” Federal Deposit Insurance Corporation, accessed July 25, 2011, http://www.fdic.gov/consumers/consumer/information/fdiciorn.html. The FDIC does not insure money market funds, though these were protected under a temporary Treasury program: “Frequently Asked Questions about Treasury’s Temporary Guarantee Program for Money Market Funds,” US Department of the Treasury, September 29, 2008, accessed September 20, 2011, http://www.treasury.gov/press-center/press-releases/Pages/hp1163.aspx.
One interesting element of the bailout legislation was the explicit interaction of the Treasury and the Fed. A joint statement issued after the passage of this act indicated that these players in the conduct of fiscal and monetary policy were working together to resolve the crisis. In the United States, the Treasury and the Fed each contributed to the financing of these rescue packages.
In Chapter 11 "Inflations Big and Small", we pointed out that
government deficit = change in government debt + change in money supply.In other words, when the government runs a deficit, it must finance this deficit by either issuing more debt or printing money. This equation is consistent with the institutional structure in the United States where the Treasury and the Fed are independent entities. In effect, the Treasury issues debt to finance a deficit, then some of that debt is purchased by the Fed. When the Fed purchases debt, it injects new money into the economy.
Key Takeaways
- Though there were no bank runs in the United States during the crisis of 2008, the structure of coordination games is useful for thinking about instability of the housing sector, the interactions of banks within the financial system, and the interaction between income and spending.
- During the crisis, the Fed moved aggressively to decrease interest rates and provide liquidity to the system.
- The George W. Bush administration created a $700 billion program to purchase or guarantee troubled assets, such as mortgages and shares of financial firms.
Checking Your Understanding
- As the probability of default increases, what happens to the lending rate?
- What is a credit default swap?
- Why does the sale of bank-owned houses cause the price of houses to decrease?
- We said that deposit insurance was available in 2008. Was it available during the Great Depression?
15.2 From Financial Crisis to Recession
Learning Objectives
After you have read this section, you should be able to answer the following questions:
- How did the financial crisis spread to the aggregate economy?
- What was the fiscal policy response?
- What was the monetary policy response?
So far we have focused on the financial side of the crisis of 2008 because the initial stage of the crisis was within the financial sector. As in the Great Depression, though, the disruptions in the financial sector then spread to the rest of the economy.
From Housing to the Aggregate Economy
The crisis of 2008 saw financial disruptions spread from financial markets to the economy at large. In Chapter 7 "The Great Depression", we introduced the aggregate expenditure model to understand the reduction in economic activity in the early 1930s. That same framework is useful in understanding recent events.
Toolkit: Section 16.19 "The Aggregate Expenditure Model"
You can review the aggregate expenditure model in the toolkit.
The aggregate expenditure model takes as its starting point the fact that gross domestic product (GDP) measures both total spending and total production. When planned and actual spending are in balance,
real GDP = planned spending = autonomous spending + marginal propensity to spend × real GDP.Autonomous spending is the intercept of the planned spending line. It is the amount of spending that there would be in the economy if income were zero. The equilibrium level of real GDP is as follows:
The framework tells us that a reduction in autonomous spending leads to a decrease in real GDP.
Just as in the Great Depression, the two leading candidates for the decrease in autonomous spending are consumption and investment. Specifically, the crisis in the housing market had two significant implications for the rest of the economy. First, the decrease in housing prices starting in 2008 reduced the wealth of many households. Because households were poorer, they reduced their consumption. Second, the disruptions in the financial system made it difficult for firms to obtain financing, which meant that there was less investment. The aggregate expenditure model teaches us that these reductions in consumption and investment can lead to a reduction in real GDP.
Reductions in autonomous spending are magnified through the circular flow of income. As spending decreases, income decreases, leading to further reductions in spending. This is the multiplier process; it shows up as the term 1/(1 − marginal propensity to spend), which multiplies autonomous spending in the expression for real GDP.
Toolkit: Section 16.16 "The Circular Flow of Income"
You can review the circular flow of income and the multiplier in the toolkit.
Stabilization Policy
We have already observed that, in contrast to the Great Depression, policymakers in the crisis of 2008 took several actions to try to address the economic problems. In addition to the measures aimed specifically at dealing with problems in the financial markets, policymakers turned to monetary and fiscal policy in an attempt to counteract the economic downturn.
To begin our discussion of this stabilization policy, it is useful to start with a summary of the state of the economy in the 2006–10 period. By so doing, we are making life somewhat easier for us than it was for policymakers because they did not know in early 2009 what would happen in the aggregate economy during that year. The annual growth rates of the main macroeconomic variables during the crisis are highlighted in Table 15.2 "State of the Economy: Growth Rates from 2006 to 2010". All variables are in percentage terms.
From Table 15.2 "State of the Economy: Growth Rates from 2006 to 2010", you can see how US real GDP growth slowed in 2007, stalled in 2008, and turned negative in 2009. The recovery in 2010 had a positive growth rate slightly larger than the decline in 2009. Had these growth rates been identical in absolute value, the economy would have recovered, roughly speaking, to the 2008 level of real GDP. The annual growth rate of real GDP in the last quarter of 2010 was a robust 3.1 percent, but the growth rate in the first quarter of 2011 was only 1.8 percent. Concerns remain over the viability of the current recovery.
The next four columns of Table 15.2 "State of the Economy: Growth Rates from 2006 to 2010" show that the declines in real GDP came largely from spending on investment and durables by firms and households. Housing played a particularly significant role. This fits with the theory of consumption smoothing that we discussed in Chapter 12 "Income Taxes" and Chapter 13 "Social Security". The last column shows the unemployment rate. Although the economy enjoyed positive real GDP growth in 2010, the unemployment rate remained high.A recent BLS publication looked at job creation and job destruction up to 2009 to try to understand the slow recovery of unemployment. “Business Dynamics Statistics Briefing: Historically Large Decline in Job Creation from Startup and Existing Firms in the 2008–2009 Recession,” U.S. Census Bureau’s Business Dynamics Statistics, March 2011, accessed September 20, 2011, http://www.ces.census.gov/docs/bds/plugin-BDS%20March%202011%20single_0322_FINAL.pdf.
Table 15.2 State of the Economy: Growth Rates from 2006 to 2010
| Year | GDP | Consumption | Household Durables | Investment | Housing | Unemployment Rate (%) |
|---|---|---|---|---|---|---|
| 2006 | 2.7 | 2.9 | 4.1 | 2.7 | −7.3 | 4.4 |
| 2007 | 1.9 | 2.4 | 4.2 | −3.1 | −18.7 | 5.0 |
| 2008 | 0.0 | −0.3 | −5.2 | −9.5 | −24.0 | 7.4 |
| 2009 | −2.6 | −1.2 | −3.7 | −22.6 | −22.9 | 10.0 |
| 2010 | 2.9 | 1.7 | 7.7 | 17.1 | -3.0 | 9.6 |
Source: Bureau of Economic Analysis, Department of Commerce (http://www.bea.gov/newsreleases/national/gdp/2010/txt/gdp2q10_adv.txt and http://www.bea.gov/newsreleases/national/gdp/2011/pdf/gdp1q11_2nd.pdf) and Bureau of Labor Statistics (http://www.bls.gov/cps).
Fiscal Policy
One of the priorities of the Obama administration after taking office in January 2009 was to formulate a stimulus package to deal with the looming recession. As is clear from Table 15.2 "State of the Economy: Growth Rates from 2006 to 2010", growth in the economy was near zero for the preceding year, and the unemployment rate was much higher than it had been in the previous two years. Although the financial rescue plans of the George W. Bush administration may have stemmed the financial crisis, the aggregate economy was now limping along at best.
The American Recovery and Reinvestment Act of 2009 (ARRA) was signed into law on February 17, 2009. The stimulus package contained approximately $800 billion in spending increases and tax cuts. These numbers are approximate for a couple of reasons: (1) parts of the package depend on the state of the economy in the future, so the exact outlays are not determined in the legislation, and (2) the disbursements were not all within a single year, so the timing of the outlays and thus their discounted present value could not be precisely known at the time of passage.
The package contained a mixture of spending increases and tax cuts. According to a Congressional Budget Office (CBO) study (http://www.cbo.gov/ftpdocs/106xx/doc10682/Frontmatter.2.2.shtml) from November 2009, federal government purchases of goods and services were to increase by about $90 billion over the 2009–19 period. Transfer payments to households were set to increase by about $100 billion, and transfers to state and local governments were to increase by nearly $260 billion. This last category of outlays was quite visible, taking the form of road projects and other construction in towns across the United States. Interestingly, the federal government was investing in infrastructure, thus building up the public component of the capital stock.
In the same publication, the CBO provided a summary of ARRA’s macroeconomic effects in November 2009. At that point, due to ARRA, the CBO estimated that federal government outlays (not only spending on goods and services) had increased by about $100 billion, and tax collections were lower by about $90 billion. So clearly some but not the entire stimulus went into the US economy within seven months of ARRA’s passage. The CBO also produced its own assessment of the effects of ARRA through September 2009. To do so, it had to use an economic model to calculate the effects of the increases in outlays and reductions in taxes. In many ways, the framework for the assessment is quite similar to the analysis of the Kennedy tax cuts we discussed in Chapter 12 "Income Taxes".
According to the CBO, ARRA meant that real GDP in the United States was between 1.2 percent and 3.2 percent higher than it would otherwise have been, whereas the unemployment rate was between 0.3 and 0.9 percentage points lower. These numbers were obtained by attaching a multiplier to each component of the stimulus package and calculating the change in real GDP from that component. For example, the CBO estimated that the multiplier associated with federal government purchases of goods and services was between 1 and 2.5. The effect of this federal spending on real GDP is simply the product of the spending of the federal government funded under ARRA times the multiplier. The CBO did this calculation for each component of the stimulus package and then added up the effects on real GDP. The range of the effects reflects the range for each multiplier used in their analysis. The CBO also calculated that 640,000 jobs were either created or retained due to ARRA. This calculation underlies their estimate of how much ARRA reduced the unemployment rate in the United States.
Some economists have disputed the effects of ARRA on economic activity, however. John Taylor, a Stanford University economist, argued that the short-term nature of the tax cuts meant that most households simply saved the tax cut, as the theory of consumption smoothing predicts. This argument was supported by evidence of increasing saving rates by households in the United States during the period of the tax cuts.Testimony reproduced in John B. Taylor, “The 2009 Stimulus Package: Two Years Later,” Hoover Institution, February 16, 2011, accessed September 20, 2011, http://media.hoover.org/sites/default/files/documents/2009-Stimulus-two-years-later.pdf.
During 2010 and 2011, there were some calls for further stimulus. The unemployment rate in the United States remained high despite the stimulus; it was 9.5 percent in July 2010. The Bureau of Labor Statistics (http://www.bls.gov/news.release/empsit.b.htm) tells us that while job creation had been brisk in May 2010 at 432,000 jobs, the total job destruction in June and July 2010 was 350,000. Further, real GDP growth was only 2.4 percent in the second quarter of 2010, down from 3.7 percent in the first quarter. Together this news put more pressure on policymakers to conduct further attempts at stabilization policy.
But at the same time, policymakers became increasingly concerned about the long-run fiscal health of the government. In effect, they began to worry about the government budget constraint, which we explained in Chapter 14 "Balancing the Budget". The attention of policymakers moved away from stimulus and toward “fiscal consolidation.” This culminated in a political battle in the summer of 2011 over an increase in the debt ceiling, a limit on the amount of US debt outstanding. Ultimately an agreement was reached to allow an increase in the ceiling, but this agreement was combined with a reduction in government spending of nearly $900 billion over the coming 10 years and an agreement to seek further cuts in spending amounting to another $1.5 trillion.The bill passed by the House of Representatives is contained here: “Text of Budget Control Act Amendment,” House of Representatives Committee on Rules, accessed September 20, 2011, http://rules.house.gov/Media/file/PDF_112_1/Floor_Text/DEBT_016_xml.pdf. This agreement was not enough to avert a downgrade of US debt from AAA to AA+ by Standard and Poors.The decision to downgrade the debt is discussed at “Research Update: United States of America Long-Term Rating Lowered to ‘AA+’ on Political Risks and Rising Debt Burden; Outlook Negative,” Standard & Poor’s, August 5, 2011, accessed September 20, 2011, http://www.standardandpoors.com/servlet/BlobServer?blobheadername3 =MDT-Type&blobcol=urldata&blobtable=MungoBlobs&blobheadervalue 2=inline%3B+filename%3DUS_Downgraded_AA%2B.pdf&blobheadername2=Content-Dis position&blobheadervalue1=application%2Fpdf&blobkey=id&blob headername1=content-type&blobwhere=1243942957443&blobh eadervalue3=UTF-8.
Monetary Policy
The current state of monetary policy is well summarized in the Federal Open Market Committee (FOMC) statement of August 10, 2010. Here is an excerpt:“Press Release,” Federal Open Market Committee, August 10, 2010, accessed July 26, 2011, http://www.federalreserve.gov/newsevents/press/monetary/20100810a.htm.
Press Release
Release Date: August 10, 2010
For immediate release
Information received since the Federal Open Market Committee met in June indicates that the pace of recovery in output and employment has slowed in recent months.… Nonetheless, the Committee anticipates a gradual return to higher levels of resource utilization in a context of price stability, although the pace of economic recovery is likely to be more modest in the near term than had been anticipated.
Measures of underlying inflation have trended lower in recent quarters and, with substantial resource slack continuing to restrain cost pressures and longer-term inflation expectations stable, inflation is likely to be subdued for some time.
The Committee will maintain the target range for the federal funds rate at 0 to 1/4 and continues to anticipate that economic conditions, including low rates of resource utilization, subdued inflation trends, and stable inflation expectations, are likely to warrant exceptionally low levels of the federal funds rate for an extended period.
To help support the economic recovery in a context of price stability, the Committee will keep constant the Federal Reserve’s holdings of securities at their current level by reinvesting principal payments from agency debt and agency mortgage-backed securities in longer-term Treasury securities.…
Voting for the FOMC monetary policy action were: Ben S. Bernanke, Chairman; William C. Dudley, Vice Chairman; James Bullard; Elizabeth A. Duke; Donald L. Kohn; Sandra Pianalto; Eric S. Rosengren; Daniel K. Tarullo; and Kevin M. Warsh.
Voting against the policy was Thomas M. Hoenig, who judges that the economy is recovering modestly, as projected. Accordingly, he believed that continuing to express the expectation of exceptionally low levels of the federal funds rate for an extended period was no longer warranted and limits the Committee’s ability to adjust policy when needed.…
We can make several observations about this FOMC statement. First, the FOMC shared the general perception that the recovery is not very robust and is showing signs of slowing. Their response was to maintain the targeted federal funds rate at between 0 and 0.25 percent. The FOMC put the targeted rate into this range in December 2008; in August 2011 the Fed indicated that it would keep rates low for at least another two years.You can find the FOMC statements and minutes of the meetings from December 2008 onward at “Meeting Calendars, Statements, and Minutes (2006–2012),” Federal Reserve, accessed July 26, 2011, http://www.federalreserve.gov/monetarypolicy/fomccalendars.htm.
Second, the FOMC talks about “reinvesting principal payments from agency debt and agency mortgage-backed securities….” This somewhat complicated phrase refers to the fact that the Fed purchased various assets in the attempt to keep financial markets working during the financial crisis.Those programs are summarized at “Credit and Liquidity Programs and the Balance Sheet,” Federal Reserve, accessed July 26, 2011, http://www.federalreserve.gov/monetarypolicy/bst_crisisresponse.htm. As reported by the Fed, “[s]ince the beginning of the financial market turmoil in August 2007, the Federal Reserve’s balance sheet has grown in size and has changed in composition. Total assets of the Federal Reserve have increased significantly from $869 billion on August 8, 2007, to well over $2 trillion.”The Fed maintains an interactive web site that displays and explains its balance sheet items. “Credit and Liquidity Programs and the Balance Sheet,” Federal Reserve, accessed July 26, 2011, http://www.federalreserve.gov/monetarypolicy/bst_recenttrends.htm. Observers are waiting for the Fed to reduce its holdings of these assets. The policy statement indicated that the Fed was not yet ready to take those steps.
The final point concerns the position of Thomas Hoenig, the president of the Federal Reserve Bank of Kansas City. Over the year, he took the view that monetary policy was too lax. As the economy recovered, there was, he believed, no longer any need to keep interest rates at such low levels. One of the implicit concerns here is that periods of low interest rates have tended to promote bubbles in assets, such as housing. The FOMC had to weigh this concern against the view that, with a slow economic recovery and no signs of inflation, expansionary monetary policy was still warranted. When the FOMC took the unusual decision to commit to low interest rates for two years, three members of the committee dissented from the decision.
Key Takeaways
- Disruptions in the financial system led to reductions in consumption and investment, which led to a decrease in real GDP.
- An $800 billion stimulus package was passed in February 2009 to offset the recessionary effects of the financial crisis.
- From December 2008 through (at least) the summer of 2011 the target federal funds rate was near zero.
Checking Your Understanding
- If the federal funds rate is near zero, what is the real return on a loan in that market? (Hint: if you are not sure about the answer, look up the Fisher equation in the toolkit for more information.)
- In Table 15.2 "State of the Economy: Growth Rates from 2006 to 2010", what items are counted as investment?
- If the CBO calculates that the multiplier on tax cuts is 1.5 and taxes are cut by $100 billion, how much will GDP change by?
15.3 The Crisis in Europe and the Rest of the World
Learning Objectives
After you have read this section, you should be able to answer the following questions:
- What are the ways the crisis spread from the United States to the rest of the world?
- In what ways did the institutional structure of the European Union (EU) hamper Europe’s ability to cope with the crisis?
In Chapter 9 "Money: A User’s Guide", we spoke of the day when people in several European countries woke up to a new monetary regime that used different pieces of paper than were used previously. In that chapter we used that experience to help us understand why people hold money. When these countries adopted the euro, they were not expecting to wake up about a decade later to read something like this:
“On the eve of a confidence vote that may bring down Papandreou’s government, euro-area finance ministers pushed Greece to pass laws to cut the deficit and sell state assets. They left open whether the country will get the full 12 billion euros ($17.1 billion) promised for July” as part of last year’s 110 billion-euro lifeline.
“We forcefully reminded the Greek government that by the end of this month they have to see to it that we are all convinced that all the commitments they made are fulfilled,” Luxembourg Prime Minister Jean-Claude Juncker told reporters early today after chairing a crisis meeting in Luxembourg.James G. Neuger and Stephanie Bodoni, “Bailout Bid for Greece Falters as Europe Insists Papandreou Cut Budget Gap,” June 20, 2011, accessed July 26, 2011, http://www.bloomberg.com/news/2011-06-20/europe-fails-to-agree-on-greek-aid-payout-pressing-papandreou-to-cut-debt.html; Karen Kissane, “EU puts brakes on loan to Greece,” Sydney Morning Herald, June 21, 2011, accessed July 26, 2011, http://www.smh.com.au/world/eu-puts-brakes-on-loan-to-greece-20110620-1gbxw.html; James Neuger and Stephanie Bodoni, “Europe Fails to Agree on Greek Aid Payout,” June 20, 2011, accessed September 20, 2011, http://www.bloomberg.com/news/2011-06-20/europe-fails-to-agree-on-greek-aid-payout-pressing-papandreou-to-cut-debt.html.
The euro was established by the Maastricht Treaty, but the implications of that treaty went beyond the introduction of new pieces of paper. The nature of fiscal and monetary interactions across the countries within the Economic and Monetary Union (EMU) changed dramatically as well.
On the monetary side, in addition to losing their national currencies, the countries that joined the euro effectively lost their central banks. The Central Bank of Italy, say, which formerly conducted monetary policy in that country, handed over that duty to the European Central Bank (ECB). The same thing happened in other countries. Most significantly, the German Bundesbank, which was one of the most important central banks in the world, also ceded its powers to the ECB. Further, the Maastricht Treaty—and the Stability and Growth Pact that followed a few years later—placed restrictions on fiscal policy by member countries.For a discussion of the history and content of the Stability and Growth Pact, see “Stability and Growth Pact,” European Commission Economic and Financial Affairs, accessed September 20, 2011, http://ec.europa.eu/economy_finance/sgp/index_en.htm. Prior to the introduction of the euro, member governments had complete discretion over their fiscal policy. Within the EMU, however, constraints on deficit spending were placed on member countries.
Taken together, these two factors radically changed the conduct of monetary and fiscal policy in the countries of the EMU. Some commentators questioned whether adequate tools for stabilization of aggregate economies were still available. Others wondered whether the constraints on fiscal policy would be violated by member countries, leading to the possibility of a debt crisis for a country within the euro area. In that event, how would the other member countries respond?
The crisis of 2008 provided the first big tests of these questions. Debt problems—not only in Greece but also in Portugal and Ireland—revealed that these concerns were well placed. We start by discussing how the crisis spread from the United States to Europe and then turn to the policy actions within Europe.
Sources of Spillovers
In Chapter 5 "Globalization and Competitiveness", we explained how countries are linked through the flows across national borders of goods, services, labor, financial capital, and information. Countries do not exist in isolation, and these linkages imply that problems in one country can be transmitted to others. In the crisis of 2008, we can point to three broad channels of spillover from the United States to the rest of the world:
- Within financial markets across borders (integrated financial markets)
- From financial markets into real markets in the United States, followed by real spillovers across countries
- Contagion effects through market psychology
The first two linkages can be seen in the circular flow of income in Figure 15.2 "The Foreign Sector in the Circular Flow". In this version of the circular flow, we highlight the interactions between a single country and the rest of the world. These interactions operate through the flows of goods and services and financial assets. During good times, they are a key part of the workings of the world economy. But during bad times, such as a financial crisis, these same links create channels for the sharing of financial crises.
Figure 15.2 The Foreign Sector in the Circular Flow
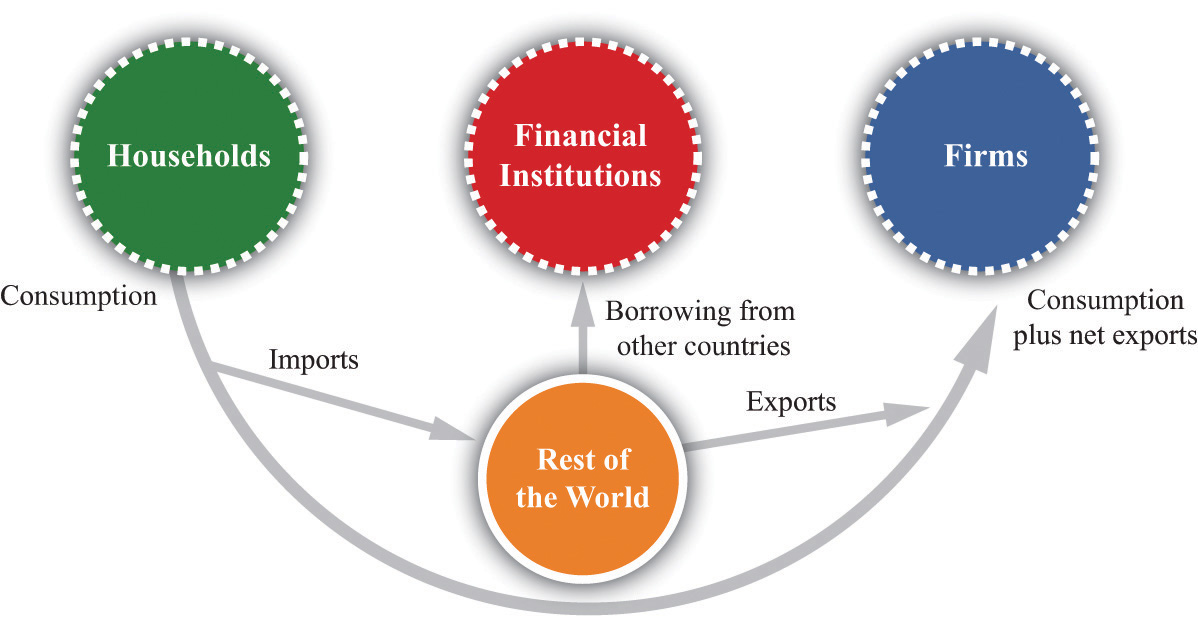
Households purchase goods from other countries; these are called imports. Citizens of other countries purchase our products; these are called exports. A trade deficit requires borrowing from the rest of the world.
There are three international flows in Figure 15.2 "The Foreign Sector in the Circular Flow":
- Exports. Households, firms, and the government in the rest of the world purchase goods and services produced in the home country.
- Imports. Households (and also firms and the government) purchase goods and services produced in the rest of the world.
- Financial flows. Financial intermediaries in the home country buy and sell financial assets flows from/to the rest of the world. The net flow can go in either direction; Figure 15.2 "The Foreign Sector in the Circular Flow" shows the case where there is a net flow of money into the home country.
International Spillovers in Financial Markets
One channel through which the crisis of 2008 spread was the holding of US financial assets by governments, financial institutions, and banks in other countries. Take, for example, mortgages that were marketed and issued in the United States. These mortgages were usually not ultimately held by the banks that issued them to homeowners. Instead they were bundled together with other mortgages and then resold.
These “mortgage-backed securities” were marketed and sold all over the world, not just in the United States. This means that any risk associated with these assets was shared across investors in different countries. The spread of this risk across world markets also provided a way for the crisis to propagate across countries. When it became clear that these assets were less valuable than investors had previously thought, the reduction in their price reduced the wealth of investors all over the globe. Moreover, the various financial institutions in the United States that were either bought out or went bankrupt were partly owned by investors in other countries. Thus financial links across the world economy provided one avenue for the spread of the crisis.
Second, the financial flows across countries played a significant role in the spread of the crisis. Since the early 1970s, the United States has run current account deficits each year. One consequence of this is that it has been borrowing from abroad to finance these deficits. In other words, foreigners hold substantial amounts of US assets. These assets include US government debt and, in many cases, large amounts of mortgage-backed securities.
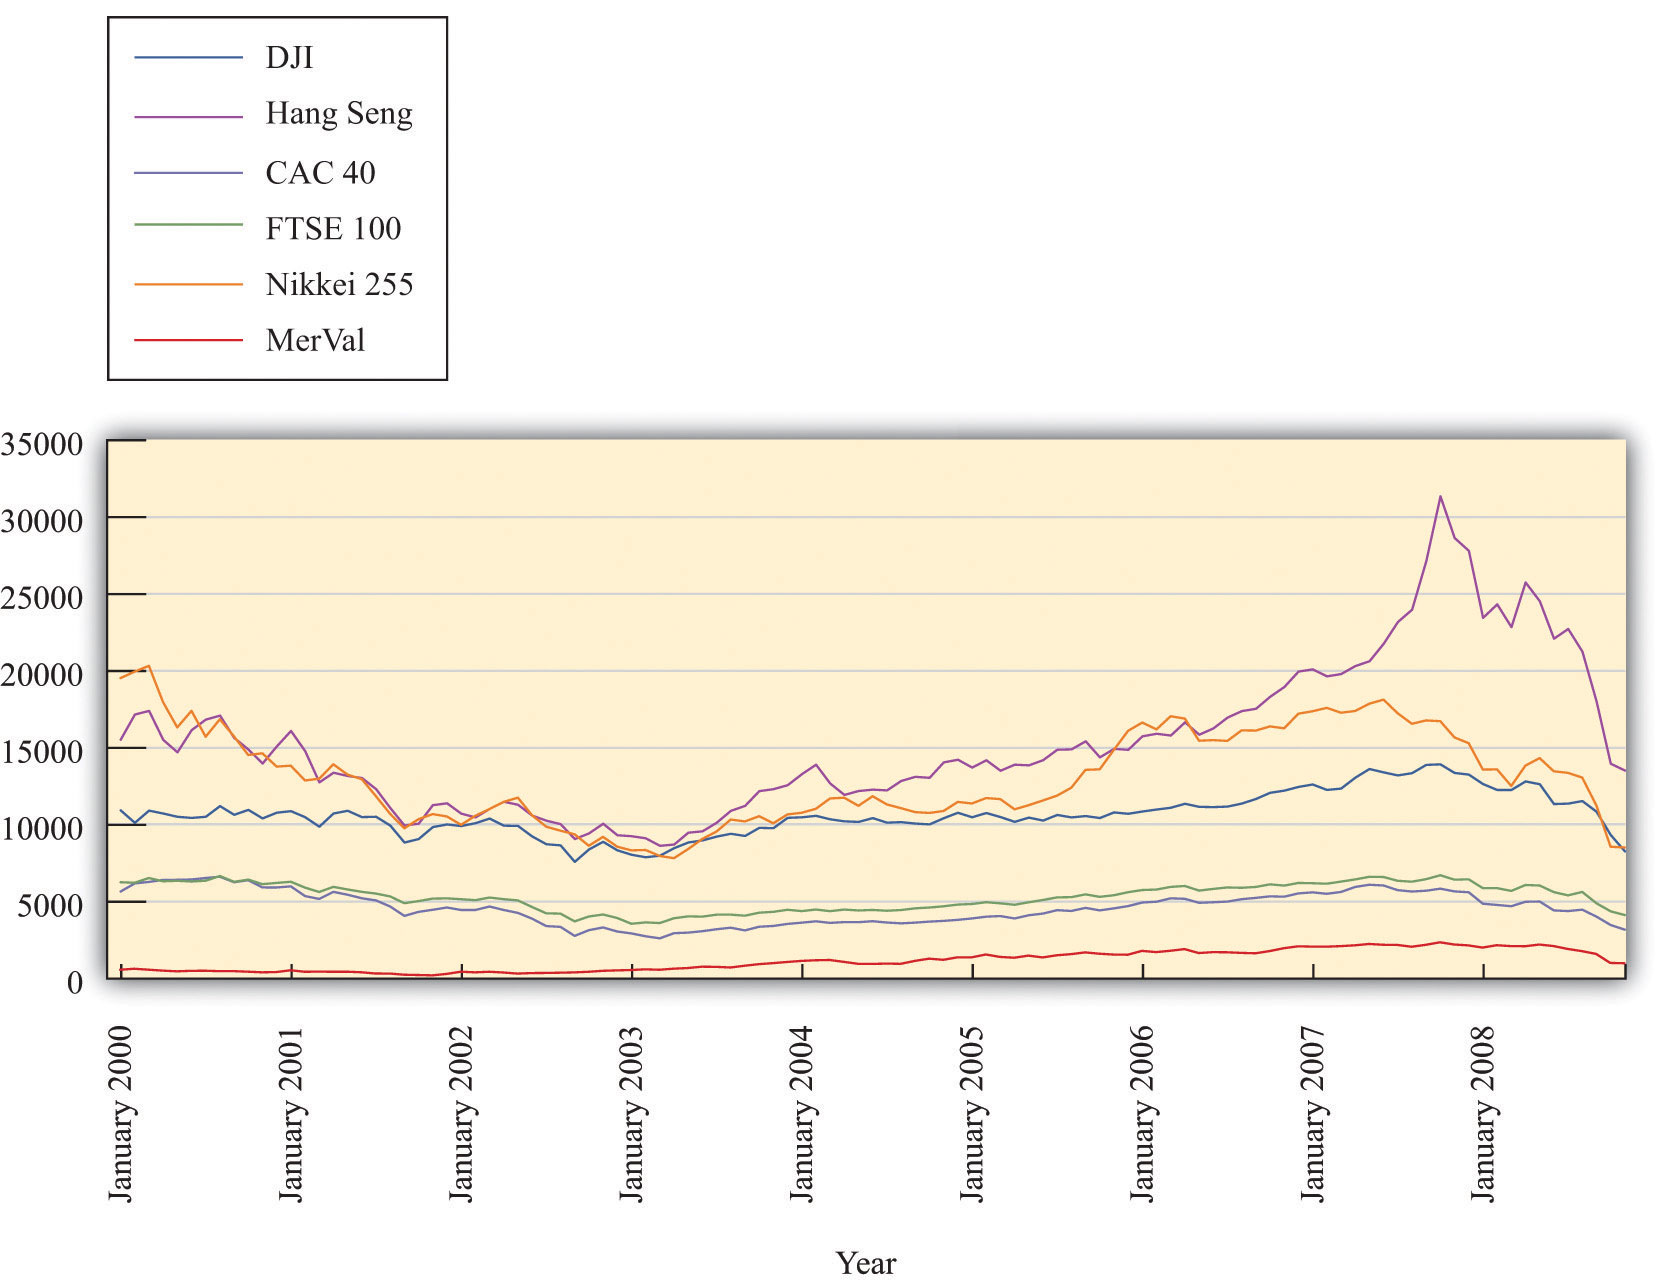
One way to see the extent of these financial interactions is to look at the behavior of stock markets around the globe. Figure 15.3 "Stock Markets around the World Crashed Together" shows the values for six indices around the world: the Dow Jones Industrial Average (United States), CAC (France), FTSE (United Kingdom), Hang Seng (China), Nikkei (Japan), and Merval (Argentina). The figure shows that the last six months of 2008 were problematic for stock markets across many countries.
Figure 15.3 Stock Markets around the World Crashed Together
Spillovers through the Trade of Goods and Services
Trade is another source of linkage across countries. Because countries sell goods and services to each other, a recession in one country will naturally spread to others. If the major trading partners of a country are in a recession, then there will be a reduced demand for the goods and services produced by that country. So, for example, if the United States enters into a recession as a consequence of financial market distress, then the demand for goods and services produced in other countries will decrease. This reduction in aggregate spending in other countries will then lead to lower economic activity in those countries.
Spillovers through Expectations
The circular flow of income shows two of the three spillovers we have identified: financial flows and trade flows. The third spillover has to do with people’s perceptions and expectations about market outcomes. There are two parts to this linkage: (1) expectations matter, and (2) outcomes in one market can have effects in others. The second of these is termed a contagion effectAn effect when an outcome in one market effects the beliefs and thus the behavior of participants in other markets, perhaps in another country..
To the extent that part of the financial distress is due to pessimism, as suggested by the coordination game we discussed in Section 15.1 "The Financial Crisis in the United States", this too is likely to spread across countries. If, day after day, the news from the United States is that the prices of stock and other assets are decreasing, investors in other countries may begin to share this pessimism. This will lead them to sell their assets, leading to decreases in the prices of the assets that they are selling. Decreasing asset prices can feed on themselves through pessimistic expectations. As an example, consider again the September 2008 bankruptcy of Lehman Bros.Landon Thomas Jr., “Examining the Ripple Effect of the Lehman Bankruptcy, New York Times, September 15, 2008, accessed July 26, 2011, http://www.nytimes.com/2008/09/15/business/worldbusiness/15iht-lehman.4.16176487.html.
“Everybody is frozen here after Lehman,” said one senior executive from a major financial institution who was paying visits this week to all the major sovereign funds in Asia and the Middle East. His voice was worn from hours spent in conference rooms trying to explain to clients why Lehman failed and who might be next. “Its just fear.”
In Section 15.1 "The Financial Crisis in the United States", we gave an equation to explain the price of an asset—specifically, a house. A key part of that equation is that the value of a house today depends in part on the price of the house expected in the future. To emphasize this key point again: if you think that people will pay a lot for a house a year from now, you will be willing to pay a lot for it today. The logic applies to all other assets as well, so there is a link between prices expected for the future and prices today. Think about a stock that you might buy on the New York Stock Exchange. The stock yields a dividend and also has a future price. The higher the price you expect the stock can sell for in the future, the more you are willing to pay for the stock today. Expectations matter.
But where do these expectations come from? During normal times, expectations are disciplined by the usual state of a market. If housing prices have been rising by say 3 percent a year for the past 20 years, most people will predict that over the next year, housing prices will again rise by 3 percent. Most of the time that prediction will be roughly right—but not all the time. Sometimes markets are subject to unpredictable movements in prices. When asset prices decline rapidly and unexpectedly, this is often referred to as a “bubble bursting.”
All this discussion suggests that asset prices can be somewhat fragile—and this is where contagion effects can come into play. If you are trading houses in one location and the prices of houses in other locations are all decreasing quickly, you might get concerned that whatever is hurting housing values in those markets will affect yours as well. If so, you might be tempted to try to sell the houses that you own. Of course, others think the same way. As a consequence, the price of houses in your location decreases as well. This is the contagion effect: the behavior of prices in other markets influences expectations in your market and leads to a price reduction in your market. You and the other market participants who feared a decrease in prices are, in the end, correct. In that sense, contagion effects can be self-fulfilling prophesies.
The Crisis in the EMU
When the crisis hit in the United States, the secretary of the Treasury and the chairman of the Board of Governors of the Federal Reserve System held a joint press conference. By so doing, they made it clear that, in the United States, monetary and fiscal policy were being used jointly to resolve the financial crisis. In Europe, the picture was very different. As we have explained, countries within the EMU have a common central bank but do not have a common fiscal policy. Fiscal policy is decided at the country level, while the ECB is supposed to target the overall European inflation rate (as discussed in Chapter 10 "Understanding the Fed") and is not supposed to play any role in bailing out individual governments.
This system may work in normal times. The events of the crisis of 2008 revealed that it did not work so well in abnormal times; this in turn led to some calls for change.
Sarkozy Calls for “Economic Government” for Eurozone
French President Nicolas Sarkozy called Tuesday for “clearly identified economic government” for the eurozone, working alongside the European Central Bank.
“It is not possible for the eurozone to continue without clearly identified economic government” Sarkozy told the European Parliament in Strasbourg.
The European Central Bank, currently the only joint institution overseeing the 15-nation eurozone, “must be independent,” but the Frankfurt-based monetary body “should be able to discuss with an economic government,” Sarkozy added.See “Sarkozy Calls for ‘Economic Government’ for Eurozone,” The Economic Times, October 21, 2008, accessed July 25, 2011, http://articles.economictimes.indiatimes.com/2008-10-21/news/28393734_1_eurozone-french-president-nicolas-sarkozy-economic-government.
President Sarkozy’s concern was that there is no centralized entity in the EU that can play the same role as the Treasury in the United States. Member governments devise their own fiscal policies to deal with their own country’s problems and do not take account of the effects of their actions on others in the European Union. This matters because the EU countries are so closely linked through trade and capital flows.
Governments within the EU did indeed act unilaterally to preserve their individual banking systems. The French government agreed to a 360 billion euro package of support for the French banking system and made a statement that no banks would collapse. Other countries took similar measures to restore confidence in their banking systems. Such measures sound similar to those taken in the United States, but there is an important difference. For the United States, such spending could be financed by taxes, government borrowing, or monetary expansion. But for, say, France, the equation is different. If the rescue package is not financed by increased taxes, then the French will have to issue more debt. They no longer control their money supply, so they cannot print currency to finance these bailouts.
Moreover, the Stability and Growth Pact, as we explained, places restrictions on the permissible magnitude of deficits by member governments. The reason for these restrictions is that, if many countries in the EMU were to run large deficits, there would be pressure on the ECB to finance some of this spending through additional money creation. In the aftermath of the crisis, many countries violated the fiscal restrictions, and how the monetary and fiscal authorities will ultimately respond to such pressure remains an open question.
One part of the response has been the establishment of additional facilities within Europe to pool resources to provide assistance to member states. Countries within Europe have been fulfilling a similar role to that played by the International Monetary Fund (IMF). In particular, the crisis in Greece, and related debt problems in Ireland and Portugal, led to the creation in May 2010 of the European Financial Stability Facility (http://www.efsf.europa.eu/about/index.htm) to provide for the stabilization of countries undergoing financial and debt problems. A June 2011 press release discusses the provision of funds for Ireland and Portugal under this stabilization fund (http://www.efsf.europa.eu/mediacentre/news/2011/2011-006-eu-and-efsf-funding-plans-to-provide-financial-assistance-for-portugal-and-ireland.htm). The funds for Greece are coming from the EU member states directly.
Within the ECB, the discussion by President Trichet (http://www.ecb.int/press/key/date/2009/html/sp090427.en.html) summarized the perspective and policy choices of the central bank, including the provision of liquidity. Given that the ECB maintains an inflation target, how is this provision of liquidity consistent with that goal? One answer often given is that without this liquidity, the European economies might have fallen into deeper recessions and thus opened up the possibility of deflationary periods, as witnessed in the Great Depression years in the United States and in Japan during the 1990s.
Costs and Benefits of a Common Currency
Sarkozy’s discussion of European economic government, and subsequent events in various countries, brought the debate over monetary integration back to the forefront in Europe. After the establishment of the European Monetary System, many European leaders thought the logical next step was a complete monetary union. This dream, embodied in the Maastricht Treaty, was finally realized in January 1999.A concise history of the steps to the Economic and Monetary Union is available at “Economic and Monetary Union (EMU),” European Central Bank, accessed July 20, 2011, http://www.ecb.int/ecb/history/emu/html/index.en.html. During the recent financial turmoil, however, the monetary ties that bind the European countries have been greatly strained. The costs of delegating monetary policy to a common central bank became very visible because individual countries were unable to respond to their own economic situations. In addition, the fiscal constraints included in the Maastricht Treaty hampered the ability of countries to conduct their desired fiscal policy. A recent report highlighted these concerns.See “Crisis Puts European Unity to the Test,” MoneyWeek, October 10, 2008, accessed July 26, 2011, http://www.moneyweek.com/news-and-charts/economics/crisis-puts-european-unity-to-the-test-13811.aspx.
Milton Friedman always said that the European Union would not survive a deep recession. Well, that theory is certainly being put to the test now. As the financial crisis radiated across the globe this week, the EU fell into disarray as an ugly bout of tit-for-tat policies helped fuel a rout of European banks.
It began with Ireland’s decision on 30 September to guarantee the deposits of its six main banks. This was a chance for European leaders to shore up banking confidence across Europe, says Leo McKinstry in the Daily Express. But instead of rallying behind the decision, German Chancellor Angela Merkel condemned it. Yet that didn’t stop Greece from pledging to guarantee its own banks.
The recent crisis has forced a reevaluation of the costs and benefits of the common currency.
Most of the advantages of a common currency are self-apparent. As explained in Chapter 9 "Money: A User’s Guide", money acts as a medium of exchange, facilitating transactions among households and firms. A common currency obviates the need to exchange currencies when buying goods, services, and assets. Secondly, the monetary union removes the uncertainty associated with fluctuations in the exchange rate: within a monetary union, there are, of course, no exchange rate fluctuations at all. Further, unlike in a fixed exchange rate system, there is no need to buy and sell currencies to support the agreed-on exchange rates. Finally, because money also acts as a unit of account, a common currency makes it easier to compare prices across countries. All of these factors encourage countries to benefit from more efficient flows of goods and capital across borders.
There is another gain from a common currency that is more subtle. In some cases, individual countries are unable to do a good job of managing their own monetary policy. In Chapter 11 "Inflations Big and Small", we explained that governments that run large deficits may decide to pay for these deficits by printing money. We also observed that there are situations where the monetary authority might be tempted to try unexpectedly expansionary policies when inflation is low. Such choices, while tempting, are ultimately damaging to an economy. Yet countries all too frequently indulge in such short-sighted policies. The underlying difficulty is a commitment problemThe situation when a government is not able to make credible promises to pursue actions regardless of how others respond to those actions.. Ahead of time, the monetary authority might like to keep inflation low, but there is pressure to print money; in the end, countries experience high inflation caused by excessive money growth.
In the case of the EMU, this was not an especially pressing concern. The ECB was conducting conservative monetary policy. At the same time, the governments in the euro area ran reasonably sensible fiscal policies for the most part, so there was no pressure on the ECB to finance excessive spending. After the 2008 financial crisis, however, the deficit and debt pictures changed for many countries—particularly Greece, Ireland, and Portugal. The debt situation has now put enormous pressure on European institutions, including the ECB. So far, the ECB has remained on the sidelines by not being a direct contributor to bailout packages.
Commitment problems have arisen often in the monetary affairs of other countries. Argentina adopted a currency boardA fixed exchange rate regime in which each unit of domestic currency is backed by holding the foreign currency, valued at the fixed exchange rate. in the 1990s because the monetary authorities could not commit to low-inflation policies in the late 1980s and early 1990s. To combat this problem, Argentina effectively adopted the US dollar as its currency. This monetary system meant that the Central Bank of Argentina was not able to increase the money supply independently: in effect, it delegated monetary policy to the United States. The monetary authority in Argentina was able to commit not to print pesos in response to fiscal pressures.
Some European countries, such as Denmark, elected not to make the euro its common currency. However, they adopted fixed exchange rates relative to the euro. Others, like the United Kingdom, did not make the euro its common currency and also elected to have floating exchange rates. Given all the advantages of a common currency, why did some countries reject the idea (and, for that matter, why is there not a single world currency)?
The answer is that there are also costs to adopting a common currency. As we have explained, the EMU entrusted monetary policy to a single central bank that decided monetary policy across a large number of countries. When these countries have different views about appropriate monetary policy, the delegation of monetary policy becomes problematic. Further, the fiscal restrictions imposed on the euro countries further reduced the ability of countries to respond to their own stabilization needs. In recent years, both Germany and France have violated the terms of the Stability and Growth Pact and the future of these fiscal restrictions remains in doubt.
Monetary Policy
Chapter 10 "Understanding the Fed" describes in detail the manner in which a central bank can use tools of monetary policy to influence aggregate economic activity and the price level. Monetary policy is a critical tool for stabilizing the macroeconomy. After the introduction of the euro, countries in the common currency area were no longer able to conduct independent monetary policy. The right to conduct monetary policy was ceded to the ECB.
Suppose that all the countries in the EMU were similar in their macroeconomic fortunes, meaning that the state of the macroeconomy in Italy was roughly the same as that in France, Ireland, Portugal, Belgium, and so forth. For example, suppose that when France experiences a period of recession, all the other countries in the union are in recession as well. In this case, the monetary policy that each country would have pursued if it had its own currency would most likely be very similar to the policy pursued by a central bank representing the interests of all the countries together. Each country, acting individually, would choose to cut interest rates to stimulate economic activity. The ECB would have an incentive to stimulate the economies of EMU member countries exactly as those members would have done with their own monetary policies. If countries are similar, in other words, the delegation of monetary policy to a central monetary authority is not that costly.
If countries are very different, it is more costly to move to a common currency. Suppose that Austria is undergoing a boom at the same time that Belgium is in recession. Belgium would like to cut interest rates. Austria would like to increase them. The ECB cannot satisfy both countries and may end up making them both unhappy. The crisis of 2008 did not have an even impact across all the countries in the euro area. Some countries saw major problems in their financial institutions, whereas others were less affected. As a result, different countries in the euro area had different desires in terms of the actions of the ECB.
Monetary policy operates through exchange rates as well as interest rates. By adopting a common currency, countries also give up the ability to stimulate their economies through depreciation or devaluation of their currency. Greece, Portugal, and Ireland have been forced to enact severe austerity measures to bring their debt under control. As a consequence, these countries have seen major recessions. If, say, Portugal was still using the escudo rather than the euro, it could have stimulated the economy by decreasing the value of the currency, thus encouraging net exports. It no longer has this option. It is possible for the real exchange rate to decrease even if the nominal rate is fixed, but this may require deflation in the domestic economy.
Fiscal Policy
The adoption of the single currency in Europe did not directly affect fiscal policy. In principle, it could have been adopted without any reference to fiscal policy. In practice, however, the single currency was accompanied by the fiscal limitations enshrined in the Stability and Growth Pact. In particular, the Stability and Growth Pact said that member countries were not allowed to run a government deficit that exceeded 3 percent of gross domestic product (GDP). The idea was that member countries were permitted to run deficits in periods of low economic activity but were encouraged to avoid large and sustained budget deficits.
As with the monetary agreement, there are costs and benefits to such fiscal restrictions. It is possible that a member country experiencing a period of low economic activity (a recession) would find itself unable to increase its government deficit, even if it wanted to stimulate economic activity. Chapter 14 "Balancing the Budget" explained that there are sometimes gains to running deficits. One cost of the Stability and Growth Pact is that it reduces the ability of countries to use deficits for macroeconomic stabilization.
Fiscal restrictions are common within monetary unions. Within the United States, there are restrictions, largely imposed on the states by themselves, which limit budget deficits at the state level. The idea is that large deficits at the level of a European country or a US state might create an incentive for the central bank to print money and thus bail out the delinquent government. This would occur if the monetary authority lacks the ability to say “no” to a state or a country in financial distress. By limiting deficits in the first place, such bailouts need not occur. This is a gain for all the countries within the EMU.
The Crisis in the United Kingdom
So far we have looked at two large economies: the United States and the euro area. We now turn to the experience of some smaller economies, beginning with the United Kingdom. The United Kingdom is part of the EU but it is not in the euro area. It retained its own currency (the pound sterling) rather than adopting the euro. This meant, of course, that it also retained its own central bank. The Bank of England is known as a very independent monetary authority, and operates under very strict rules of inflation targeting. Yet it, too, responded to the crisis.
The United Kingdom was one of the first countries to face serious implications of the financial crisis when, in September 2007, there was a run on a lending institution called Northern Rock. The Bank of England evidently could have—but chose not to—take action early in the crisis to avoid the run on Northern Rock. Once the run commenced, however, the Bank of England injected liquidity into the system.
In October 2008, the Bank of England was, along with other central banks, cutting interest rates. However, the cuts it enacted were modest relative to the action taken in the United States and other countries. More significantly, the United Kingdom partially nationalized some of its banks over this period under a 400-billion-pound bailout plan. Just as in the US plan, the aim was to provide liquidity directly to these banks and thus open up the market for loans among banks. But, according to contemporary reports, UK banks were still not making new commitments weeks after this bailout plan was enacted.
The Crisis in Iceland
Iceland is a relatively small, very open economy. It has close links to the EU but retains its own currency: the krona. It was particularly hard hit by the financial crisis, in part because Icelandic banks had been borrowing extensively from abroad in the years prior to the financial crisis. According to one estimate, banks held foreign assets and liabilities worth about 10 times Iceland’s entire GDP.This is partly based on a BBC article about Iceland: Jon Danielsson, “Why Raising Interest Rates Won’t Work,” BBC News, October 28, 2008, accessed July 26, 2011, http://news.bbc.co.uk/2/hi/business/7658908.stm.
The sheer size of asset holdings meant that if there was a substantial decrease in asset values, it was simply not possible for the Icelandic central bank or fiscal authorities to bail out domestic banks. Any attempt to bail out the banks would simply have bankrupted the government. You also might wonder why, as a last resort, Iceland could not generate print money to get itself out of trouble, financing a bailout through an inflation taxA tax occurring when the government prints money to finance its deficit.. We explained earlier that this would be a possibility in the United States, for example. The difference is that most of the liabilities of US financial institutions are denominated in US dollars, so inflation would reduce the real value of these liabilities. But much of the debt of Icelandic banks was not denominated in krona; it was denominated in euros, US dollars, or other currencies. Inflation in Iceland would simply lead to a depreciation of the currency and would not reduce the real value of the debt.
Based on estimates from the IMF, the financial and exchange rate problems of Iceland led to a contraction in real GDP of around 3 percent in 2009. In late October 2008, Iceland negotiated a $2.1 billion dollar loan from the IMF (http://www.imf.org/external/np/sec/pr/2008/pr08256.htm) for emergency funding to help stabilize its economy. To put this in perspective, Iceland’s GDP is only $12 billion, and the loan was equivalent to almost $7,000 per person. Meanwhile, there was a precipitous decline in the value of the krona: between January and October 2008, the krona lost nearly half of its value.
Iceland’s banking system was effectively nationalized in 2008. The government took over three of the biggest banks. During late October, the government tried to peg the krona at about 131 per euro. Their attempt failed, and the government was forced to allow the krona to decrease in response to market forces. There was a report of a trade at 340 krona per euro, far from the government’s attempted peg.See Bo Nielsen, “Iceland’s Krona Currency Trading Halts as Kaupthing Taken Over,” October 9, 2008, accessed July 26, 2011, http://www.bloomberg.com/apps/news?pid=20601085&refer=europe&sid=aiz5QIq94nrw. One way to think about the decline in the value of the krona is through the government budget constraint. Once the government took over the banks, what had been a private liability became a government liability to depositors. One way to meet this obligation is through higher taxes; another is through the creation of more currency. The rapid depreciation of the krona indicates that market participants were anticipating more inflation in Iceland, so the value of the currency decreased.
Iceland was merely the first country that ran into considerable distress as a result of the crisis of 2008. It was followed a few days later by Ukraine, which agreed to a $16.5 billion loan from the IMF. Countries such as Greece and Spain also faced problems as investors started to worry that their governments might default on their debt.
The Crisis in China
The financial crisis had an impact on China largely through trade linkages. China exports a lot of goods to western economies. As the level of economic activity in these economies slowed, the demand for goods and services produced in China decreased as well. This led to lower real GDP in China. As shown in the circular flow of income (Figure 15.2 "The Foreign Sector in the Circular Flow"), the reduction in exports by China led to reduced output from Chinese firms, reduced income for Chinese households, and lower spending through the multiplier process.
Even though China owned many US assets, most were not directly linked to mortgage-backed securities. Instead, the Chinese were holding about $900 billion of US Treasury securities.Data on foreign holdings of US government securities is available at “Major Foreign Holders of Treasury Securities, ” US Department of the Treasury, September 16, 2011, accessed September 20, 2011, http://www.ustreas.gov/tic/mfh.txt. Although the value of these securities changed with the financial situation, this simply led to changes in the value of portfolios and did not lead to bankruptcy of financial institutions.
China differs from the United States and Europe because many of the banks operating in China are owned by the government. The top four state-owned banks had about 66 percent of China’s deposit market in 2007. So if the assets of those banks decrease in value, this loss is ultimately reflected in the budget of the government. Whereas the governments of England, the United States, and other countries attacked the crisis of 2008 by partial nationalization—that is, the purchase of bank shares by the government—this was unnecessary in China because the government already had a substantial ownership share in the banks.
Deposit insurance is also rather different in China. In the case of publicly owned banks, the government directly guarantees deposits so banks will not go bankrupt. There is no explicit deposit insurance for private banks, but the lack of explicit deposit insurance does not mean the Chinese government would not bail out a bank that was under attack. The Law of the People’s Republic of China on Commercial Banks Article 64 reads as follows:
When a commercial bank has suffered or will possibly suffer, credit crisis, thereby seriously affecting the interests of the depositors, the banking regulatory authority under the State Council may assume control over the bank.
The purposes of assumption of control are, through taking such measures as are necessary in respect of the commercial bank over which control is assumed, to protect the interests of the depositors and to enable the commercial bank to resume normal business. The debtor-creditor relationship with regard to a commercial bank over which control is assumed shall not change as a result of the assumption of control.“Article 64,” Law of the People’s Republic of China on Commercial Banks, May 10, 1995, accessed July 26, 2011, http://www.china.org.cn/english/DAT/214824.htm.
The Crisis in Argentina
What about the experience in Latin America during the crisis of 2008? Many countries, notably Argentina, Brazil, and Mexico, experienced their own financial and currency crises in recent decades. Those crises were “homegrown” because they were largely caused by domestic economic policies.
But the upheavals of recent years were not created in these countries. The linkages we explained earlier also caused these countries to be affected by the financial events that afflicted the United States and Europe. Figure 15.3 "Stock Markets around the World Crashed Together" shows that the stock market in Argentina had similar volatility and losses to those experienced in other countries. This volatility, along with other financial upheavals, created an interesting response within Argentina: the government announced the nationalization of private pension plans.
What is the connection here? The government announced it was taking over private pensions to protect households who faced added financial risks. Instead of facing the risks of private asset markets, households were now shielded from that risk through a national pension system. Skeptics have argued that this was simply an opportunity for the government of Argentina to obtain some additional resources. Promises of future compensation for the lost pensions were not viewed as credible.
The Crisis in Australia
Finally, not every country in the world was badly hit by the crisis of 2008. Australia, for example, saw a significant stock market decrease but otherwise went through the crisis years with little more than a minor slowdown in economic growth. There are several reasons for this. Australia, like other countries, used both monetary and fiscal policy to stimulate the economy. On the fiscal side, it cut taxes and increased government purchases; on the monetary side, the Reserve Bank of Australia decreased interest rates (although not by as much as many other countries). Australia has historically kept its government debt very close to zero, so there were no concerns about default on Australian debt.
Australia made a very well-publicized cash transfer of about $1,000 to about half the population. Even though much of those transfers were probably saved rather than spent, they are credited with helping to support confidence and limit contagion effects in Australia. Finally, Australia has benefitted from a major resources boom, so demand for net exports was a robust component of aggregate expenditures during the crisis period.
Key Takeaways
- The United States and the rest of the world are linked through many channels. Key channels that allowed the crisis to spread were financial links due to both holdings of assets across borders and the spread of pessimism across markets. In addition, links across countries due to trade flows meant that as income decreased in some countries, exports and thus real GDP decreased in others.
- Within the EMU, individual countries were limited in fiscal policy responses due to restrictions on outstanding debt. Further, the ECB follows an inflation target rule and thus is not able to directly intervene to stabilize European economies. In the end, countries did take fiscal actions, and the ECB ultimately provided the needed liquidity to Europe. But this experience highlighted some of the costs of a monetary union.
Checking Your Understanding
- During the crisis of 2008, what happened to stock markets across the world?
- To avoid spillovers from a financial crisis, what would a country have to do?
- Why do other countries hold US government debt?
15.4 Currency Crises
Learning Objectives
After you have read this section, you should be able to answer the following questions:
- What are the causes of a currency crisis?
- How are currency crises and financial crises related?
In some countries, the financial crisis of 2008 led to a currency crisisA sudden and unexpected rapid decrease in the value of a currency.. A currency crisis is a sudden and unexpected rapid decrease in the value of a currency. Currency crises are particularly severe in the case of a fixed exchange rateA regime in which a central bank uses its tools to target the value of the domestic currency in terms of a foreign currency. because such crises typically force a monetary authority to abandon the fixed rate. In the case of flexible exchange ratesA system in which market forces determine exchange rates., a currency crisis occurs when the value of the currency decreases substantially in a short period of time. Such rapid depreciation is not as disruptive as the collapse of a fixed exchange rate, but it can still cause significant turmoil in an economy.
Exchange Rates in the Current Crisis
If you look at exchange rate data for September and October 2008, you can see that the dollar appreciated relative to the euro at that time. In other words, the dollar price of a euro decreased. Over the 10 days ending October 24, 2008, the dollar price of a euro decreased from about $1.35 to $1.25. More generally, several currencies experienced rapid depreciations during the financial crisis. Though there were no runs on these currencies, they nonetheless lost considerable value.
The dollar value of the British pound decreased to $1.62, its lowest level in 5 years, after the October 21, 2008, announcement that the UK economy was on the brink of a recession. There was a drop in value of about 7 percent over the previous week alone. The pound also decreased against the euro.
Currency Crises under Flexible Exchange Rates
A currency crisis can arise from a change in expectations, in ways that are similar to some of our earlier examples. Remember, for instance, how the current value of a house decreases when people expect that its future value will decrease. If you think that the value of Argentine pesos will decline (so each peso will be worth less in dollars), you may respond by selling pesos that you currently own. If everyone in the market shares your beliefs, then everyone will sell, and the value of the peso will decrease now.
Currency Crises under Fixed Exchange Rates
If everyone believes that a monetary authority can and will maintain the exchange rate, then people are happy to hold onto a currency. But if people believe that the fixed exchange rate is not sustainable, then there will be a run on the currency. Consider, for example, Brazil trying to stabilize its currency—the real. The monetary authority sets a fixed exchange rate, meaning that it stands ready to exchange Brazilian real for US dollars at a set price. If a fixed exchange rate is set too high, then the Brazilian central bank can maintain this value for a while by buying real with its own stocks of dollars.
But the central bank does not possess unlimited reserves of dollars. If the low demand for the real persists, then eventually the central bank will run out of reserves and thus no longer be able to support the currency. When that happens, the value of the real will have to decrease. A decrease in a fixed exchange rate is called devaluationA decrease in the value of a currency in a fixed exchange rate..
In fact, the decrease in the value of the real would occur well before the central bank runs out of reserves. If you believe that the monetary authority will be forced to abandon the fixed rate, you will take your real and exchange them for dollars—and you will want to do this sooner rather than later to ensure you make the exchange before the real decreases in value. When lots of investors do this, the supply curve for real shifts outward. This makes the problem of maintaining the fixed exchange rate even more difficult for the central bank, so the devaluation of the currency will happen even sooner. If everyone does this, then the monetary authority will not have enough dollars on hand and will have to give up the fixed rate. The risk of such currency crises is the biggest potential problem with fixed exchange rates. History has given us many examples of such crises, and shows that they are very disruptive for the economy—and sometimes even for the world as a whole.
You may have noticed that a currency crisis looks a lot like a bank run. In both cases, pessimistic expectations of investors (about the future of a bank in one case and the future value of a currency in the other) lead them to all behave in a way that makes the pessimism self-fulfilling. In the case of a bank run, if all depositors are worried about their deposits and take their money out of the bank, then the bank fails and the depositors’ pessimism was warranted. Likewise, if investors believe the devaluation of a currency is likely, they will all want to sell their currency. This drives down the price and makes the devaluation much more likely to occur. A currency crisis, like a bank run, is an example of a coordination game.
Key Takeaways
- A currency crisis can occur for several reasons, including being a consequence of a financial crisis or a fiscal crisis, or, in some cases, just driven by expectations like a bank run.
- A financial crisis can lead to a currency crisis if depositors in one country, seeing the collapse of a financial system, rush to convert a home currency into foreign currencies.
Checking Your Understanding
- What is the difference between a fixed exchange rate system and a flexible exchange rate system?
- What is the difference between a currency crisis and a devaluation?
15.5 End-of-Chapter Material
In Conclusion
Five or six years ago, economists studied a period that they named “the Great Moderation.” In the period after World War II, and even more specifically from the mid 1980s to the mid 2000s, economic performance in the United States, Europe, and many countries had been relatively placid. These countries enjoyed respectable levels of long-run growth, experienced only mild recessions, and enjoyed low and stable inflation. Many observers felt that this performance was in large measure due to the fact that economists and policymakers had learned how to conduct effective monetary and fiscal policies. We learned from the mistakes of the Great Depression and knew how to prevent serious economic downturns. We also learned from the mistakes made in the 1970s and knew how to avoid inflationary policies.
To be sure, other countries still experienced their share of economic problems. Many countries in Latin America experienced currency crises and debt crises in the 1980s. Many countries in Southeast Asia suffered through painful exchange rate crises in the 1990s. Japan suffered a protracted period of low growth. Some countries saw hyperinflation, while others experienced economic decline. Still, for the most part, mature and developed economies experienced very good economic performance. Macroeconomics was becoming less about diagnosing failure and more about explaining success.
The last few years shook that worldview. The crisis of 2008 showed that a major economic catastrophe was not as unthinkable as economists and others hoped. The world experienced the most severe economic downturn since the Great Depression, and there was a period where it seemed possible that the crisis could even be on the same scale as the Great Depression. Countries like the United States and the United Kingdom faced protracted recessions. Countries such as Greece, Portugal, Ireland, and Iceland found themselves mired in debt crises. Spillovers and interconnections—real, financial, and psychological—meant that events like the bankruptcy of Lehman Brothers reverberated throughout the economies of the world.
Because it resurrected old problems, the crisis of 2008 also resurrected old areas of study in macroeconomics. The events in Europe have prompted economists to review the debate over common currencies and the conduct of monetary policy. There has been increased investigation of the size of fiscal policy multipliers. At the same time, macroeconomists are devoting much attention to topics such as the connection between financial markets and the real economy. But this difficult period for the world economy has also been an exciting time for macroeconomists. The study of macroeconomics has become more vital than ever—more alive and more essential.
Key Links
- International Monetary Fund forum on common currency: http://www.imf.org/external/np/exr/ecforums/110800.htm
- Economic and Monetary Union: http://ec.europa.eu/economy_finance/euro/emu/index_en.htm.
- European Central Bank: http://www.ecb.int/home/html/index.en.html
- CBO analysis of Obama package: http://www.cbo.gov/ftpdocs/106xx/doc10682/Frontmatter.2.2.shtml
Exercises
- Consider the bank run game. If a government is supposed to provide deposit insurance but depositors doubt the word of the government, might there still be a bank run?
- Comparing the Great Depression to the financial crisis starting in 2008, what were the differences in the response of fiscal and monetary policy between these two episodes?
- We explained in Section 15.1 "The Financial Crisis in the United States" that an increase in the expected future price of houses leads to an increase in the current price. Draw a supply-and-demand diagram to illustrate this idea.
- Consider the crisis from the perspective of China. United States imports from China are roughly $300 billion each year. Due to the recession in the United States, imports from China decreased about 10 percent. If the marginal propensity to spend is 0.5 in China, what is the change in Chinese output predicted by the aggregate expenditure model? How much must government spending increase to offset this reduction in exports?
- In the CBO assessment of ARRA, the multiplier from government purchases was assumed to be larger than the multiplier from tax cuts. How would you explain the differences in these multipliers?
- If countries within the EMU are supposed to limit their deficits, what must happen to government spending during a recession when tax revenues decrease?
- (Advanced) We argued that the provision of deposit insurance prevents bank runs. Is there an analogous policy to prevent currency crises?
Economics Detective
- What has been the ECB’s role in the European Financial Stability Facility and in the bailout packages for Greece, Ireland, and Portugal?
- Find the details of the recent rescue package for Greece. What were the different views of Germany and France about this bailout? How was the IMF involved?
- What predictions were made about job creation under the Obama administration’s stimulus package? What happened to job creation rates in the 2008–10 period?