This is “Macroeconomics in Action”, chapter 3 from the book Theory and Applications of Economics (v. 1.0). For details on it (including licensing), click here.
For more information on the source of this book, or why it is available for free, please see the project's home page. You can browse or download additional books there. To download a .zip file containing this book to use offline, simply click here.


Chapter 3 Macroeconomics in Action
Four Examples of Macroeconomics
Learning Objectives
After you have read this section, you should be able to answer the following questions:
- How might you encounter macroeconomics?
- What are the main indicators of the macroeconomy?
- What are the primary macroeconomic policy tools of the government?
Figure 3.1
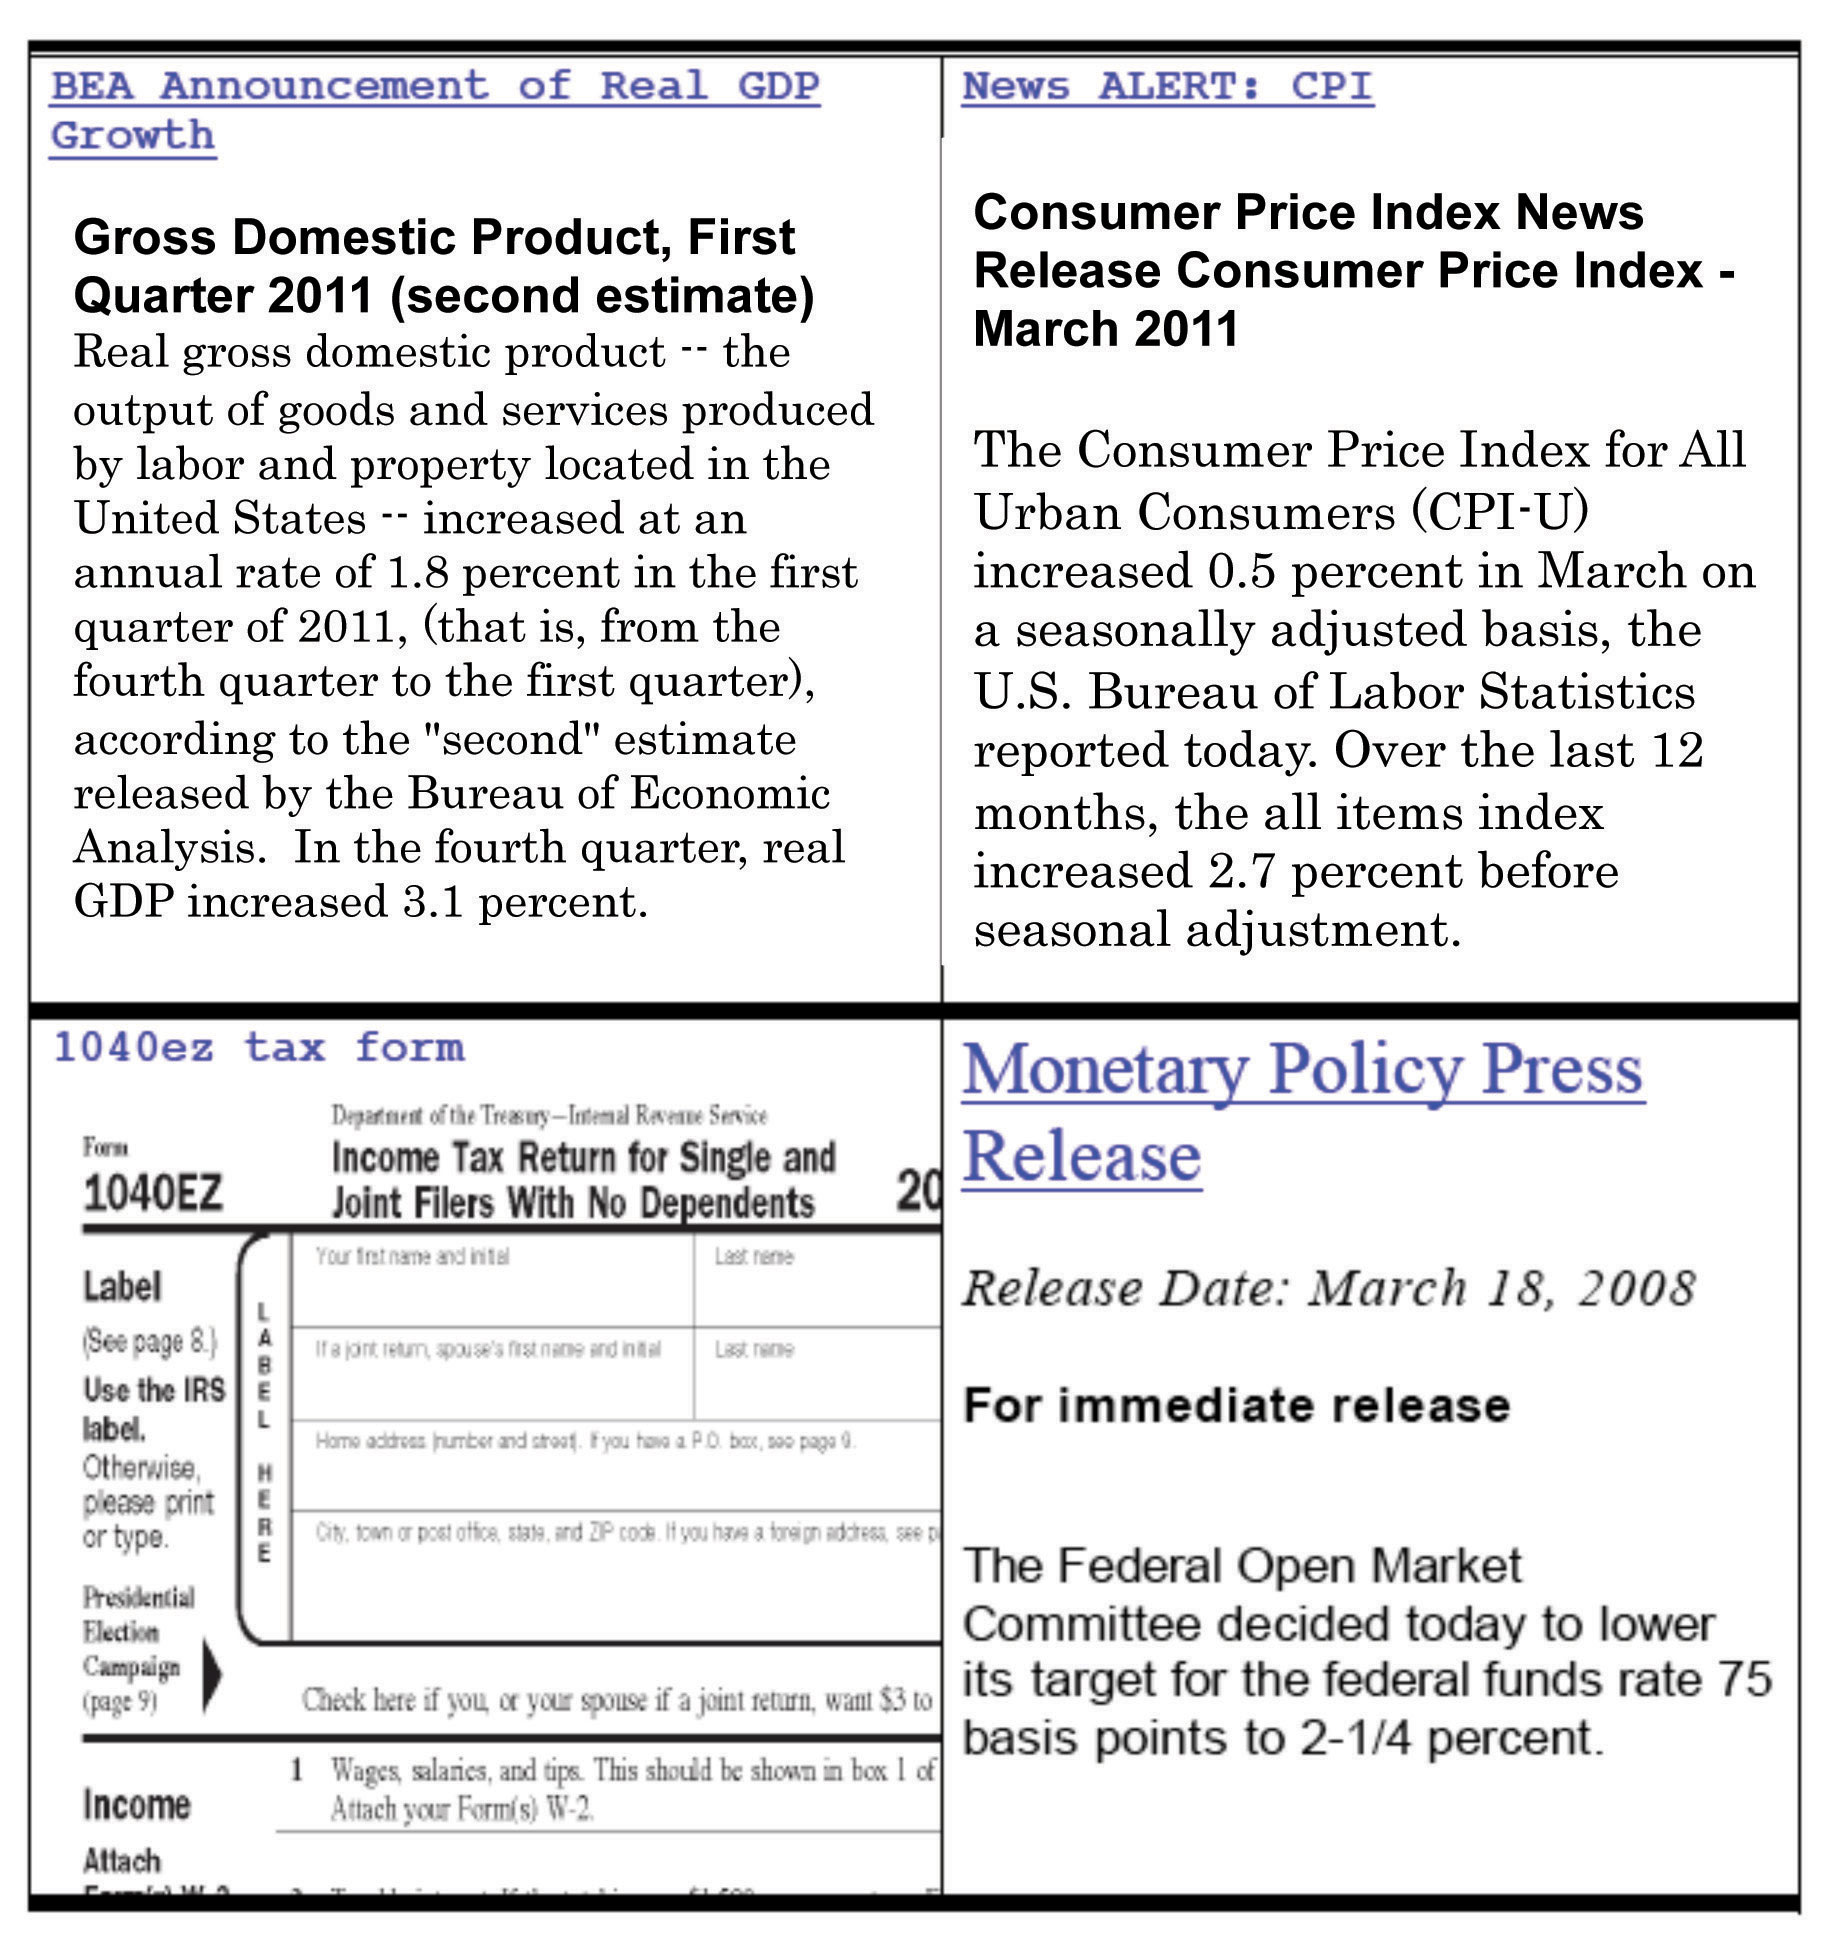
The four screens in Figure 3.1 are diverse illustrations of macroeconomics as you might encounter it:
- An evening news show presents a story about whether the economy is in a recession.
- You wonder why prices seem to be higher now than they were a few years ago.
- You sit down to fill out your tax return.
- You make payments on a car loan or a student loan.
By the time you have finished this book, you will see these examples very differently from the way you do right now. You may not know it, but your everyday life is filled with macroeconomics in action.
Economic Activity in the United States
The top left screen in Figure 3.1 is tuned to the Bureau of Economic Analysis (BEA; http://www.bea.gov), which is a part of the US government. A newspaper article or blog that reports such news from the BEA is telling us about the state of the macroeconomy. The report from the BEA tells you how the economy has been doing over the previous three months. More specifically, it describes what has happened to something called real gross domestic product (real GDP)A measure of production that has been corrected for any changes in overall prices..
As you will soon learn, real GDP is a measure of the overall level of economic activity within an economy. We won’t worry for the moment about exactly what GDP means or how it is measured. Looking at the BEA announcement (http://www.bea.gov/newsreleases/national/gdp/2011/gdp1q11_2nd.htm), you can see that in the first quarter of 2011, real GDP increased by 1.8 percent, whereas in the fourth quarter of 2010, it increased by 3.1 percent. Because real GDP increased in both quarters, we know that the economy is growing. However, it grew much more slowly in the first quarter of 2011 than in the final quarter of 2010.
You might wonder why you would bother to listen to this report. Perhaps it looks rather dry and boring. Yet the performance of the economy has a direct impact on how easy it is to find a job if you are looking for one, how likely you are to lose your job if you are already employed, how much you will earn, and what you can buy with the income you receive from working. Overall economic activity is directly linked to the well-being of everyone in the economy, including yourself. Should you be worried when you see that real GDP is growing much more slowly than before? After you have read this book, we hope you will know the answer.
Because real GDP is such a general measure of economic activity, it can also be used to compare how economies throughout the world are performing. If you have traveled to other countries, you may have observed big differences in people’s standards of living. If you go to Canada, France, or Japan, you will generally see relatively prosperous people who can afford decent food, clothing, and shelter. If you go to Laos, Guatemala, or Malawi, you will see people living in severe poverty. To understand these differences, we need to understand what determines real GDP in an economy.
Inflation in the United States
The top right screen in Figure 3.1 reports on another economic variable that comes up all the time in the news: the rate of inflationThe growth rate of the price index from one year to the next.. You have probably never visited the Bureau of Labor Statistics (BLS; http://www.bls.gov) website from which we took this quotation. But you have certainly heard a news story, perhaps on television or your car radio, telling you about the inflation rate.
After the BLS releases a report such as this one (http://www.bls.gov/news.release/cpi.nr0.htm), news programs will note that the inflation rate reported in March 2011 was 2.7 percent. This means that, on average, prices in the economy are 2.7 percent greater than they were a year ago. If you bought a jacket for $100 last year, you should expect the same jacket to cost about $102.70 right now. Not every single good and service increases by exactly this amount, of course. But, on average, prices are now 2.7 percent higher.
A news report like this tells us that the things we buy have become more expensive. This matters to all of us. If your income has not increased over the last year, this inflation report tells you that you are worse off now than you were last year because you can no longer buy as much with your income.
Most of the time, you will hear news reports about inflation only for the country in which you are living. Occasionally, you might also hear a news report about inflation somewhere else. In early 2008, you might well have heard a news report that the inflation rate in Zimbabwe was over 100,000 percent. You would probably find it difficult to imagine living in a country where prices increase so quickly, and you might reasonably wonder how two different countries in the world could have such different rates of inflation. When you have finished this book, you will know the answer to this question.
Fiscal Policy in Action
The bottom left screen in Figure 3.1 is something you may have seen before. It is a US tax form. Residents of the United States must file this form or one like it every year by April 15. If you live in another country, you almost certainly have to file a similar form. As individuals, we typically see this form as a personal inconvenience, and we don’t think much about what it means for the economy as a whole. But this is much more than a form. It is a manifestation of decisions made by the government about how much tax you and everyone else should pay.
Decisions about how much to tax and how much to spend are known as fiscal policyChanges in taxation and the level of government purchases, typically under the control of a country’s lawmakers.. The fiscal policy adopted by a government affects your life in more ways than you can easily imagine. It not only tells you how much gets taken out of your paycheck, but it also affects real GDP and much more. It affects how likely you are to be unemployed in the future and how much money you will receive from the government if you do lose your job. It affects the interest rate you must pay on your car loan or student loan. It affects the tax rates you will pay 20 years from now and your likelihood of receiving social security payments when you retire.
Monetary Policy in Action
The bottom right screen in Figure 3.1 draws the attention of individuals and businesses all around the world. Every six weeks a group called the Federal Open Market Committee (FOMC) meets in Washington, DC, to make decisions on the course of US monetary policyChanges in interest rates and other tools that are under the control of the monetary authority of a country (the central bank).. Their decisions affect the interest rates we pay on loans, including car loans, student loans, and mortgages. Their decisions also influence the level of economic activity and the inflation rate. The FOMC could, if it chose, create very high inflation by allowing rapid growth in the amount of money in the economy. It could, if it chose, create high rates of unemployment. It is a powerful organization. There are other similar organizations elsewhere in the world: every country conducts monetary policy in some form, and most have some equivalent of the FOMC.
International Channels
Figure 3.1 shows the kind of economic news you might see in the United States. If you are living or traveling in a different country, you would see similar announcements about real GDP, inflation, and economic policy. Using the Internet, it is also easy to check news sources in other countries. If you start reading about economics on the Internet, you will come to appreciate the global nature of economics. You can read stories in the United States about monetary policy in China or fiscal policy in Portugal. And you can read news stories in other countries about economic policy in the United States. In the modern globalized world, economic connections across countries are impossible to ignore.
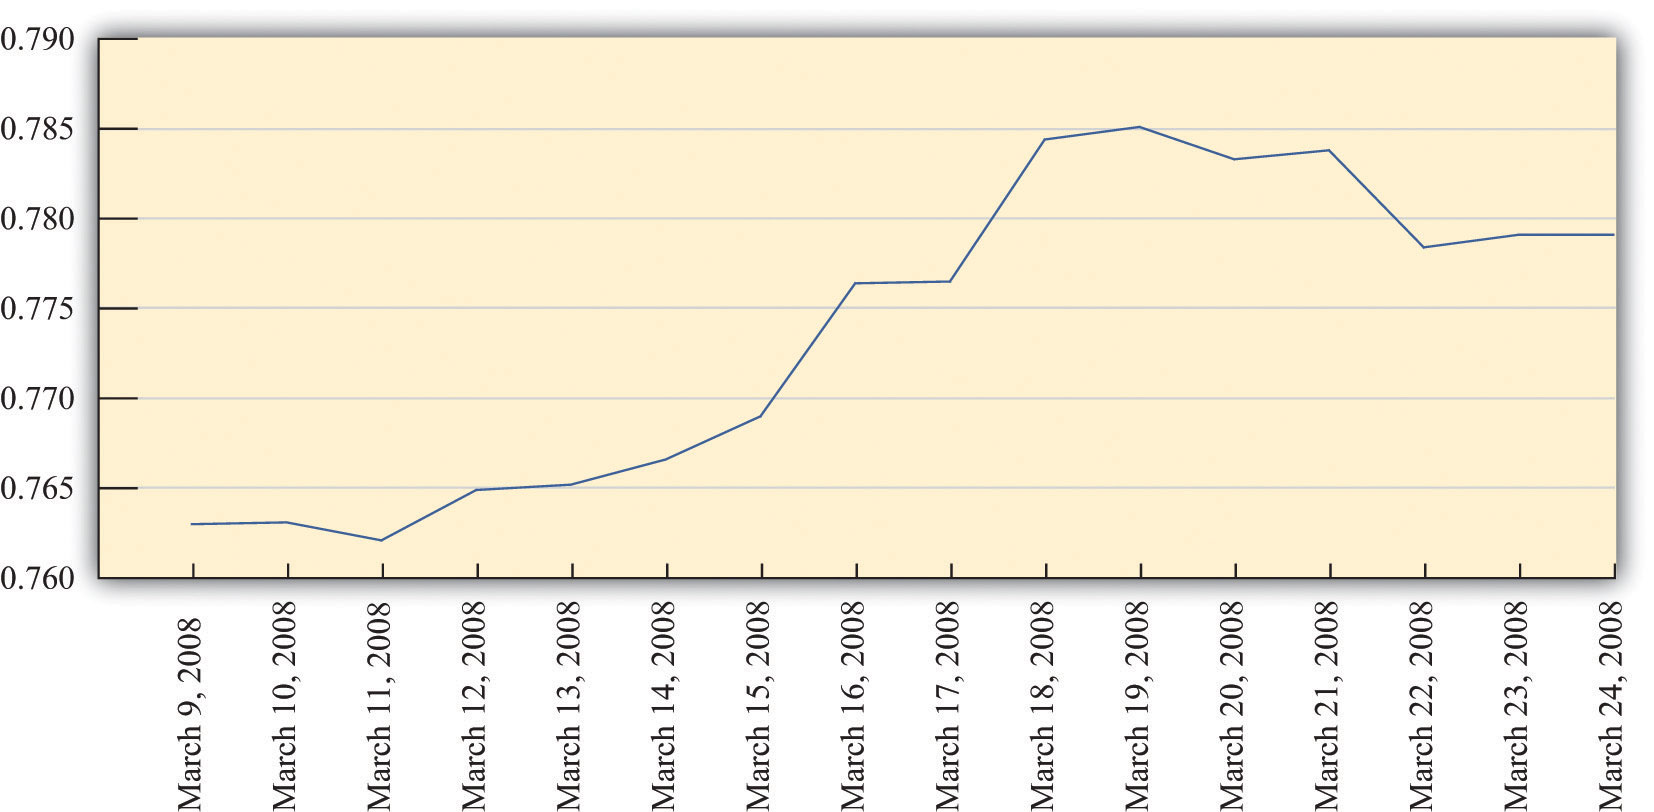
Figure 3.2 "Price of Euro in British Pounds, March 2008" presents two stories that show globalization at work. Both share a common theme: the effects of a March 20, 2008, decision by the FOMC to cut the target federal funds rate. The graph at the top of Figure 3.2 "Price of Euro in British Pounds, March 2008" shows the market price of the euro—the currency used in most of Europe—in terms of the British pound. When you travel, you typically exchange one currency for another. For example, an American tourist traveling to France would buy euros with dollars to have money to spend in France. If that same tourist then wanted to travel from France to London, she might take some of her euros and buy British pounds. The graph tells the price she would have paid in February and March of 2008.
You can see that, over a little more than a week, the euro became much more valuable relative to the pound. Most notably, there was a big increase in the price of the euro between March 9 and March 19, and then prices settled down a bit. This was a wild week for the international economy. In the United States, the Federal Reserve announced major financial support for Wall Street firms on March 16 and then reduced interest rates on March 19. Around the same time, the European Central Bank (ECB) and the Bank of England in London were also taking actions to try to calm the financial markets. At least for a period of time, they seemed to succeed in stopping the rapid rise of the euro against the British pound. It is striking that much of the financial action was taking place in the United States, yet the markets in which Europeans trade currencies were also affected.
The story at the bottom of Figure 3.2 "Price of Euro in British Pounds, March 2008" discusses the response of Asian stock markets to the action of the US Federal Reserve. Markets all over the world increased in value after the action of the FOMC. The actions of the Fed matter well beyond the borders of the United States. Bankers and businesspeople all over the globe are “Fed watchers.”
Asian Stocks Rise after Fed Cut
TOKYO (AP)—Asian stock markets rose Wednesday as investors welcomed a hefty U.S. interest rate cut…
Japan’s benchmark Nikkei 225 index climbed 2.5 percent to close at 12,260.44 after rising more than 3 percent earlier. Hong Kong’s Hang Seng index, which rose as much as 3 percent earlier, closed up 2.3 percent at 21,866.94.
Australia’s main index jumped 4 percent, and markets in South Korea, China and India also rose.“Asian Stocks Rise after Fed Cut,” MSNBC.com, March 19, 2008, accessed June 27, 2011, http://www.msnbc.msn.com/id/23703748/ns/business- eye_on_the_economy.
Key Takeaways
- You encounter macroeconomics everyday through the news about the state of the macroeconomy, the price you pay for goods and services, the tax you pay on income, and the effects of macroeconomic policy on interest rates. Macroeconomic events and policies in other countries affect you as well.
- Real GDP, the rate of inflation, and the rate of unemployment are three primary indicators of the state of the macroeconomy.
- The government influences the macroeconomy through its level of spending, taxes, and control of the money supply.
Checking Your Understanding
- What do we mean by “real” when we talk about GDP?
- How might the state of the macroeconomy in another country, such as China, or in a group of countries, such as the European Union, affect the macroeconomy of the United States?