This is “Unobtrusive Data Collected by You”, section 11.3 from the book Sociological Inquiry Principles: Qualitative and Quantitative Methods (v. 1.0). For details on it (including licensing), click here.
For more information on the source of this book, or why it is available for free, please see the project's home page. You can browse or download additional books there. To download a .zip file containing this book to use offline, simply click here.


11.3 Unobtrusive Data Collected by You
Learning Objectives
- Define content analysis.
- Describe the kinds of texts that content analysts analyze.
- Name at least two examples of content analysis research.
- Define primary and secondary sources, describe their differences, and provide an example of each.
- Define physical traces and compare them to material artifacts.
- Outline the differences between manifest content and latent content.
- Discuss the differences between qualitative and quantitative content analysis.
- Describe code sheets and their purpose.
This section focuses on how to gather data unobtrusively and what to do with those data once they have been collected. There are two main ways of gathering data unobtrusively: conducting a content analysis of existing texts and analyzing physical traces of human behavior. We’ll explore both approaches.
Content Analysis
One way of conducting unobtrusive research is to analyze texts. Texts come in all kinds of formats. At its core, content analysis addresses the questions of “Who says what, to whom, why, how, and with what effect?” (Babbie, 2010, pp. 328–329).Babbie, E. (2010). The practice of social research (12th ed.). Belmont, CA: Wadsworth. Content analysisA type of unobtrusive research that involves the study of human communications. is a type of unobtrusive research that involves the study of human communications. Another way to think of content analysis is as a way of studying texts and their meaning. Here we use a more liberal definition of text than you might find in your dictionary. The text that content analysts investigate includes such things as actual written copy (e.g., newspapers or letters) and content that we might see or hear (e.g., speeches or other performances). Content analysts might also investigate more visual representations of human communication such as television shows, advertisements, or movies. The following table provides a few specific examples of the kinds of data that content analysts have examined in prior studies. Which of these sources of data might be of interest to you?
Table 11.1 Content Analysis Examples
| Data | Research question | Author(s) (year) |
|---|---|---|
| Spam e-mails | What is the form, content, and quantity of unsolicited e-mails? | Berzins (2009)Berzins, M. (2009). Spams, scams, and shams: Content analysis of unsolicited email. International Journal of Technology, Knowledge, and Society, 5, 143–154. |
| James Bond films | How are female characters portrayed in James Bond films, and what broader lessons can be drawn from these portrayals? | Neuendorf, Gore, Dalessandro, Janstova, and Snyder-Suhy (2010)Neuendorf, K. A., Gore, T. D., Dalessandro, A., Janstova, P., & Snyder-Suhy, S. (2010). Shaken and stirred: A content analysis of women’s portrayals in James Bond films. Sex Roles, 62, 747–761. |
| Console video games | How is male and female sexuality portrayed in the best-selling console video games? | Downs and Smith (2010)Downs, E., & Smith, S. L. (2010). Keeping abreast of hypersexuality: A video game character content analysis. Sex Roles, 62, 721–733. |
| Newspaper articles | How do newspapers cover closed-circuit television surveillance in Canada, and what are the implications of coverage for public opinion and policymaking? | Greenberg and Hier (2009)Greenberg, J., & Hier, S. (2009). CCTV surveillance and the poverty of media discourse: A content analysis of Canadian newspaper coverage. Canadian Journal of Communication, 34, 461–486. |
| Pro-eating disorder websites | What are the features of pro-eating disorder websites, and what are the messages to which users may be exposed? | Borzekowski, Schenk, Wilson, and Peebles (2010)Borzekowski, D. L. G., Schenk, S., Wilson, J. L., & Peebles, R. (2010). e-Ana and e-Mia: A content analysis of pro-eating disorder Web sites. American Journal of Public Health, 100, 1526–1534. |
One thing you might notice about Table 11.1 "Content Analysis Examples" is that the data sources represent primary sourcesOriginal sources of data that have not already been analyzed; “raw” sources.. That is, they are original. Secondary sourcesSources of data that have been analyzed or otherwise tweaked for presentation by others; “cooked” sources., on the other hand, are those that have already been analyzed. Shulamit Reinharz offers a helpful way of distinguishing between these two types of sources in her methods text. She explains that while primary sources represent the “‘raw’ materials of history,” secondary sources are the “‘cooked’ analyses of those materials” (1992, p. 155).Reinharz, S. (1992). Feminist methods in social research. New York, NY: Oxford University Press. The distinction between primary and secondary sources is important for many aspects of social science, but it is especially important to understand when conducting content analysis. While there are certainly instances of content analysis in which secondary sources are analyzed, I think it is safe to say that it is more common for content analysts to analyze primary sources.
Figure 11.3

You might say that flour represents a primary source in that it is a “raw” material. Manipulating, or analyzing, that material results in a secondary, or “cooked” source, as represented by the cake.
© Thinkstock
In those instances where secondary sources are analyzed, the researcher’s focus is usually on the process by which the original analyst or presenter of data reached his conclusions or on the choices that were made in terms of how and in what ways to present the data. For example, Ferree and Hall (1990)Ferree, M. M., & Hall, E. J. (1990). Visual images of American society: Gender and race in introductory sociology textbooks. Gender & Society, 4(4), 500–533. conducted a content analysis of introductory sociology textbooks, but their aim was not to learn about the content of sociology as a discipline. Instead, the researchers sought to learn how students are taught the subject of sociology and understand what images are presented to students as representative of sociology as a discipline.
Sometimes students new to research methods struggle to grasp the difference between a content analysis of secondary sources and a review of literature, which is discussed in Chapter 5 "Research Design". In a review of literature, researchers analyze secondary materials to try to understand what we know, and what we don’t know, about a particular topic. The sources used to conduct a scholarly review of the literature are typically peer-reviewed sources, written by trained scholars, published in some academic journal or press, and based on empirical research that has been conducted using accepted techniques of data collection for the discipline (scholarly theoretical pieces are included in literature reviews as well). These sources are culled in a review of literature in order to arrive at some conclusion about our overall knowledge about a topic. Findings are generally taken at face value.
Conversely, a content analysis of scholarly literature would raise questions not raised in a literature review. A content analyst might examine scholarly articles to learn something about the authors (e.g., Who publishes what, where?), publication outlets (e.g., How well do different journals represent the diversity of the discipline?), or topics (e.g., How has the popularity of topics shifted over time?). A content analysis of scholarly articles would be a “study of the studies” as opposed to a “review of studies.” Perhaps, for example, a researcher wishes to know whether more men than women authors are published in the top-ranking journals in the discipline. The researcher could conduct a content analysis of different journals and count authors by gender (though this may be a tricky prospect if relying only on names to indicate gender). Or perhaps a researcher would like to learn whether or how various topics of investigation go in and out of style. She could investigate changes over time in topical coverage in various journals. In these latter two instances, the researcher is not aiming to summarize the content of the articles but instead is looking to learn something about how, why, or by whom particular articles came to be published.
Content analysis can be qualitative or quantitative, and often researchers will use both strategies to strengthen their investigations. In qualitative content analysis the aim is to identify themes in the text being analyzed and to identify the underlying meaning of those themes. A graduate student colleague of mine once conducted qualitative content analysis in her study of national identity in the United States. To understand how the boundaries of citizenship were constructed in the United States, Alyssa Goolsby (2007)Goolsby, A. (2007). U.S. immigration policy in the regulatory era: Meaning and morality in state discourses of citizenship (Unpublished master’s thesis). Department of Sociology, University of Minnesota, Minneapolis, MN. conducted a qualitative content analysis of key historical congressional debates focused on immigration law. Quantitative content analysis, on the other hand, involves assigning numerical values to raw data so that it can be analyzed using various statistical procedures. One of my research collaborators, Jason Houle, conducted a quantitative content analysis of song lyrics. Inspired by an article on the connections between fame, chronic self-consciousness (as measured by frequent use of first-person pronouns), and self-destructive behavior (Schaller, 1997),Schaller, M. (1997). The psychological consequences of fame: Three tests of the self-consciousness hypothesis. Journal of Personality, 65, 291–309. Houle counted first-person pronouns in Elliott Smith song lyrics. Houle found that Smith’s use of self-referential pronouns increased steadily from the time of his first album release in 1994 until his suicide in 2003 (2008).Houle, J. (2008). Elliott Smith’s self referential pronouns by album/year. Prepared for teaching SOC 207, Research Methods, at Pennsylvania State University, Department of Sociology. We’ll elaborate on how qualitative and quantitative researchers collect, code, and analyze unobtrusive data in the final portion of this section.
Indirect Measures
Texts are not the only sort of data that researchers can collect unobtrusively. Unobtrusive researchers might also be interested in analyzing the evidence that humans leave behind that tells us something about who they are or what they do. This kind evidence includes the physical tracesEvidence left by people that tells us something about their behaviors or interactions. left by humans and the material artifactsObjects created by humans that tell us something about their beliefs, values, or norms. that tell us something about their beliefs, values, or norms. Physical traces include such things as worn paths across campus, the materials in a landfill or in someone’s trash can (a data source William Rathje and colleagues [Rathje, 1992; Rathje & Murthy, 1992]Rathje, W. (1992). How much alcohol do we drink? It’s a question…so to speak. Garbage, 4, 18–19; Rathje, W., & Murthy, C. (1992). Garbage demographics. American Demographics, 14, 50–55. have used), indentations in furniture, or empty shelves in the grocery store. Examples of material artifacts include video games and video game equipment, sculptures, mementos left on gravestones, housing structures, or even kitchen utensils. What kinds of physical traces or material artifacts might be of interest to you?
I recently visited the National Museum of American History in Washington, DC. While there I saw an exhibit displaying chef Julia Child’s home kitchen, where she filmed many of her famous cooking shows. Seeing the kitchen made me wonder how cooking has changed over the past few decades since Child’s shows were on air. I wondered how the layout of our kitchens and the utensils and appliances they contain might influence how we entertain guests, how much time we spend preparing meals, and how much time we spend cleaning up afterward. Our use of particular kitchen gadgets and utensils might even indicate something about our social class identities.Watch the following clip, featuring satirist Joe Queenan, from the PBS documentary People Like Us on social class in the United States: http://www.youtube.com/watch?v=j_Rtl3Y4EuI. The clip aptly demonstrates the sociological relevance of kitchen gadgets. Answers to these questions have bearing on our norms and interactions as humans; thus they are just the sorts of questions sociologists using unobtrusive methods might be interested in answering. I snapped a few photos of the kitchen while at the museum. Though the glass surrounding the exhibit prevents ideal picture taking, I hope the photos in Figure 11.4 give you an idea of what I saw. Might the organizational scheme used in this kitchen, or the appliances that are either present or missing from it, shape the answers to the questions I pose above about human behaviors and interactions?
Figure 11.4
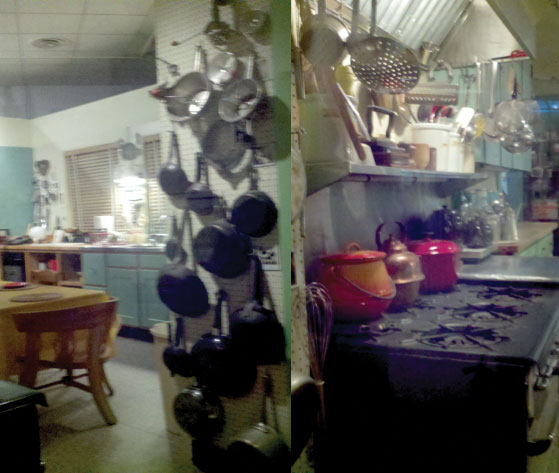
A visit to Chef Julia Child’s kitchen at the National Museum of American History inspired the author to think about how kitchens, kitchen utensils, and kitchen appliances have changed over time.
One challenge with analyzing physical traces and material artifacts is that you generally don’t have access to the people who left the traces or created the artifacts that you are analyzing. (And if you did find a way to contact them, then your research would no longer qualify as unobtrusive!) It can be especially tricky to analyze meanings of these materials if they come from some historical or cultural context other than your own. Situating the traces or artifacts you wish to analyze both in their original contexts and in your own is not always easy and can lead to problems related to validity and reliability. How do you know that you are viewing an object or physical trace in the way that it was intended to be viewed? Do you have the necessary understanding or knowledge about the background of its original creators or users to understand where they were coming from when they created it?
Imagine an alien trying to understand some aspect of Western human culture simply by examining our artifacts. Cartoonist Mark Parisi demonstrates the misunderstanding that could ensue in his drawing featuring three very small aliens standing atop a toilet. One alien says, “Since water is the life-blood on this planet, this must be a temple of some sort.…Let’s stick around and see how they show their respect” (1989).Parisi, M. (1989). Alien cartoon 6. Off the Mark. Retrieved from http://www.offthemark.com/aliens/aliens06.htm Without a contextual understanding of Western human culture, the aliens have misidentified the purpose of the toilet, and they will be in for quite a surprise when someone shows up to use it!
The point is that while physical traces and material artifacts make excellent sources of data, analyzing their meaning takes more than simply trying to understand them from your own contextual position. You must also be aware of who caused the physical trace or created the artifact, when they created it, why they created, and for whom they created it. Answering these questions will require accessing materials in addition to the traces or artifacts themselves. It may require accessing historical documents or, if a contemporary trace or artifact, perhaps another method of data collection such as interviews with its creators.
Analysis of Unobtrusive Data Collected by You
Once you have identified the set of texts, physical traces, or artifacts that you would like to analyze, the next step is to figure out how you’ll analyze them. This step requires that you determine your procedures for coding, understand the difference between manifest and latent content, and understand how to identify patterns across your coded data. We’ll begin by discussing procedures for coding.
You might recall being introduced to coding procedures in Chapter 9 "Interviews: Qualitative and Quantitative Approaches", where we discussed the coding of qualitative interview data. While the coding procedures used for written documents obtained unobtrusively may resemble those used to code interview data, many sources of unobtrusive data differ dramatically from written documents or transcripts. What if your data are sculptures or worn paths, or perhaps kitchen utensils, as in the previously discussed example? The idea of conducting open coding and focused coding on these sources as you would for a written document sounds a little silly, not to mention impossible. So how do we begin to identify patterns across the sculptures or worn paths or utensils we wish to analyze? One option is to take field notes as we observe our data and then code patterns in those notes. Let’s say, for example, that we’d like to analyze kitchen utensils. Taking field notes might be a useful approach were we conducting observations of people actually using utensils in a documentary or on a television program. (Remember, if we’re observing people in person then our method is no longer unobtrusive.)
If rather than observing people in documentaries or television shows our data include a collection of actual utensils, note taking may not be the most effective way to record our observations. Instead, we could create a code sheetThe instrument used by an unobtrusive researcher to record observations. to record details about the utensils in our sample. A code sheet, sometimes referred to as a tally sheet in quantitative coding, is the instrument an unobtrusive researcher uses to record observations.
In the example of kitchen utensils, perhaps we’re interested in how utensils have changed over time. If we had access to sales records for utensils over the past 50 years, we could analyze the top-selling utensil for each year. To do so, we’d want to make some notes about each of the 50 utensils included in our sample. For each top-rated utensil, we might note its name, its purpose, and perhaps its price in current dollar amounts. We might also want to make some assessment about how easy or difficult it is to use or some other qualitative assessment about the utensil and its use or purpose. To rate the difficulty of use we could use a 5-point scale, with 1 being very easy to use and 5 being very difficult to use. We could even record other notes or observations about the utensils that may not occur to us until we actually see the utensils. Our code sheet might look something like the sample shown in Table 11.2 "Sample Code Sheet for Study of Kitchen Utensil Popularity Over Time". Note that the sample sheet contains columns only for 10 years’ worth of utensils. If you were to conduct this project, obviously you’d need to create a code sheet that allows you to record observations for each of the 50 items in your sample.
Table 11.2 Sample Code Sheet for Study of Kitchen Utensil Popularity Over Time
| 1961 | 1962 | 1963 | 1964 | 1965 | 1966 | 1967 | 1968 | 1969 | 1970 | |
|---|---|---|---|---|---|---|---|---|---|---|
| Utensil name | ||||||||||
| Utensil purpose | ||||||||||
| Price (in 2011 $) | ||||||||||
| Ease of use (1–5 scale) | ||||||||||
| Other notes |
As you can see, our code sheet will contain both qualitative and quantitative data. Our “ease of use” rating is a quantitative assessment; we can therefore conduct some statistical analysis of the patterns here, perhaps noting the mean value on ease of use for each decade we’ve observed. We could do the same thing with the data collected in the row labeled Price, which is also quantitative. The final row of our sample code sheet, containing notes about our impressions of the utensils we observe, will contain qualitative data. We may conduct open and focused coding on these notes to identify patterns across those notes. In both cases, whether the data being coded are quantitative or qualitative, the aim is to identify patterns across the coded data.
The Purpose row in our sample code sheet provides an opportunity for assessing both manifest and latent content. Manifest contentContent that is most visible, obvious, or at the surface. is the content we observe that is most apparent; it is the surface content. This is in contrast to latent contentThe underlying meaning of the surface content we observe., which is less obvious. Latent content refers to the underlying meaning of the surface content we observe. In the example of utensil purpose, we might say a utensil’s manifest content is the stated purpose of the utensil. The latent content would be our assessment of what it means that a utensil with a particular purpose is top rated. Perhaps after coding the manifest content in this category we see some patterns that tell us something about the meanings of utensil purpose. Perhaps we conclude, based on the meanings of top-rated utensils across five decades, that the shift from an emphasis on utensils designed to facilitate entertaining in the 1960s to those designed to maximize efficiency and minimize time spent in the kitchen in the 1980s reflects a shift in how (and how much) people spend time in their homes.
Kathleen Denny’s (2011)Denny, K. (2011). Gender in context, content, and approach: Comparing gender messages in Girl Scout and Boy Scout handbooks. Gender & Society, 25, 27–47. recent study of scouting manuals offers another excellent example of the differences between manifest and latent content. Denny compared Boy Scout and Girl Scout handbooks to understand gender socializing among scouts. By counting activity types described in the manuals, Denny learned from this manifest content that boys are offered more individual-based and more scientific activities while girls are offered more group-based and more artistic activities. Denny also analyzed the latent meaning of the messages that scouting handbooks portray about gender; she found that girls were encouraged to become “up-to-date traditional women” while boys were urged to adopt “an assertive heteronormative masculinity” (p. 27).
Key Takeaways
- Content analysts study human communications.
- The texts that content analysts analyze include actual written texts such as newspapers or journal entries as well as visual and auditory sources such as television shows, advertisements, or movies.
- Content analysts most typically analyze primary sources, though in some instances they may analyze secondary sources.
- Indirect measures that content analysts examine include physical traces and material artifacts.
- Manifest content is apparent; latent content is underlying.
- Content analysts use code sheets to collect data.
Exercises
- Identify a research question you could answer using unobtrusive research. Now state a testable hypothesis having to do with your research question. Next identify at least two potential sources of data you might analyze to answer your research question and test your hypothesis.
- Create a code sheet for each of the two potential sources of data that you identified in the preceding exercise.