This is “Purchasing Power Parity”, chapter 6 from the book Policy and Theory of International Finance (v. 1.0). For details on it (including licensing), click here.
For more information on the source of this book, or why it is available for free, please see the project's home page. You can browse or download additional books there. To download a .zip file containing this book to use offline, simply click here.


Chapter 6 Purchasing Power Parity
Purchasing power parity is both a theory about exchange rate determination and a tool to make more accurate comparisons of data between countries. It is probably more important in its latter role since as a theory it performs pretty poorly. Its poor performance arises largely because its simple form depends on several assumptions that are not likely to hold in the real world and because the amount of foreign exchange activity due to importer and exporter demands is much less than the amount of activity due to investor demands. Nonetheless, the theory remains important to provide the background for its use as a tool for cross-country comparisons of income and wages, which is used by international organizations like the World Bank in presenting much of their international data.
6.1 Overview of Purchasing Power Parity (PPP)
Learning Objectives
- Identify the conditions under which the law of one price holds.
- Identify the conditions under which purchasing power parity holds.
Purchasing power parity (PPP)A theory of exchange rate determination based on traders’ motivations that result in a PPP exchange rate when there are no transportation costs and no differential taxes applied. is a theory of exchange rate determination and a way to compare the average costs of goods and services between countries. The theory assumes that the actions of importers and exporters (motivated by cross-country price differences) induce changes in the spot exchange rate. In another vein, PPP suggests that transactions on a country’s current account affect the value of the exchange rate on the foreign exchange (Forex) market. This is in contrast with the interest rate parity theory, which assumes that the actions of investors (whose transactions are recorded on the capital account) induce changes in the exchange rate.
PPP theory is based on an extension and variation of the “law of one price” as applied to the aggregate economy. To explain the theory it is best to first review the idea behind the law of one price.
The Law of One Price (LoOP)
The law of one price says that identical goods should sell for the same price in two separate markets when there are no transportation costs and no differential taxes applied in the two markets. Consider the following information about movie video tapes sold in the U.S. and Mexican markets.
| Price of videos in U.S. market () | $20 |
| Price of videos in Mexican market () | p150 |
| Spot exchange rate () | 10 p/$ |
The dollar price of videos sold in Mexico can be calculated by dividing the video price in pesos by the spot exchange rate as shown:
To see why the peso price is divided by the exchange rate rather than multiplied, notice the conversion of units shown in the brackets. If the law of one price held, then the dollar price in Mexico should match the price in the United States. Since the dollar price of the video is less than the dollar price in the United States, the law of one price does not hold in this circumstance.
The next question to ask is what might happen as a result of the discrepancy in prices. Well, as long as there are no costs incurred to transport the goods, there is a profit-making opportunity through trade. For example, U.S. travelers in Mexico who recognize that identical video titles are selling there for 25 percent less might buy videos in Mexico and bring them back to the United States to sell. This is an example of “goods arbitrage.” An arbitrage opportunity arises whenever one can buy something at a low price in one location, resell it at a higher price, and thus make a profit.
Using basic supply and demand theory, the increase in demand for videos in Mexico would push up the price of videos. The increase in supply of videos on the U.S. market would force the price down in the United States. In the end, the price of videos in Mexico may rise to, say, p180 while the price of videos in the United States may fall to $18. At these new prices the law of one price holds since
The idea in the law of one price is that identical goods selling in an integrated market in which there are no transportation costs, no differential taxes or subsidies, and no tariffs or other trade barriers should sell at identical prices. If different prices prevailed, then there would be profit-making opportunities by buying the good in the low price market and reselling it in the high price market. If entrepreneurs took advantage of this arbitrage opportunity, then the prices would converge to equality.
Of course, for many reasons the law of one price does not hold even between markets within a country. The price of beer, gasoline, and stereos will likely be different in New York City and in Los Angeles. The price of these items will also be different in other countries when converted at current exchange rates. The simple reason for the discrepancies is that there are costs to transport goods between locations, there are different taxes applied in different states and different countries, nontradable input prices may vary, and people do not have perfect information about the prices of goods in all markets at all times. Thus to refer to this as an economic “law” does seem to exaggerate its validity.
From LoOP to PPP
The purchasing power parity theory is really just the law of one price applied in the aggregate but with a slight twist added. If it makes sense from the law of one price that identical goods should sell for identical prices in different markets, then the law ought to hold for all identical goods sold in both markets.
First, let’s define the variable CB$ to represent the cost of a basket of goods in the United States denominated in dollars. For simplicity we could imagine using the same basket of goods used in the construction of the U.S. consumer price index (CPI$). The consumer price index (CPI)An index that measures the average level of prices of goods and services in an economy relative to a base year. uses a market basket of goods that are purchased by an average household during a specified period. The basket is determined by surveying the quantity of different items purchased by many different households. One can then determine, on average, how many units of bread, milk, cheese, rent, electricity, and so on are purchased by the typical household. You might imagine it’s as if all products are purchased in a grocery store with items being placed in a basket before the purchase is made. CB$ then represents the dollar cost of purchasing all the items in the market basket. We will similarly define CBp to be the cost of a market basket of goods in Mexico denominated in pesos.
Now if the law of one price holds for each individual item in the market basket, then it should hold for the market baskets as well. In other words,
Rewriting the right-hand side equation allows us to put the relationship in the form commonly used to describe absolute purchasing power parity, which is
If this condition holds between two countries, then we would say PPP is satisfied. The condition says that the PPP exchange rateThe exchange rate that equalizes the cost of a market basket of goods between two countries. (pesos per dollar) will equal the ratio of the costs of the two market baskets of goods denominated in local currency units. Note that the reciprocal relationship is also valid.
Because the cost of a market basket of goods is used in the construction of the country’s consumer price index, PPP is often written as a relationship between the exchange rate and the country’s price indices. However, it is not possible merely to substitute the price index directly for the cost of the market basket used above. To see why, we will review the construction of the CPI in Chapter 6 "Purchasing Power Parity", Section 6.2 "The Consumer Price Index (CPI) and PPP".
Key Takeaways
- The law of one price says that identical goods should sell for identical prices in two different markets when converted at the current exchange rate and when there are no transportation costs and no differential taxes applied.
- The purchasing power parity theory is an aggregated version of the law of one price.
- The purchasing power parity condition says that identical market baskets should sell for identical prices in two different markets when converted at the current exchange rate and when there are no transportation costs and no differential taxes applied.
Exercises
-
Jeopardy Questions. As in the popular television game show, you are given an answer to a question and you must respond with the question. For example, if the answer is “a tax on imports,” then the correct question is “What is a tariff?”
- The exchange rate value if toothpaste costs $2.50 in the United States and 30 pesos in Mexico and the law of one price holds.
- The exchange rate value if a market basket costs $450 in the United States and 5,400 pesos in Mexico and purchasing power parity holds.
- The term used to describe a collection of goods and services consumed by a typical consumer.
- The term used to distinguish PPP based on price levels rather than inflation rates.
- The term used to describe the economic principle that identical goods should sell at identical prices in different markets.
-
Use the information in the table below to answer the following question. Show your work.
The Economist Price per Issue Exchange Rate (December 2, 1999) United States $3.95 − Canada C$ 4.95 1.47 C$/$ Japan ¥920 102 ¥/$ - Calculate the implied purchasing power parity exchange rates between Canada and the United States and between Japan and the United States based on the price of the Economist magazine.
6.2 The Consumer Price Index (CPI) and PPP
Learning Objective
- Learn the relationship between the consumer price index and the PPP exchange rate.
The consumer price index (CPI) is an index that measures the average level of prices of goods and services in an economy relative to a base year. To track only what happens to prices, the quantities of goods purchased is assumed to remain fixed from year to year. This is accomplished by determining—with survey methods—the average quantities of all goods and services purchased by a typical household during some period. The quantities of all of these goods together are referred to as the average market basket. For example, the survey might find that the average household in one month purchases 10 gallons of gas, 15 cans of beer, 3.2 gallons of milk, 2.6 pounds of butter, and so on. The basket of goods would also contain items like health and auto insurance, housing services, utility services, and many other items. We can describe the market basket easily as a collection or set of quantities (Q1, Q2, Q3,…, Qn). Here Q1 may be the quantity of gasoline, Q2 the quantity of beer, and so on. The set has n different quantity entries, implying that there are n different items in the market basket.
The cost of the market basket is found by surveying the average prices for each of the n products in the market in question. This survey would yield a collection or set of prices (P1, P2, P3,…, Pn). The cost of the market basket is then found by summing the product of the price and quantity for each item. That is, CB = P1Q1 + P2Q2 + P3Q3 +…+ PnQn, or
The first year in which the index is constructed is called the base year. Suppose 1982 is the base year for the United States. Let CBYY represent the cost of the market basket evaluated at the prices that prevail in the year (YY) (e.g., CB09 is the cost of a market basket evaluated in 2009 prices). The CPI is derived according to the following formula:
where CPIYY is the CPI in the year (YY). The term is multiplied by 100 by convention, probably because it reduces the need to use digits after a decimal point. Notice that the CPI in the base year is equal to 100—that is, CPI82 = 100—because CB82/CB82 = 1. This is true for all indices—they are by convention set to 100 in the base year.
The CPI in a different year (either earlier or later) represents the ratio of the cost of the market basket in that year relative to the cost of the same basket in the base year. If in 1982 the cost of the market basket rises, then the CPI will rise above 100. If the cost of the market basket falls, then the CPI would fall below 100.
If the CPI rises, it does not mean that the prices of all the goods in the market basket have risen. Some prices may rise more or less. Some prices may even fall. The CPI measures the average price change of goods and services in the basket.
The inflation rate for an economy is the percentage change in the CPI during a year. Thus if CPI08 on January 1, 2008, and CPI09 on January 1, 2009, are the price indices, then the inflation rate during 2008 is given by
PPP Using the CPI
The purchasing power parity relationship can be written using the CPI with some small adjustments. First, consider the following ratio of 2009 consumer price indices between Mexico and the United States:
Given that the base year is 2008, the ratio is written in terms of the market basket costs on the right-hand side and then rewritten into another form. The far right-hand side expression now reflects the purchasing power parity exchange rates in 2009 divided by the PPP exchange rate in 2008, the base year. In other words,
So, in general, if you want to use the consumer price indices for two countries to derive the PPP exchange rate for 2009, you must apply the following formula, derived by rewriting the above as
where represents the PPP exchange rate that prevails in the base year between the two countries. Note that in order for this formula to work correctly, the CPIs in both countries must share the same base year. If they did not, a more complex formula would need to be derived.
Key Takeaways
- A country’s consumer price index in year (YY) is derived as the ratio of the market basket cost in year (YY) and the market basket cost in the base year.
- The PPP exchange rate between two countries can be written as the ratio of the their consumer price indices in that year multiplied by an adjustment factor given by the PPP exchange rate in the base year of the countries’ CPIs.
Exercise
-
Suppose a consumer purchases the following products each week: ten gallons of gas, fifteen cans of beer, three gallons of milk, and two pounds of butter. Suppose in the initial week the prices of the products are $3 per gallon of gas, $2 per can of beer, $4 per gallon of milk, and $4 per pound of butter. Suppose one year later the prices of the same products are $2 per gallon of gas, $3 per can of beer, $5 per gallon of milk, and $5 per pound of butter.
- Calculate the cost of a weekly market basket in the initial base period.
- Calculate the cost of a market basket one year later.
- Construct the price index value for both years.
- What is the inflation rate between the two years?
6.3 PPP as a Theory of Exchange Rate Determination
Learning Objective
- Learn how adjustment to equilibrium occurs in the PPP model.
The purchasing power parity (PPP) relationship becomes a theory of exchange rate determination by introducing assumptions about the behavior of importers and exporters in response to changes in the relative costs of national market baskets. Recall the story of the law of one price, when the price of a good differed between two countries’ markets and there was an incentive for profit-seeking individuals to buy the good in the low price market and resell it in the high price market. Similarly, if a market basket containing many different goods and services costs more in one market than another, we should likewise expect profit-seeking individuals to buy the relatively cheaper goods in the low-cost market and resell them in the higher-priced market. If the law of one price leads to the equalization of the prices of a good between two markets, then it seems reasonable to conclude that PPP, describing the equality of market baskets across countries, should also hold.
However, adjustment within the PPP theory occurs with a twist compared to adjustment in the law of one price story. In the law of one price story, goods arbitrage in a particular product was expected to affect the prices of the goods in the two markets. The twist that’s included in the PPP theory is that arbitrage, occurring across a range of goods and services in the market basket, will affect the exchange rate rather than the market prices.
PPP Equilibrium Story
To see why the PPP relationship represents an equilibrium, we need to tell an equilibrium story. An equilibrium story in an economic model is an explanation of how the behavior of individuals will cause the equilibrium condition to be satisfied. The equilibrium condition is the PPP equation written as
The endogenous variable in the PPP theory is the exchange rate. Thus we need to explain why the exchange rate will change if it is not in equilibrium. In general there are always two versions of an equilibrium story, one in which the endogenous variable (Ep/$ here) is too high and one in which it is too low.
PPP equilibrium story 1. Let’s consider the case in which the exchange rate is too low to be in equilibrium. This means that
where Ep/$ is the exchange rate that prevails on the spot market. Since it is less than the ratio of the market basket costs in Mexico and the United States, it is also less than the PPP exchange rate. The right side of the expression is rewritten to show that the cost of a market basket in the United States evaluated in pesos (i.e., CB$Ep/$) is less than the cost of the market basket in Mexico also evaluated in pesos. Thus it is cheaper to buy the basket in the United States, or in other words, it is more profitable to sell items in the market basket in Mexico.
The PPP theory now suggests that the cheaper basket in the United States will lead to an increase in demand for goods in the U.S. market basket by Mexico. As a consequence, it will increase the demand for U.S. dollars on the foreign exchange (Forex) market. Dollars are needed because purchases of U.S. goods require U.S. dollars. Alternatively, U.S. exporters will realize that goods sold in the United States can be sold at a higher price in Mexico. If these goods are sold in pesos, the U.S. exporters will want to convert the proceeds back to dollars. Thus there is an increase in U.S. dollar demand (by Mexican importers) and an increase in peso supply (by U.S. exporters) on the Forex. This effect is represented by a rightward shift in the U.S. dollar demand curve in Figure 6.1 "Forex Adjustment When ". At the same time, U.S. consumers will reduce their demand for the pricier Mexican goods. This will reduce the supply of dollars (in exchange for pesos) on the Forex, which is represented by a leftward shift in the U.S. dollar supply curve in the Forex market.
Figure 6.1 Forex Adjustment When Ep/$ Is Low
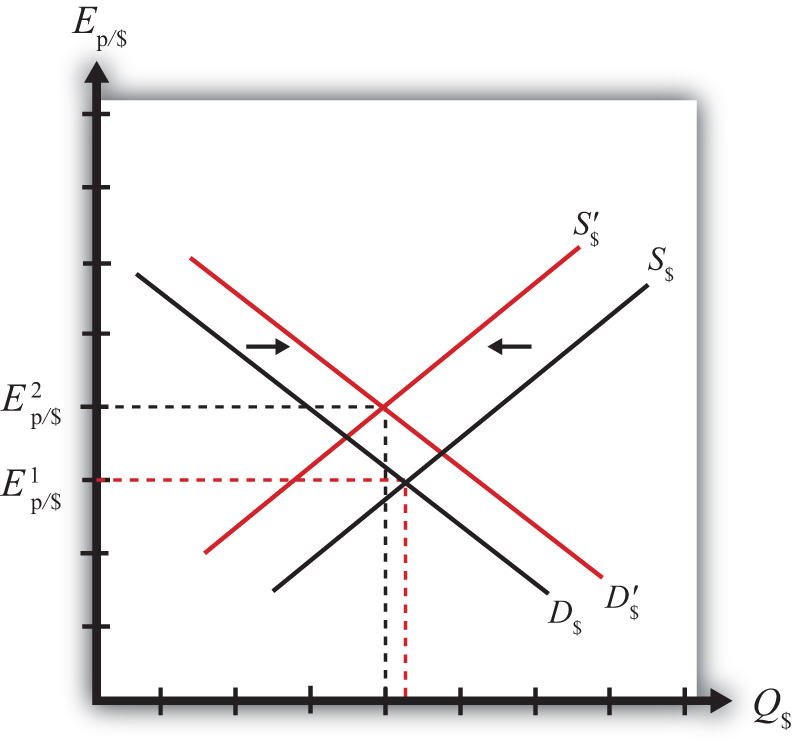
Both the shift in demand and supply will cause an increase in the value of the dollar and thus the exchange rate (Ep/$) will rise. As long as the U.S. market basket remains cheaper, excess demand for the dollar will persist and the exchange rate will continue to rise. The pressure for change ceases once the exchange rate rises enough to equalize the cost of market baskets between the two countries and PPP holds.
PPP equilibrium story 2. Now let’s consider the other equilibrium story (i.e., the case in which the exchange rate is too high to be in equilibrium). This implies that
The left-side expression says that the spot exchange rate is greater than the ratio of the costs of market baskets between Mexico and the United States. In other words, the exchange rate is above the PPP exchange rate. The right-side expression says that the cost of a U.S. market basket, converted to pesos at the current exchange rate, is greater than the cost of a Mexican market basket in pesos. Thus, on average, U.S. goods are relatively more expensive while Mexican goods are relatively cheaper.
The price discrepancies should lead consumers in the United States or importing firms to purchase less expensive goods in Mexico. To do so, they will raise the supply of dollars in the Forex in exchange for pesos. Thus the supply curve of dollars will shift to the right as shown in Figure 6.2 "Forex Adjustment When ". At the same time, Mexican consumers would refrain from purchasing the more expensive U.S. goods. This would lead to a reduction in demand for dollars in exchange for pesos on the Forex. Hence, the demand curve for dollars shifts to the left. Due to the demand decrease and the supply increase, the exchange rate (Ep/$) falls. This means that the dollar depreciates and the peso appreciates.
Figure 6.2 Forex Adjustment When Ep/$ Is High
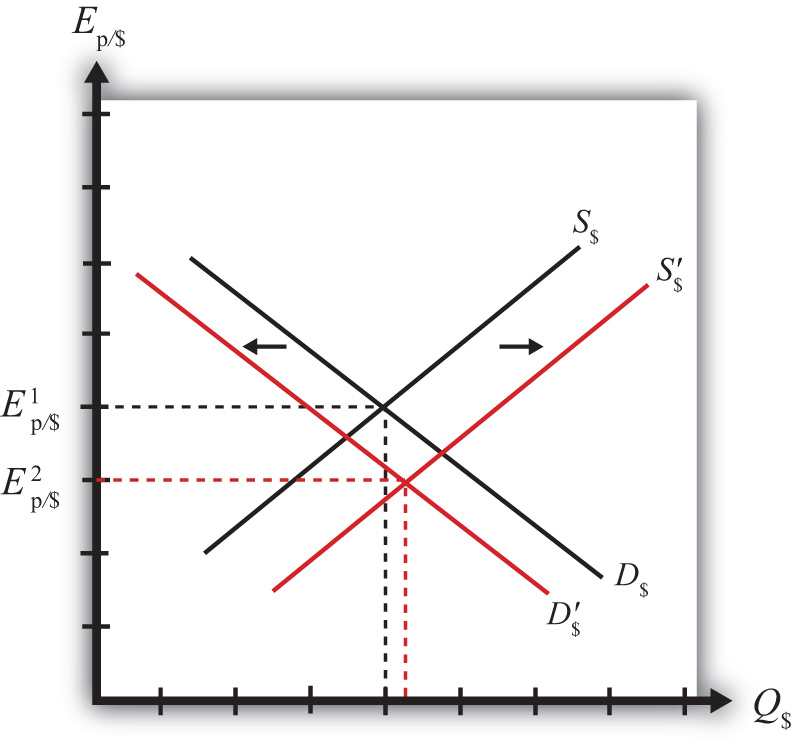
Extra demand for pesos will continue as long as goods and services remain cheaper in Mexico. However, as the peso appreciates (the dollar depreciates), the cost of Mexican goods rises relative to U.S. goods. The process ceases once the PPP exchange rate is reached and market baskets cost the same in both markets.
Adjustment to Price Level Changes under PPP
In the PPP theory, exchange rate changes are induced by changes in relative price levels between two countries. This is true because the quantities of the goods are always presumed to remain fixed in the market baskets. Therefore, the only way that the cost of the basket can change is if the goods’ prices change. Since price level changes represent inflation rates, this means that differential inflation rates will induce exchange rate changes according to the theory.
If we imagine that a country begins with PPP, then the inequality given in equilibrium story 1, can arise if the price level rises in Mexico (peso inflation), if the price level falls in the United States (dollar deflation), or if Mexican inflation is more rapid than U.S. inflation. According to the theory, the behavior of importers and exporters would now induce a dollar appreciation and a peso depreciation. In summary, an increase in Mexican prices relative to the change in U.S. prices (i.e., more rapid inflation in Mexico than in the United States) will cause the dollar to appreciate and the peso to depreciate according to the purchasing power parity theory.
Similarly, if a country begins with PPP, then the inequality given in equilibrium story 2, can arise if the price level rises in the United States (dollar inflation), the price level falls in Mexico (peso deflation), or if U.S. inflation is more rapid than Mexican inflation. In this case, the inequality would affect the behavior of importers and exporters and induce a dollar depreciation and peso appreciation. In summary, more rapid inflation in the United States would cause the dollar to depreciate while the peso would appreciate.
Key Takeaways
- An increase in Mexican prices relative to the change in U.S. prices (i.e., more rapid inflation in Mexico than in the United States) will cause the dollar to appreciate and the peso to depreciate according to the purchasing power parity theory.
- More rapid inflation in the United States would cause the dollar to depreciate while the peso would appreciate.
Exercise
-
Jeopardy Questions. As in the popular television game show, you are given an answer to a question and you must respond with the question. For example, if the answer is “a tax on imports,” then the correct question is “What is a tariff?”
- Of increase, decrease, or no change, the effect on the demand for euros in the foreign exchange market if a market basket costs more in the United States than it does in Germany.
- Of increase, decrease, or no change, the effect on the supply of dollars in the foreign exchange market if a market basket costs more in the United States than it does in Germany.
- Of increase, decrease, or no change, the effect on the U.S. dollar value according to the PPP theory if a market basket costs $300 in the United States and €200 in Germany and the exchange rate is E$/€ = 1.30.
- Of increase, decrease, or no change, the effect on the euro value according to the PPP theory if a market basket costs €200 in Germany and ¥22,000 in Japan and the exchange rate is E¥/€ = 115.
- Of increase, decrease, or no change, the effect on the euro value according to the PPP theory if a market basket costs €200 in Germany and ¥22,000 in Japan and the exchange rate is E¥/€ = 100.
6.4 Problems and Extensions of PPP
Learning Objectives
- Identify the reasons why the PPP condition is rarely satisfied between two countries.
- Learn the dynamic version of PPP.
Problems with the PPP Theory
The main problem with the purchasing power parity (PPP) theory is that the PPP condition is rarely satisfied within a country. There are quite a few reasons that can explain this and so, given the logic of the theory, which makes sense, economists have been reluctant to discard the theory on the basis of lack of supporting evidence. Below we consider some of the reasons PPP may not hold.
Transportation costs and trade restrictions. Since the PPP theory is derived from the law of one price, the same assumptions are needed for both theories. The law of one price assumes that there are no transportation costs and no differential taxes applied between the two markets. These mean that there can be no tariffs on imports or other types of restrictions on trade. Since transport costs and trade restrictions do exist in the real world, this would tend to drive prices for similar goods apart. Transport costs should make a good cheaper in the exporting market and more expensive in the importing market. Similarly, an import tariff would drive a wedge between the prices of an identical good in two trading countries’ markets, raising it in the import market relative to the export market price. Thus the greater transportation costs and trade restrictions are between countries, the less likely for the costs of market baskets to be equalized.
Costs of nontradable inputs. Many items that are homogeneous nevertheless sell for different prices because they require a nontradable input in the production process. As an example, consider why the price of a McDonald’s Big Mac hamburger sold in downtown New York City is higher than the price of the same product in the New York suburbs. Because the rent for restaurant space is much higher in the city center, the restaurant will pass along its higher costs in the form of higher prices. Substitute products in the city center (other fast food restaurants) will face the same high rental costs and thus will charge higher prices as well. Because it would be impractical (i.e., costly) to produce the burgers at a cheaper suburban location and then transport them for sale in the city, competition would not drive the prices together in the two locations.
Perfect information. The law of one price assumes that individuals have good, even perfect, information about the prices of goods in other markets. Only with this knowledge will profit seekers begin to export goods to the high price market and import goods from the low-priced market. Consider a case in which there is imperfect information. Perhaps some price deviations are known to traders but other deviations are not known, or maybe only a small group of traders know about a price discrepancy and that group is unable to achieve the scale of trade needed to equalize the prices for that product. (Perhaps they face capital constraints and can’t borrow enough money to finance the scale of trade needed to equalize prices.) In either case, traders without information about price differences will not respond to the profit opportunities and thus prices will not be equalized. Thus the law of one price may not hold for some products, which would imply that PPP would not hold either.
Other market participants. Notice that in the PPP equilibrium stories, it is the behavior of profit-seeking importers and exporters that forces the exchange rate to adjust to the PPP level. These activities would be recorded on the current account of a country’s balance of payments. Thus it is reasonable to say that the PPP theory is based on current account transactions. This contrasts with the interest rate parity theory in which the behavior of investors seeking the highest rates of return on investments motivates adjustments in the exchange rate. Since investors are trading assets, these transactions would appear on a country’s capital account of its balance of payments. Thus the interest rate parity theory is based on capital account transactions.
It is estimated that there are approximately $1–2 trillion dollars worth of currency exchanged every day on international foreign exchange (Forex) markets. That’s one-eighth of U.S. GDP, which is the value of production in the United States in an entire year. In addition, the $1–2 trillion estimate is made by counting only one side of each currency trade. Thus that’s an enormous amount of trade. If one considers the total amount of world trade each year and then divides by 365, one can get the average amount of goods and services traded daily. This number is less than $100 billion dollars. This means that the amount of daily currency transactions is more than ten times the amount of daily trade. This fact would seem to suggest that the primary effect on the daily exchange rate must be caused by the actions of investors rather than importers and exporters. Thus the participation of other traders in the Forex market, who are motivated by other concerns, may lead the exchange rate to a value that is not consistent with PPP.
Relative PPP
There is an alternative version of the PPP theory called the “relative PPP theoryA dynamic version of the PPP theory that relates currency appreciation or depreciation to differences in inflation rates between countries..” In essence this is a dynamic version of the absolute PPP theory. Since absolute PPP suggests that the exchange rate may respond to inflation, we can imagine that the exchange rate would change in a systematic way given that a continual change in the price level (inflation) is occurring.
In the relative PPP theory, exchange rate changes over time are assumed to be dependent on inflation rate differentials between countries according to the following formula:
Here the percentage change in the dollar value between the first period and the second period is given on the left side. The right side gives the differences in the inflation rates between Mexico and the United States that were evaluated over the same time period. The implication of relative PPP is that if the Mexican inflation rate exceeds the U.S. inflation rate, then the dollar will appreciate by that differential over the same period. The logic of this theory is the same as in absolute PPP. Importers and exporters respond to variations in the relative costs of market baskets so as to maintain the law of one price, at least on average. If prices continue to rise faster in Mexico than in the United States, for example, price differences between the two countries would grow and the only way to keep up with PPP is for the dollar to appreciate continually versus the peso.
Key Takeaways
- Purchasing power parity (PPP) will not be satisfied between countries when there are transportation costs, trade barriers (e.g., tariffs), differences in prices of nontradable inputs (e.g., rental space), imperfect information about current market conditions, and when other Forex market participants, such as investors, trade currencies for other reasons.
- Relative PPP is a dynamic version of the theory that relates currency appreciation or depreciation to differences in country inflation rates.
Exercise
-
Jeopardy Questions. As in the popular television game show, you are given an answer to a question and you must respond with the question. For example, if the answer is “a tax on imports,” then the correct question is “What is a tariff?”
- The name for the PPP theory based on relative inflation rates between countries.
- A type of trade cost whose presence is likely to cause deviations in the law of one price and PPP.
- The term used to describe a kind of production input, of which office rental is one type.
- Traders need to have information about this in other markets in order to take advantage of arbitrage opportunities.
6.5 PPP in the Long Run
Learning Objective
- Interpret the PPP theory as a projection of long-term tendencies in exchange rate values.
In general, the purchasing power parity (PPP) theory works miserably when applied to real-world data. In other words, it is rare for the PPP relationship to hold true between any two countries at any particular point in time. In most scientific disciplines, the failure of a theory to be supported by the data means the theory is refuted and should be thrown out or tossed away. However, economists have been reluctant to do that with the PPP theory. In part this is because the logic of the theory seems particularly sound. In part it’s because there are so many “frictions” in the real world, such as tariffs, nontariff barriers, transportation costs, measurement problems, and so on that it would actually be surprising for the theory to work when applied directly to the data. (It is much like expecting an object to follow Newton’s laws of motion while sitting on the ground.)
In addition, economists have conceived of an alternative way to interpret or apply the PPP theory to overcome the empirical testing problem. The trick is to think of PPP as a “long-run” theory of exchange rate determination rather than a short-run theory. Under such an interpretation, it is no longer necessary for PPP to hold at any point in time. Instead, the PPP exchange rate is thought to represent a target toward which the spot exchange rate is slowly drawn.
This long-run interpretation requires an assumption that importers and exporters cannot respond quickly to deviations in the cost of market baskets between countries. Instead of immediate responses to price differences between countries by engaging in arbitrage—buying at the low price and selling high—traders respond slowly to these price signals. Some reasons for the delay include imperfect information (traders are not aware of the price differences), long-term contracts (traders must wait till current contractual arrangements expire), and/or marketing costs (entry to new markets requires research and setup costs). In addition, we recognize that the exchange rate is not solely determined by trader behavior. Investors, who respond to different incentives, might cause persistent deviations from the PPP exchange rate even if traders continue to respond to the price differences.
When there is a delayed response, PPP no longer needs to hold at a particular point in time. However, the theory does imagine that traders eventually will adjust to the price differences (buying low and selling high), causing an eventual adjustment of the spot exchange rate toward the PPP rate. However, as adjustment occurs, it is quite possible that the PPP exchange rate also continues to change. In this case, the spot exchange rate is adjusting toward a moving target.
How long will this adjustment take? In other words, how long is the long run? The term itself is generally used by economists to represent some “unspecified” long period of time; it might be several months, years, or even decades. Also, since the target, the PPP exchange rate, is constantly changing, it is quite possible that it is never reached. The adjustment process may never allow the exchange rate to catch up to the target even though it is constantly chasing it.
Perhaps the best way to see what the long-run PPP theory suggests is to consider Figure 6.3 "Hypothetical Long-Term Trend". The figure presents constructed data (i.e., made up) between two countries, A and B. The dotted black line shows the ratio of the costs of market baskets between the two countries over a long period, a century between 1904 and 2004. It displays a steady increase, indicating that prices have risen faster in country A relative to country B. The solid blue line shows a plot of the exchange rate between the two countries during the same period. If PPP were to hold at every point in time, then the exchange rate plot would lie directly on top of the market basket ratio plot. The fact that it does not means PPP did not hold all the time. In fact, PPP held only at times when the exchange rate plot crosses the market basket ratio plot; on the diagram this happened only twice during the century—not a very good record.
Figure 6.3 Hypothetical Long-Term Trend
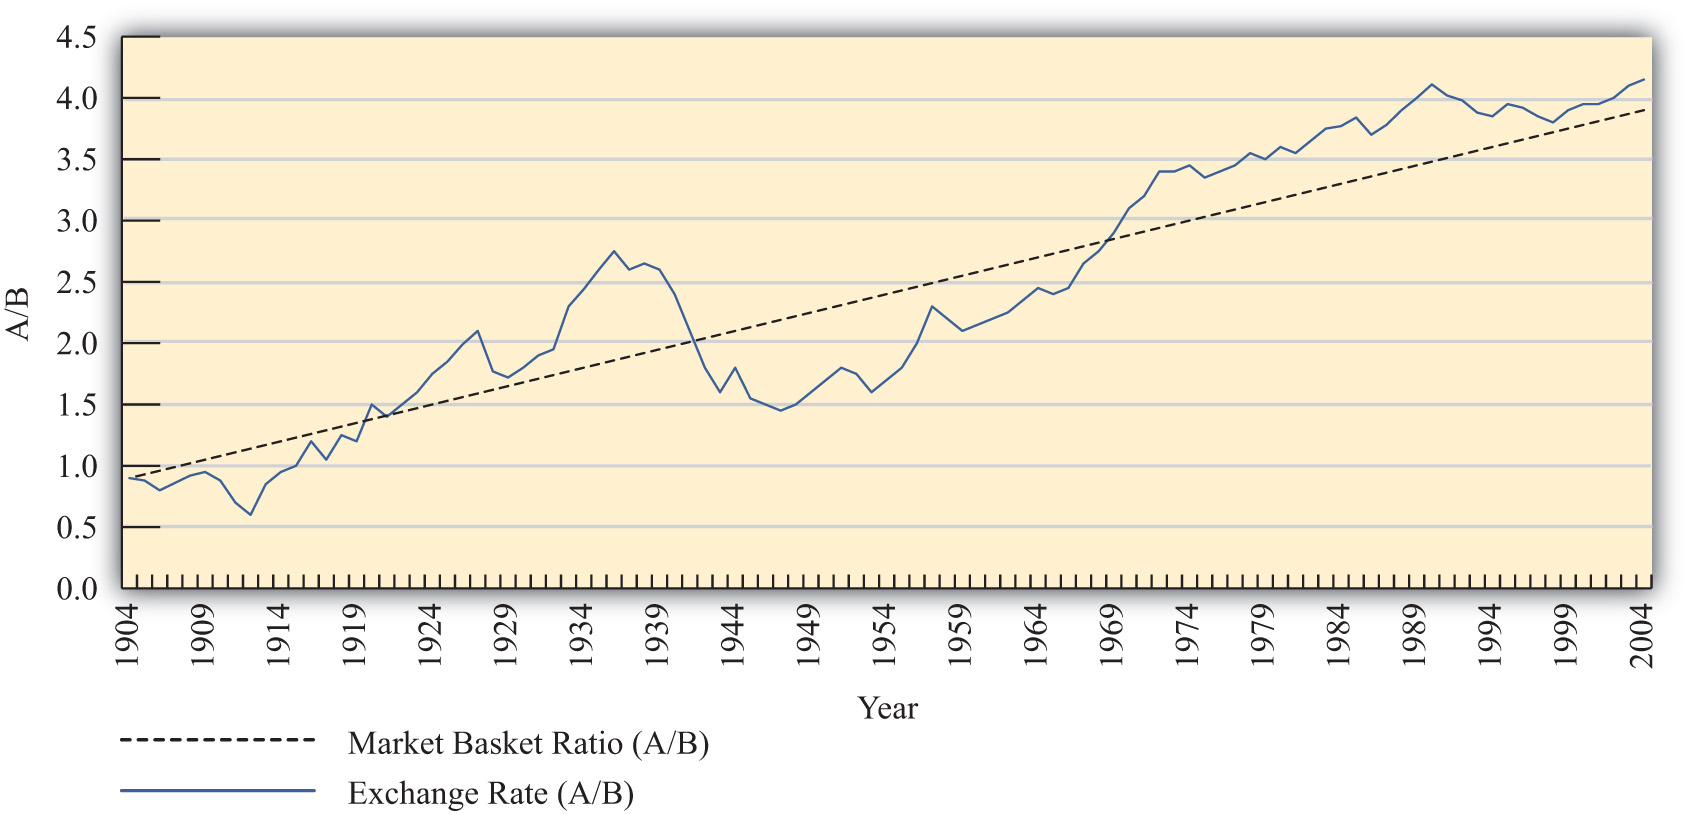
Nonetheless, despite performing poorly with respect to moment-by-moment PPP, the figure displays an obvious regularity. The trend of the exchange rate between the countries is almost precisely the trend in the market basket ratio; both move upward at about the same “average” rate. Sometimes the exchange rate is below the market basket ratio, even for a long period of time, but at other times, the exchange rate rises up above the market basket ratio.
The idea here is that lengthy exchange rate deviations from the market basket ratio (i.e., the PPP exchange rate) mean long periods of time in which the cost of goods is cheaper in one country than in another. Eventually, traders will respond to these price discrepancies and begin to import more from the less expensive country. This will lead to the increase in demand for that country’s currency and cause the exchange rate to move back toward the market basket ratio. However, in the long-run version of the theory, this will take time, sometimes a considerable amount of time, even years or more.
To see how this relationship works in one real-world example, consider Figure 6.4 "U.S./UK Long-Term Trends". It plots the exchange rate (E$/£) between the U.S. dollar and the British pound between 1913 and 2004 together with an adjusted ratio of the countries’ consumer price indices (CPIs) during the same period.A technical point: The ratio of CPIs is adjusted because the ratio of CPIs must be multiplied by the PPP exchange rate that prevailed in the base year for the two countries. However, the CPI series used has 1967 as the base year in the United Kingdom and 1974 as the base year in the United States. This would mean the CPI ratio should be multiplied by the ratio of the cost of a market basket in the United States in 1974 divided by the market basket cost in the United Kingdom in 1967. Unsurprisingly, I don’t have that information. Thus I’ll assume a number (1.75) that is somewhat greater than the actual exchange rate that prevailed at the time. The higher number may account for the fact that prices rose considerably between 1967 and 1974. In any case, it remains a guess. The adjusted ratio represents an estimate of the ratio of the costs of market baskets between the two countries.
Figure 6.4 U.S./UK Long-Term Trends
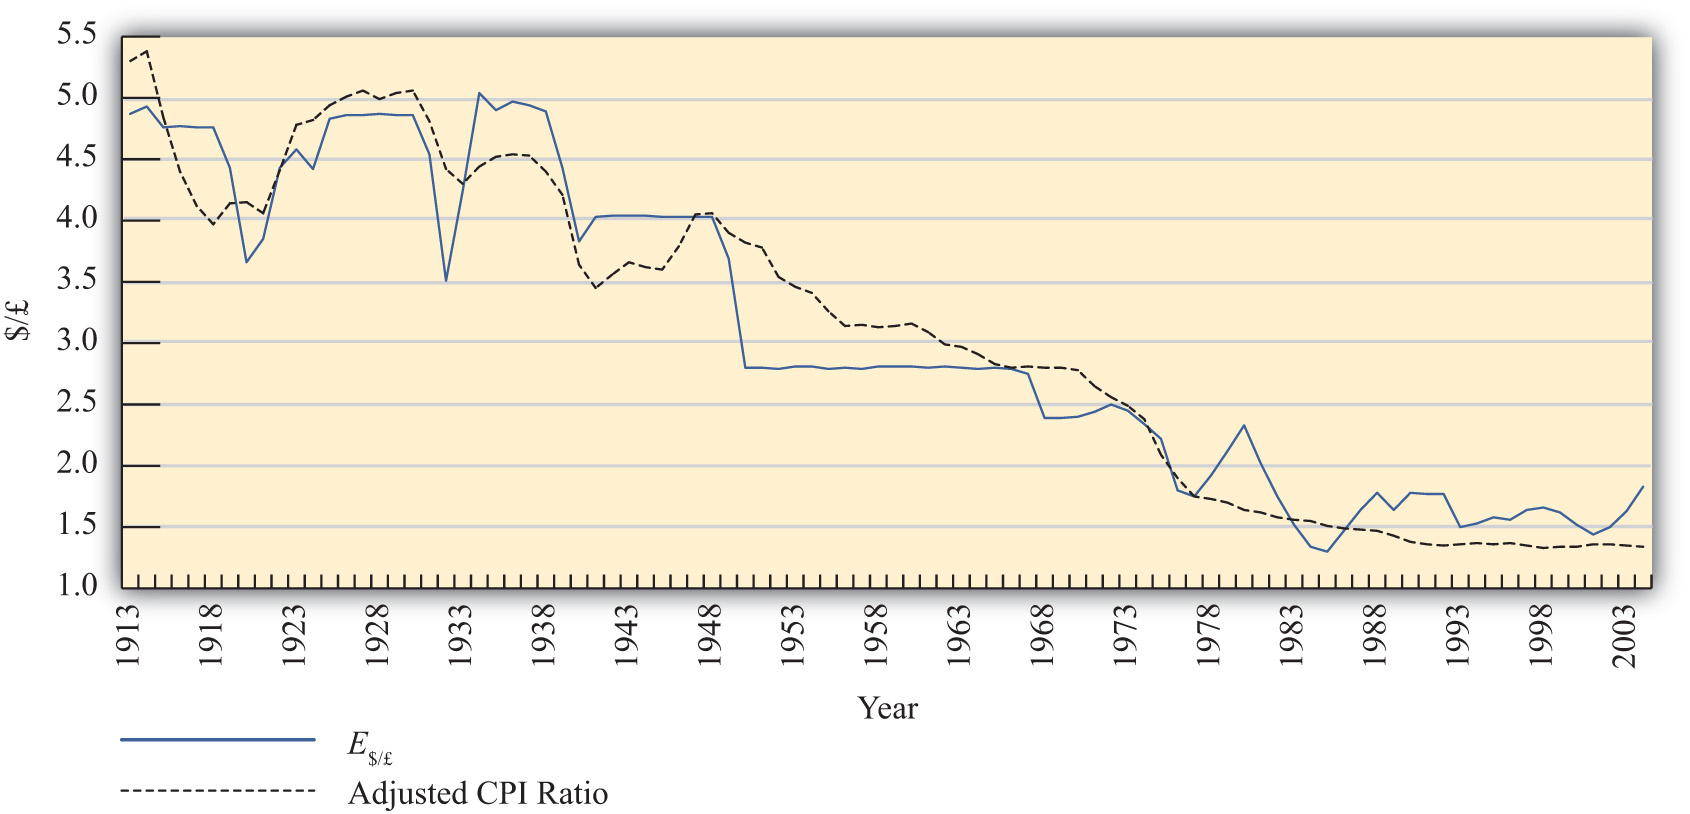
In the diagram, the dotted black line represents the estimated ratio of market basket costs and the solid blue line is the exchange rate (E$/£). Note how closely the exchange rate tracks the trend in the market basket ratio. This remains true even though the exchange rate remained fixed during some lengthy periods of time, as in the 1950s and 1960s. While this depiction is just two countries over a long period, it is suggestive that the long-run version of PPP may have some validity.
More sophisticated empirical tests of the long-run version of PPP have shown mixed results, as some studies support the hypothesis while others tend to reject it. Regardless, there is much more support for this version of the theory than for the much more simplistic short-run version.
Key Takeaways
- Under the long-run purchasing power parity (PPP) theory, the PPP exchange rate is thought to represent a target toward which the spot exchange rate is slowly drawn over time. The empirical evidence for this theory is mixed.
- Long-run data showing the trend in consumer price index (CPI) ratios between the United States and the United Kingdom relative to the $/£ exchange rate suggest some validity to the theory.
Exercise
-
Jeopardy Questions. As in the popular television game show, you are given an answer to a question and you must respond with the question. For example, if the answer is “a tax on imports,” then the correct question is “What is a tariff?”
- The term used by economists to denote an unspecified point in time in the distant future.
- The term used by economists to denote an unspecified point in time in the near future.
- The term used to describe the general path along which a variable is changing.
- Under this version of the PPP theory, the PPP exchange rate represents a target toward which the spot exchange rate is slowly drawn over time.
6.6 Overvaluation and Undervaluation
Learning Objective
- Recognize how the terms overvalued and undervalued exchange rates are defined, applied, and interpreted.
It is quite common to hear people claim that a country’s exchange rate is overvalued or undervalued. The first question one should ask when someone claims the exchange rate is overvalued is “overvalued with respect to what?” There are two common reference exchange rates often considered. The person may mean the exchange rate is overvalued with respect to purchasing power parity (PPP), or he may mean the exchange rate is overvalued relative to the rate presumed Needed to balance the current account (CA).
The mere use of these terms suggests immediately that there is some “proper” value for the exchange rate. However, one should refrain from accepting this implication. As was previously discussed, PPP is unlikely to hold, even over very long periods, for a variety of very good reasons. Also, there is no reason to think that current account balance represents some equilibrium or goal for an economy: countries can run trade deficits or surpluses for an extended period and suffer no ill effects. Thus overvaluation or undervaluation of an exchange rate, for either reason (PPP or current account balance) should be thought of simply as something that happens. Of more interest is what it means when it happens.
Over- and Undervaluation with Respect to PPP
First let’s consider over- and undervaluation with respect to PPP. The PPP exchange rate is defined as the rate that equalizes the cost of a market basket of goods between two countries. The PPP exchange rate between the Mexican peso and the U.S. dollar would be written as
which represents the PPP value of the U.S. dollar in terms of pesos.
If the U.S. dollar is overvalued with respect to the Mexican peso, then the spot exchange rate exceeds the PPP exchange rate:
This will also mean the exchange rate exceeds the ratio of market basket costs:
therefore, the following will hold:
The left side (LS) of this expression represents the cost of a U.S. market basket converted to pesos at the current spot exchange rate. The right side (RS) is the cost of the basket in Mexico also evaluated in pesos. Since LS > RS, goods and services cost more on average in the United States than in Mexico at the current exchange rate. Thus for the U.S. dollar to be overvalued with respect to the peso means that goods and services are relatively more expensive in the United States than in Mexico. Of course, it also implies that goods and services are relatively cheaper in Mexico.
A simple guide to judge whether a currency is overvalued is to consider it from the perspective of a tourist. When the U.S. dollar is overvalued, a U.S. tourist traveling to Mexico will find that many products seem cheaper than in the United States, after converting at the spot exchange rate. Thus an overvalued currency will buy more in other countries.
An undervalued currency works in the opposite direction. When the U.S. dollar is undervalued, the cost of a basket of goods in the United States is lower than the cost in Mexico when evaluated at the current exchange rate. To a U.S. tourist, Mexican goods and services would seem more expensive on average. Thus an undervalued currency will buy less in other countries.
Finally, if the U.S. dollar is overvalued with respect to the Mexican peso, it follows that the peso is undervalued with respect to the dollar. In this case, since the U.S. tourists would find Mexican goods comparatively cheap, Mexican tourists would find U.S. goods to be comparatively expensive. If the U.S. dollar were undervalued, then the peso would be overvalued.
Is overvaluation or undervaluation good or bad? That depends on what a person is trying to achieve. For example, if the U.S. dollar is overvalued with respect to the peso, then a U.S. tourist traveling to Mexico will be very happy. In fact, the more overvalued the dollar is, the better. However, for an exporter of U.S. goods to Mexico, its price in peso terms will be higher the more overvalued is the dollar. Thus an overvalued dollar will likely reduce sales and profits for these U.S. firms.
Over- and Undervaluation with Respect to Current Account Balance
The second way over- and undervaluation is sometimes applied is in comparison to an exchange rate presumed necessary to induce trade balance, or balance on the current account. If one imagines that a trade deficit, for example, arises primarily because a country imports too much or exports too little (rather than being driven by financial decisions tending to cause a financial account surplus), then one may also look for ways to either reduce imports or raise exports. A change in the exchange rate offers one viable method to affect trade flows.
Suppose the United States has a trade deficit (which it indeed has had for more than thirty years prior to 2010). If the U.S. dollar value were to fall—a dollar depreciation—then foreign goods would all become relatively more expensive to U.S. residents, tending to reduce U.S. imports. At the same time, a dollar depreciation would also cause U.S. goods to become relatively cheaper to foreign residents tending to raise U.S. exports.
Sometimes economists make numerical estimations as to how much the dollar value would have to fall to bring trade into balance. These estimations are enormously difficult to make for several reasons and should be interpreted and used with great caution, if at all. The primary reason is that many different factors on both the trade side and the financial side influence a country’s trade imbalance besides just the exchange rate. The exchange rate that balances trade would depend on the values taken by all the other factors that also influence the trade balance. Different values for all the other variables would mean a different exchange rate needed to balance trade. Thus there isn’t one exchange rate value that will balance trade. Instead, there is a different exchange rate value that will balance trade in each and every alternative circumstance. Indeed, even the current exchange rate—whatever that is—can balance trade if other factors change appropriately.
Despite these cautions, many observers will still contend that a country’s currency needs to depreciate by some percentage to eliminate a trade deficit, or needs to appreciate to eliminate a trade surplus. When it is believed a depreciation of the currency is needed to balance trade, they will say the currency is overvalued. When it is believed an appreciation of the currency is needed to balance trade, they will say the currency is undervalued. However, in a floating exchange rate system, it is hard to argue that the exchange rate is at the “wrong” value since—with competition in the market—it will always be at the rate that equalizes supply and demand. In other words, the “proper” value for the exchange rate can be said to be not the one that will satisfy PPP or not the one that will generate trade balance but rather whatever rate currently prevails. Under this notion, a currency can never be over- or undervalued in a floating exchange rate system. Instead, the spot exchange rate is always at the “proper” value.
In a fixed exchange rate system, a government can sometimes intervene to maintain an exchange rate that is very different from what would arise if allowed to float. In these cases, large trade surpluses can arise because the government maintains an artificially low value for its currency. Calls for a revaluation (appreciation) of the currency, to promote a reduction in a trade surplus, are somewhat more appropriate in these cases since the market does not determine the exchange rate. Similarly, large deficits could be reduced with a devaluation (depreciation) of the currency.
Key Takeaways
- A currency can be overvalued or undervalued with respect to two reference values: (1) the value that would satisfy purchasing power parity (PPP) or (2) the value that would generate current account balance.
- Use of the terms overvaluation and undervaluation suggests that there is a “proper” value for the exchange rate. However, there are often valid reasons why exchange rates will not conform to PPP or why trade imbalances will persist.
- In a floating exchange rate system, the “proper” exchange rate can be said to be the rate that equalizes supply and demand for currencies in exchange. Under this notion, there can never be an over- or undervalued exchange rate.
Exercises
-
Use the information in the table below to answer the question, “Is the U.S. dollar overvalued or undervalued with respect to the Canadian dollar and the Japanese yen in terms of purchases of the Economist?” State why it is overvalued or undervalued. Show your work.
The Economist Price per Issue Exchange Rate (December 2, 1999) United States $3.95 − Canada C$4.95 1.47 C$/$ Japan ¥920 102 ¥/$ -
Use the information in the table below to answer the following questions:
Big Mac Price Exchange Rate (June 4, 1998) United States (dollar) $2.53 − South Korea (won) W 2,600 1,475 W/$ Israel (shekel) sh 12.50 3.70 sh/$ Poland (zloty) zl 5.30 3.46 zl/$ - Calculate whether the won, shekel, and zloty are overvalued or undervalued with respect to the U.S. dollar in terms of Big Mac purchases. Explain what it means to be overvalued or undervalued.
- What would the exchange rates have to be in order to equalize Big Mac prices between South Korea and the United States, Israel and the United States, and Poland and the United States?
- If in the long run the exchange rate moves to satisfy Big Mac purchasing power parity (PPP), will the won, shekel, and zloty appreciate or depreciate in terms of dollars? Explain the logic.
-
Use the information about the hourly wage for a high school principal and exchange rates to answer the following questions:
Wage Actual Exchange Rate PPP Exchange Rate United States $25/hour − − Mexico P220/hour 10.9 p/$ 7.5 p/$ Japan ¥3,000/hour 110 ¥/$ 132 ¥/$ - Calculate the hourly wage rate in dollars in Mexico and Japan using the actual exchange rates.
- Calculate the hourly wage rate in dollars in Mexico and Japan using the PPP exchange rates.
- Based on the information above, in which country is it best to be a high school principal? Which country is second best? Which is third best?
- In terms of PPP, is the U.S. dollar overvalued or undervalued with respect to the peso and with respect to the yen?
- According to the PPP theory, given the conditions above, would the dollar be expected to appreciate or depreciate with respect to the peso and with respect to the yen?
6.7 PPP and Cross-Country Comparisons
Learning Objective
- Learn why using PPP exchange rates to convert income data to a common currency is a better method for making cross-country comparisons.
Probably the most important application of purchasing power parity (PPP) exchange rates is in making cross-country comparisons of income, wages, or gross domestic product (GDP). Suppose that we would like to compare per capita GDP between two countries—say, the United States and China. In 2004, GDP in the United States was approximately $12 trillion; in China GDP was about ¥16 trillion. With a population in the United States of 290 million people, per capita U.S. GDP works out to $41,400 per person. China’s population was approximately 1.3 billion people in 2004, so its GDP per capita works out to 11,500 yuan (¥) per person. However, we can’t compare these two per capita figures since they are in different units—dollars and yuan. Thus we need to convert units, either turn dollars into yuan or yuan into dollars.
The simplest approach to make this conversion is to use the spot exchange rate that prevailed in 2004, which was 8.28 yuan per dollar. Converting yuan to dollars yields a per capita GDP for China of $1,390. Note that at $41,400 per person, U.S. per capita GDP was almost thirty times higher than China’s.
However, there is a problem using this method. One thing that is quickly recognized by Americans when they travel in and around China is that many goods and services seem considerably cheaper than they are in the United States. From a Chinese traveler’s perspective, many U.S. goods would seem considerably more expensive. The implication is that although U.S. GDP per person is thirty times higher, that income may not purchase thirty times more goods and services in the U.S. because the prices of U.S. goods and services are so much higher when converted at the current exchange rate. Since presumably we are comparing per capita GDPs to compare how “well-off” people are in one country relative to another, these per capita figures will not accurately reflect these differences.
A solution is found in the purchasing power parity theory (PPP). When prices for similar goods differ as described in the previous paragraph, we would say the U.S. dollar is overvalued with respect to the yuan and with respect to PPP. At the same time, we would say the yuan is undervalued vis-à-vis the dollar. One way to reach comparable (or equalized) values of goods and services between the countries is to apply the PPP exchange rate in the conversion. The PPP exchange rate is that exchange rate that would equalize the value of comparable market baskets of goods and services between two countries.
For example, the estimated PPP exchange rate between the U.S. dollar and yuan in 2004 was 1.85 ¥/$. If this exchange rate had prevailed between the countries, the prices of U.S. goods would seem, on average, to be approximately equal to the prices that prevailed in China. Now, if we use this exchange rate to make the conversion to dollars of GDP per capita in China, then we will get a number that reflects the purchasing power of Chinese income in terms of the prices that prevail in the United States—that is, in terms of prices that are equalized between the countries.
Thus if we take China’s GDP per capita of ¥11,500 and convert to dollars with the PPP exchange rate, we get $6,250 per person. The units derived in this expression would typically be called “international dollars.” What this means is that ¥11,500 will buy a bundle of goods and services in China that would cost $6,250 if purchased in the United States at U.S. prices. In other words, ¥11,500 is equal to $6,250 when the prices of goods and services are equalized between countries.
The PPP method of conversion is a much more accurate way of making cross-country comparisons of values between countries. In this example, although China’s per capita GDP was still considerably lower than in the United States ($6,250 vs. $41,400), it is nonetheless four and a half times higher than using the spot exchange rate ($6,250 vs. $1,390). The higher value takes account of the differences in prices between the countries and thus better reflects the differences in purchasing power of per capita GDP.
The PPP conversion method has become the standard method used by the World Bank and others in making cross-country comparisons of GDP, GDP per capita, and average incomes and wages. For most comparisons concerning the size of economies or standards of living, using PPP is a more accurate method and can fundamentally change our perception of how countries compare. To see how, consider Table 6.1 "GDP Rankings (in Billions of Dollars), 2008", constructed from World Bank data. It shows a ranking of the top ten countries in total GDP converting to dollars using both the current exchange rate method and the PPP method.
Table 6.1 GDP Rankings (in Billions of Dollars), 2008
| Rank | Country | Using Current Exchange Rate ($) | Country | Using PPP Exchange Rate ($) |
|---|---|---|---|---|
| 1 | United States | 14,204 | United States | 14,204 |
| 2 | Japan | 4,909 | China | 7,903 |
| 3 | China | 4,326 | Japan | 4,355 |
| 4 | Germany | 3,653 | India | 3,338 |
| 5 | France | 2,853 | Germany | 2,925 |
| 6 | United Kingdom | 2,646 | Russia | 2,288 |
| 7 | Italy | 2,293 | United Kingdom | 2,176 |
| 8 | Brazil | 1,613 | France | 2,112 |
| 9 | Russia | 1,608 | Brazil | 1,977 |
| 10 | Spain | 1,604 | Italy | 1,841 |
| 11 | Canada | 1,400 | Mexico | 1,542 |
| 12 | India | 1,217 | Spain | 1,456 |
The United States remains at the top of the list using both methods. However, several countries rise up in the rankings. China rises from the third largest economy using current exchange rates to the second largest using PPP. This means that in terms of the physical goods and services produced by the economies, China really does produce more than Japan. PPP conversion gives a better representation of the relative sizes of these countries.
Similarly, India rises from twelfth rank to fourth. Russia also moves up into sixth place from ninth. At the same time, Japan, Germany, the United Kingdom, France, Italy, Brazil, and Spain all move down in the rankings. Canada moves out of the top twelve, being replaced by Mexico, which rises up to eleventh.
For those countries whose GDP rises in value when converting by PPP (i.e., China, India, and Russia), their currencies are undervalued with respect to the U.S. dollar. So using the current exchange rate method underestimates the true size of their economies. For the other countries, their currencies are overvalued to the dollar, so converting their GDPs at current exchange rates gives an overestimate of the true size of their economies.
Key Takeaways
- Using purchasing power parity (PPP) exchange rates to convert income data to a common currency is a better way to make international comparisons because it compensates for the differential costs of living.
- “International dollars” is the term used for the units for data converted to U.S. dollars using the PPP exchange rate.
- International rankings can vary significantly between data converted using actual versus PPP exchange rates.
Exercises
-
In February 2004, the Mexican peso–U.S. dollar exchange rate was 11 p/$. The price of a hotel room in Mexico City was 1,000 pesos. The price of a hotel room in New York City was $200.
- Calculate the price of the Mexican hotel room in terms of U.S. dollars.
- Calculate the price of the U.S. hotel room in terms of Mexican pesos.
- Now suppose the exchange rate rises to 12 p/$. What does the exchange rate change indicate has happened to the value of the U.S. dollar relative to the value of the Mexican peso?
- Does the currency change benefit the U.S. tourist traveling to Mexico City or the Mexican tourist traveling to New York City? Explain why.
- In 2008, Brazil’s per capita income in nominal terms was $8,295 while its per capita income in purchasing power parity (PPP) terms was $10,466. Based on this information, if you were an American traveling in Brazil, would Brazilian products seem expensive or inexpensive relative to U.S. products?
- In 2008, Germany’s per capita income in nominal terms was $44,729 while its per capita income in PPP terms was $35,539. Based on this information, if you were a German traveling in the United States, would U.S. products seem expensive or inexpensive relative to German products?