This is “Introductory Finance Issues: Current Patterns, Past History, and International Institutions”, chapter 1 from the book Policy and Theory of International Finance (v. 1.0). For details on it (including licensing), click here.
For more information on the source of this book, or why it is available for free, please see the project's home page. You can browse or download additional books there. To download a .zip file containing this book to use offline, simply click here.


Chapter 1 Introductory Finance Issues: Current Patterns, Past History, and International Institutions
Economics is a social science whose purpose is to understand the workings of the real-world economy. An economy is something that no one person can observe in its entirety. We are all a part of the economy, we all buy and sell things daily, but we cannot observe all parts and aspects of an economy at any one time.
For this reason, economists build mathematical models, or theories, meant to describe different aspects of the real world. For some students, economics seems to be all about these models and theories, these abstract equations and diagrams. However, in actuality, economics is about the real world, the world we all live in.
For this reason, it is important in any economics course to describe the conditions in the real world before diving into the theory intended to explain them. In this case, in a textbook about international finance, it is very useful for a student to know some of the values of important macroeconomic variables, the trends in these variables over time, and the policy issues and controversies surrounding them.
This first chapter provides an overview of the real world with respect to international finance. It explains not only how things look now but also where we have been and why things changed along the way. It describes current economic conditions and past trends with respect to the most critical international macroeconomic indicators. In particular, it compares the most recent worldwide economic recession with past business cycle activity to put our current situation into perspective. The chapter also discusses important institutions and explains why they have been created.
With this overview about international finance in the real world in mind, a student can better understand why the theories and models in the later chapters are being developed. This chapter lays the groundwork for everything else that follows.
1.1 The International Economy and International Economics
Learning Objectives
- Learn past trends in international trade and foreign investment.
- Learn the distinction between international trade and international finance.
International economics is growing in importance as a field of study because of the rapid integration of international economic markets. Increasingly, businesses, consumers, and governments realize that their lives are affected not only by what goes on in their own town, state, or country but also by what is happening around the world. Consumers can walk into their local shops today and buy goods and services from all over the world. Local businesses must compete with these foreign products. However, many of these same businesses also have new opportunities to expand their markets by selling to a multitude of consumers in other countries. The advance of telecommunications is also rapidly reducing the cost of providing services internationally, while the Internet will assuredly change the nature of many products and services as it expands markets even further.
One simple way to see the rising importance of international economics is to look at the growth of exports in the world during the past fifty or more years. Figure 1.1 "World Exports, 1948–2008 (in Billions of U.S. Dollars)" shows the overall annual exports measured in billions of U.S. dollars from 1948 to 2008. Recognizing that one country’s exports are another country’s imports, one can see the exponential growth in outflows and inflows during the past fifty years.
Figure 1.1 World Exports, 1948–2008 (in Billions of U.S. Dollars)

Source: World Trade Organization, International trade and tariff data, http://www.wto.org/english/res_e/statis_e/statis_e.htm.
However, rapid growth in the value of exports does not necessarily indicate that trade is becoming more important. A better method is to look at the share of traded goods in relation to the size of the world economy. Figure 1.2 "World Exports, 1970–2008 (Percentage of World GDP)" shows world exports as a percentage of the world gross domestic product (GDP) for the years 1970 to 2008. It shows a steady increase in trade as a share of the size of the world economy. World exports grew from just over 10 percent of the GDP in 1970 to over 30 percent by 2008. Thus trade is not only rising rapidly in absolute terms; it is becoming relatively more important too.
Figure 1.2 World Exports, 1970–2008 (Percentage of World GDP)
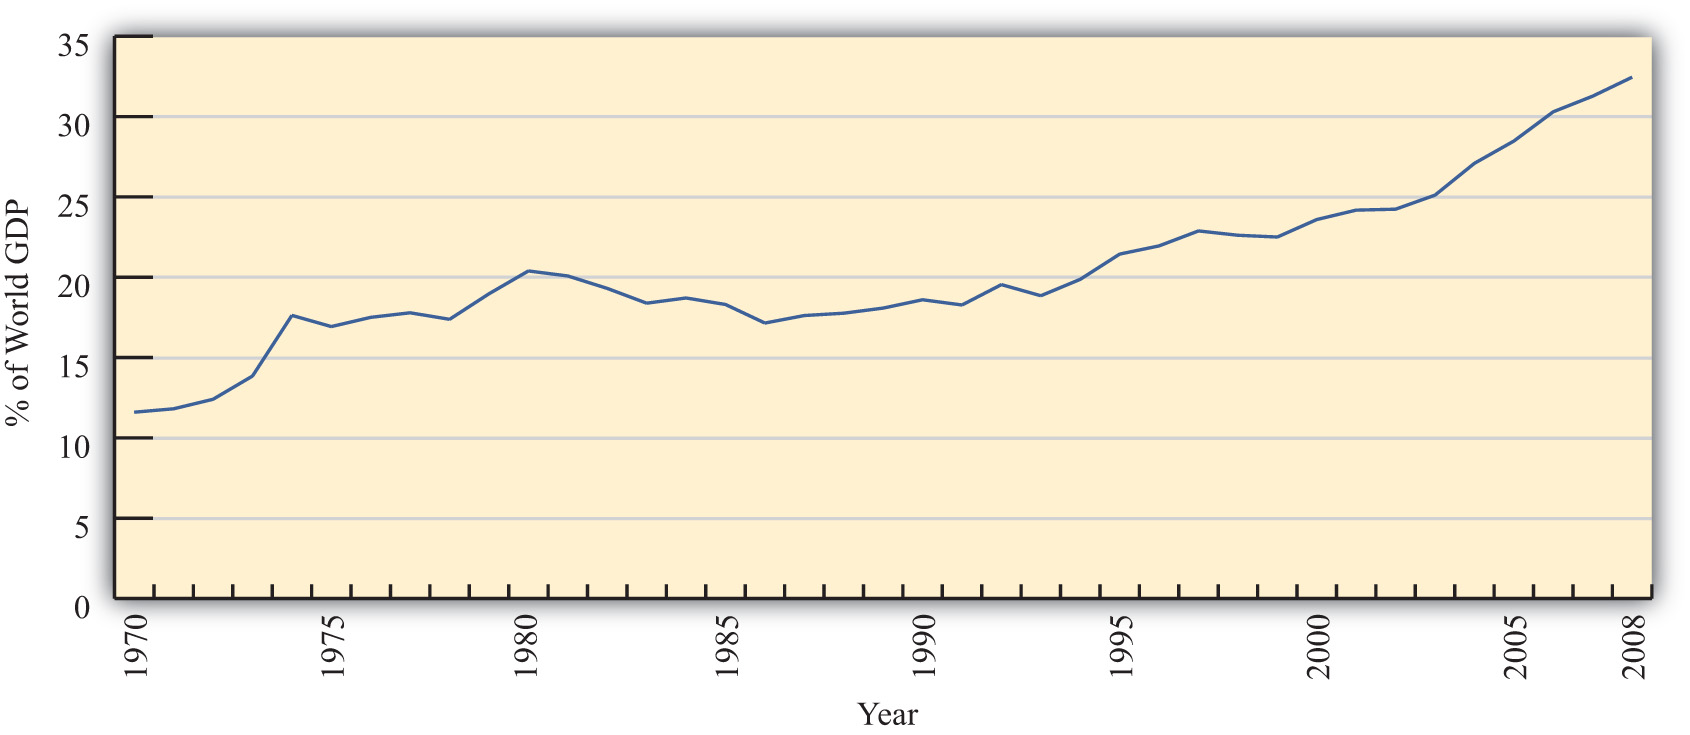
Source: IMF World Economic Outlook Database, http://www.imf.org/external/pubs/ft/weo/2009/02/weodata/index.aspx.
One other indicator of world interconnectedness can be seen in changes in the amount of foreign direct investment (FDI). FDI is foreign ownership of productive activities and thus is another way in which foreign economic influence can affect a country. Figure 1.3 "World Inward FDI Stocks, 1980–2007 (Percentage of World GDP)" shows the stock, or the sum total value, of FDI around the world taken as a percentage of the world GDP between 1980 and 2007. It gives an indication of the importance of foreign ownership and influence around the world. As can be seen, the share of FDI has grown dramatically from around 5 percent of the world GDP in 1980 to over 25 percent of the GDP just twenty-five years later.
Figure 1.3 World Inward FDI Stocks, 1980–2007 (Percentage of World GDP)
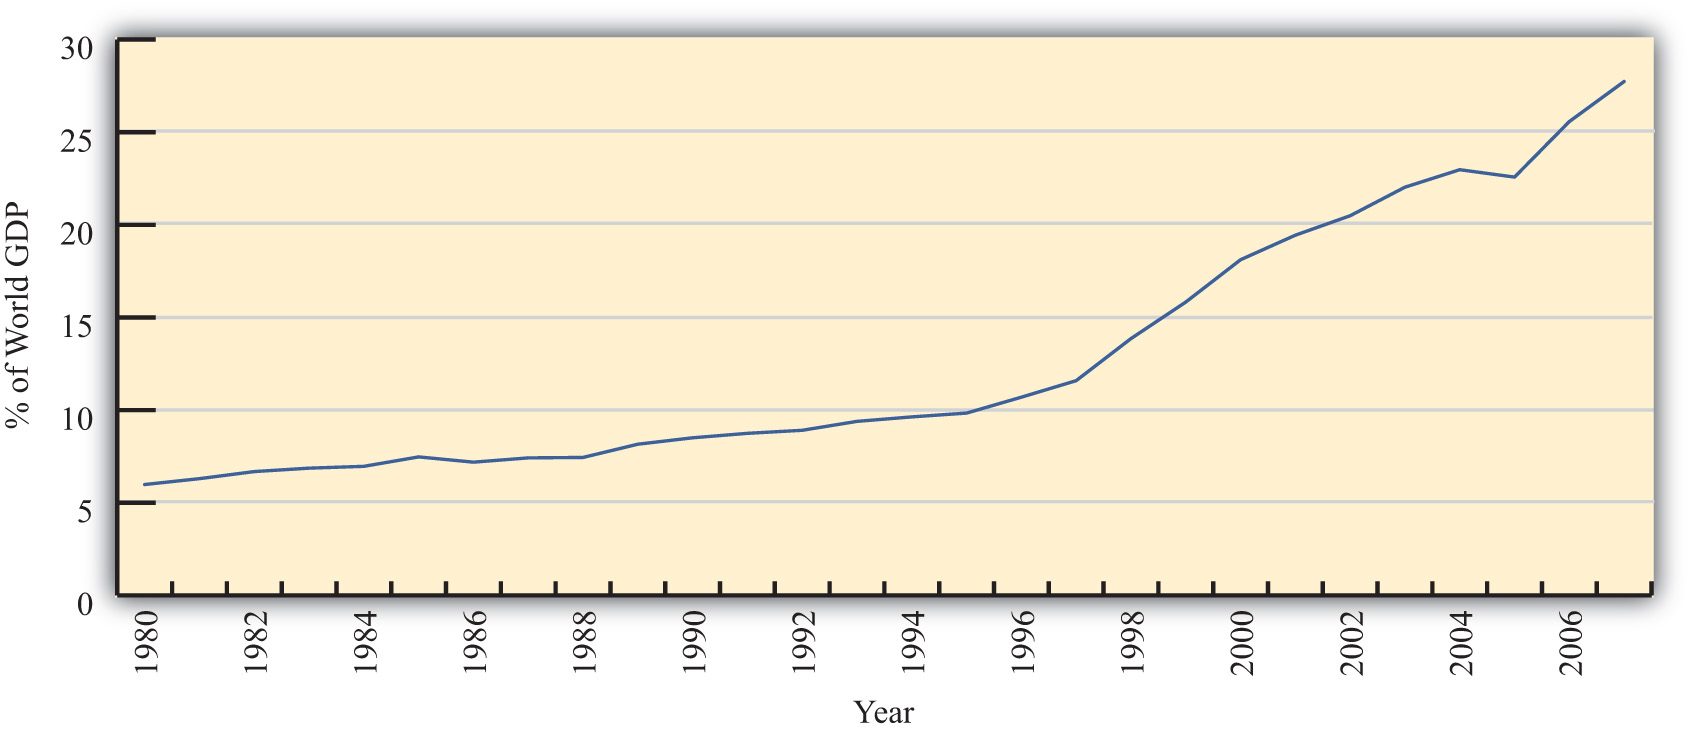
Source: IMF World Economic Outlook Database, http://www.imf.org/external/pubs/ft/weo/2009/02/weodata/index.aspx; UNCTAD, FDI Statistics: Division on Investment and Enterprise, http://www.unctad.org/Templates/Page.asp?intItemID=4979&lang=1.
The growth of international trade and investment has been stimulated partly by the steady decline of trade barriers since the Great Depression of the 1930s. In the post–World War II era, the General Agreement on Tariffs and TradeAn international agreement among countries, established in 1948, promoting trade liberalization through the reduction of tariff rates and other barriers to trade until its conversion to the WTO in 1995., or GATT, prompted regular negotiations among a growing body of members to reciprocally reduce tariffs (import taxes) on imported goods. During each of these regular negotiations (eight of these rounds were completed between 1948 and 1994), countries promised to reduce their tariffs on imports in exchange for concessions—that means tariff reductions—by other GATT members. When the Uruguay RoundThe eighth and last round of GATT trade liberalization negotiations that substantially expanded the number and scope of trade liberalization agreements and established the WTO., the most recently completed round, was finalized in 1994, the member countries succeeded in extending the agreement to include liberalization promises in a much larger sphere of influence. Now countries not only would lower tariffs on goods trade but also would begin to liberalize the agriculture and services markets. They would eliminate the many quota systems—like the multifiber agreement in clothing—that had sprouted up in previous decades. And they would agree to adhere to certain minimum standards to protect intellectual property rights such as patents, trademarks, and copyrights. The World Trade Organization (WTO)An international agency whose purpose is to monitor and enforce the Uruguay Round trade liberalization agreements and to promote continuing liberalizing initiatives with continuing rounds of negotiation. was created to manage this system of new agreements, to provide a forum for regular discussion of trade matters, and to implement a well-defined process for settling trade disputes that might arise among countries.
As of 2009, 153 countries were members of the WTO “trade liberalization club,” and many more countries were still negotiating entry. As the club grows to include more members—and if the latest round of trade liberalization talks, called the Doha Round, concludes with an agreement—world markets will become increasingly open to trade and investment.Note that the Doha Round of discussions was begun in 2001 and remains uncompleted as of 2009.
Another international push for trade liberalization has come in the form of regional free trade agreements. Over two hundred regional trade agreements around the world have been notified, or announced, to the WTO. Many countries have negotiated these agreements with neighboring countries or major trading partners to promote even faster trade liberalization. In part, these have arisen because of the slow, plodding pace of liberalization under the GATT/WTO. In part, the regional trade agreements have occurred because countries have wished to promote interdependence and connectedness with important economic or strategic trade partners. In any case, the phenomenon serves to open international markets even further than achieved in the WTO.
These changes in economic patterns and the trend toward ever-increasing openness are an important aspect of the more exhaustive phenomenon known as globalization. Globalization more formally refers to the economic, social, cultural, or environmental changes that tend to interconnect peoples around the world. Since the economic aspects of globalization are certainly the most pervasive of these changes, it is increasingly important to understand the implications of a global marketplace on consumers, businesses, and governments. That is where the study of international economics begins.
What Is International Economics?
International economics is a field of study that assesses the implications of international trade, international investment, and international borrowing and lending. There are two broad subfields within the discipline: international trade and international finance.
International trade is a field in economics that applies microeconomic models to help understand the international economy. Its content includes basic supply-and-demand analysis of international markets; firm and consumer behavior; perfectly competitive, oligopolistic, and monopolistic market structures; and the effects of market distortions. The typical course describes economic relationships among consumers, firms, factory owners, and the government.
The objective of an international trade course is to understand the effects of international trade on individuals and businesses and the effects of changes in trade policies and other economic conditions. The course develops arguments that support a free trade policy as well as arguments that support various types of protectionist policies. By the end of the course, students should better understand the centuries-old controversy between free trade and protectionism.
International finance applies macroeconomic models to help understand the international economy. Its focus is on the interrelationships among aggregate economic variables such as GDP, unemployment rates, inflation rates, trade balances, exchange rates, interest rates, and so on. This field expands basic macroeconomics to include international exchanges. Its focus is on the significance of trade imbalances, the determinants of exchange rates, and the aggregate effects of government monetary and fiscal policies. The pros and cons of fixed versus floating exchange rate systems are among the important issues addressed.
This international trade textbook begins in this chapter by discussing current and past issues and controversies relating to microeconomic trends and policies. We will highlight past trends both in implementing policies that restrict trade and in forging agreements to reduce trade barriers. It is these real-world issues that make the theory of international trade worth studying.
Key Takeaways
- International trade and investment flows have grown dramatically and consistently during the past half century.
- International trade is a field in economics that applies microeconomic models to help understand the international economy.
- International finance focuses on the interrelationships among aggregate economic variables such as GDP, unemployment, inflation, trade balances, exchange rates, and so on.
Exercise
-
Jeopardy Questions. As in the popular television game show, you are given an answer to a question and you must respond with the question. For example, if the answer is “a tax on imports,” then the correct question is “What is a tariff?”
- The approximate share of world exports as a percentage of world GDP in 2008.
- The approximate share of world foreign direct investment as a percentage of world GDP in 1980.
- The number of countries that were members of the WTO in 2009.
- This branch of international economics applies microeconomic models to understand the international economy.
- This branch of international economics applies macroeconomic models to understand the international economy.
1.2 GDP, Unemployment, Inflation, and Government Budget Balances
Learning Objective
- Learn current values for several important macroeconomic indicators from a selected set of countries, including GDP, GDP per capita, unemployment rates, inflation rates, national budget balances, and national debts.
When someone reads the business and economics news it is common to see numerous values and figures used to describe the economic situation somewhere. For example, if you read a story about the Philippines you might read that the gross domestic product (GDP) is $167 billion or that the GDP per person is $3,500 per person, or that its unemployment rate is 7.1 percent and its inflation rate is now 2.8 percent. You might read that it has a government budget deficit of 3.7 percent of the GDP and a trade deficit of 5.2 percent of the GDP. But what does this all mean? How is someone supposed to interpret and understand whether the numbers indicate something good, bad, or neutral about the country?
One way to make judgments is to compare these numbers with other countries. To this end, the next few sections will present some recent data for a selected set of countries. Although memorizing these numbers is not so important, especially since they will all soon change, it is helpful to have an idea about what the values are for a few countries; or if not that, to know the approximate normal average for a particular variable. Thus it is useful to know that GDP per person ranges from about $500 per year at the low end to about $50,000 to $75,000 per person at the high end. It is also useful to know that unemployment rates are normally less than 10 percent. So when you read that Zimbabwe recently had unemployment of 75 percent, a reader will know how unusually large that is. Once you also recognize that inflation rates are normally less than 10 percent, a rate of 10,000 percent will strike you as extraordinary.
Thus the values for some of these numbers will be helpful to make comparisons across countries today and to make comparisons over time for a particular country. Therefore, it can be very helpful to know the numbers for at least a few countries, or what may be deemed a set of reference countries. The countries in Table 1.1 "GDP and GDP per Capita (PPP in Billions of Dollars), 2009" were selected to provide a cross section of countries at different levels of economic development. Thus the United States, the European Union, and Japan represent the largest economies in the world today. Meanwhile, countries like Brazil, Russia, India, and China are watched so closely today that they have acquired their own acronym: the BRIC countries. Finally, countries like Indonesia, Kenya, Ghana, and Burundi are among the poorest nations of the world. Note that in later tables other countries were substituted for the African countries because data are less difficult to obtain.
Gross Domestic Product around the World
Macroeconomics is the study of the interrelationships of aggregate economic variables. The most important of these, without question, is a country’s gross domestic product (GDP)Measures the total value of all goods and services produced by a country during a year.. GDP measures the total value of all goods and services produced by a country during a year. As such, it is a measure of the extent of economic activity in a country or the economic size of a country.
And because the consumption of goods and services is one way to measure an individual’s economic well-being, it is easy to calculate the GDP per capita (i.e., per person) to indicate the average well-being of individuals in a country.
Details about how to measure and interpret GDP follow in subsequent chapters, but before doing so, it makes some sense to know a little about how economy size and GDP per person vary across countries around the world. Which are the biggest countries, and which are the smallest? Which countries provide more goods and services, on average, and which produce less? And how wide are the differences between countries? Table 1.1 "GDP and GDP per Capita (PPP in Billions of Dollars), 2009" provides recent information for a selected group of countries. Note that reported numbers are based on purchasing power parity (PPP), which is a better way to make cross-country comparisons and is explained later. A convenient source of the most recent comprehensive data from three sources (the International Monetary Fund [IMF], the World Bank, and the U.S. CIA) of GDP (http://en.wikipedia.org/wiki/List_of_countries_by_GDP_%28PPP%29) and GDP per person (http://en.wikipedia.org/wiki/List_of_countries_by_GDP_%28PPP%29_per_capita) is available at Wikipedia.
Table 1.1 GDP and GDP per Capita (PPP in Billions of Dollars), 2009
| Country/Region (Rank) | GDP (Percentage in the World) | GDP per Capita (Rank) |
|---|---|---|
| World | 68,997 (100) | 10,433 |
| European Union (1) | 15,247 (22.1) | — |
| United States (2) | 14,265 (20.7) | 47,440 (6) |
| China (3) | 7,916 (11.5) | 5,970 (100) |
| Japan (4) | 4,354 (6.3) | 34,116 (24) |
| India (5) | 3,288 (4.8) | 2,780 (130) |
| Russia (7) | 2,260 (3.3) | 15,948 (52) |
| Brazil (10) | 1,981 (2.9) | 10,466 (77) |
| South Korea (14) | 1,342 (1.9) | 27,692 (33) |
| Indonesia (17) | 908 (1.3) | 3,980 (121) |
| Kenya (82) | 60 (nil) | 1,712 (148) |
| Ghana (96) | 34 (nil) | 1,518 (152) |
| Burundi (158) | 3 (nil) | 390 (178) |
Table 1.1 "GDP and GDP per Capita (PPP in Billions of Dollars), 2009" displays several things that are worth knowing. First, note that the United States and European Union each make up about one-fifth of the world economy; together the two are 42 percent. Throw Japan into the mix with the European Union and the United States and together they make up less than one-sixth of the world’s population. However, these three developed nations produce almost one-half of the total world production. This is a testament to the high productivity in the developed regions of the world. It is also a testament to the low productivity in much of the rest of the world, where it takes another five billion people to produce the remaining half of the GDP.
The second thing worth recognizing is the wide dispersion of GDPs per capita across countries. The United States ranks sixth in the world at $47,440 and is surpassed by several small countries like Singapore and Luxembourg and/or those with substantial oil and gas resources such as Brunei, Norway, and Qatar (not shown in Table 1.1 "GDP and GDP per Capita (PPP in Billions of Dollars), 2009"). Average GDP per capita in the world is just over $10,000, and it is just as remarkable how far above the average some countries like the United States, Japan, and South Korea are as it is how far below the average other countries like China, India, Indonesia, and Kenya are. Perhaps most distressing is the situation of some countries like Burundi that has a GDP of only $370 per person. (Other countries in a similar situation include Zimbabwe, Congo, Liberia, Sierra Leone, Niger, and Afghanistan.)
Unemployment and Inflation around the World
Two other key macroeconomic variables that are used as an indicator of the health of a national economy are the unemployment rateThe percentage of the labor force that is currently not employed. and the inflation rateThe rate of change in the general level of prices in an economy. Alternatively, the percentage change in the consumer price index over a period.. The unemployment rate measures the percentage of the working population in a country who would like to be working but are currently unemployed. The lower the rate, the healthier the economy and vice versa. The inflation rate measures the annual rate of increase of the consumer price index (CPI). The CPI is a ratio that measures how much a set of goods costs this period relative to the cost of the same set of goods in some initial year. Thus if the CPI registers 107, it would cost $107 (euros or whatever is the national currency) to buy the goods today, while it would have cost just $100 to purchase the same goods in the initial period. This represents a 7 percent increase in average prices over the period, and if that period were a year, it would correspond to the annual inflation rate. In general, a relatively moderate inflation rate (about 0–4 percent) is deemed acceptable; however, if inflation is too high it usually contributes to a less effective functioning of an economy. Also, if inflation is negative, it is called deflation, and that can also contribute to an economic slowdown.
Table 1.2 Unemployment and Inflation Rates
| Country/Region | Unemployment Rate (%) | Inflation Rate (%) |
|---|---|---|
| European Union | 9.8 (Oct. 2009) | +0.5 (Nov. 2009) |
| United States | 10.0 (Nov. 2009) | +1.8 (Nov. 2009) |
| China | 9.2 (2008) | +0.6 (Nov. 2009) |
| Japan | 5.1 (Oct. 2009) | −2.5 (Oct. 2009) |
| India | 9.1 (2008) | +11.5 (Oct. 2009) |
| Russia | 7.7 (Oct. 2009) | +9.1 (Nov. 2009) |
| Brazil | 7.5 (Oct. 2009) | +4.2 (Nov. 2009) |
| South Korea | 3.5 (Nov. 2009) | +2.4 (Nov. 2009) |
| Indonesia | 8.1 (Feb. 2009) | +2.4 (Oct. 2009) |
| Spain | 19.3 (Oct. 2009) | +0.3 (Nov. 2009) |
| South Africa | 24.5 (Sep. 2009) | +5.8 (Nov. 2009) |
| Estonia | 15.2 (Jul. 2009) | −2.1 (Nov. 2009) |
Source: Economist, Weekly Indicators, December 17, 2009.
The unemployment rates and inflation rates in most countries are unusual in the reported period because of the economic crisis that hit the world in 2008. The immediate effect of the crisis was a drop in demand for many goods and services, a contraction in GDP, and the loss of jobs for workers in many industries. In addition, prices were either stable or fell in many instances. When most economies of the world were booming several years earlier, a normal unemployment rate would have been 3 to 5 percent, while a normal inflation rate would stand at about 3 to 6 percent.
As Table 1.2 "Unemployment and Inflation Rates" shows, though, unemployment rates in most countries in 2009 are much higher than that, while inflation rates tend to be lower with several exceptions. In the United States, the unemployment rate has more than doubled, but in the European Union, unemployment was at a higher rate than the United States before the crisis hit, and so it has not risen quite as much. Several standouts in unemployment are Spain and South Africa. These are exceedingly high rates coming very close to the United States unemployment rate of 25 percent reached during the Great Depression in 1933.
India’s inflation rate is the highest of the group listed but is not much different from inflation in India the year before of 10.4 percent. Russia’s inflation this year has actually fallen from its rate last year of 13.2 percent. Japan and Estonia, two countries in the list, are reporting deflation this year. Japan had inflation of 1.7 percent in the previous year, whereas Estonia’s rate had been 8 percent.
Government Budget Balances around the World
Another factor that is often considered in assessing the health of an economy is the state of the country’s government budget. Governments collect tax revenue from individuals and businesses and use that money to finance the purchase of government provided goods and services. Some of the spending is on public goods such as national defense, health care, and police and fire protection. The government also transfers money from those better able to pay to others who are disadvantaged, such as welfare recipients or the elderly under social insurance programs.
Generally, if government were to collect more in tax revenue than it spent on programs and transfers, then it would be running a government budget surplusWhen total tax revenue by a government exceeds its total expenditures during a year. and there would be little cause for concern. However, many governments oftentimes tend to spend and transfer more than they collect in tax revenue. In this case, they run a government budget deficitWhen total expenditures by a government exceed its total tax revenue collections during a year. that needs to be paid for or financed in some manner. There are two ways to cover a budget deficit. First, the government can issue Treasury bills and bonds and thus borrow money from the private market; second, the government can sometimes print additional money. If borrowing occurs, the funds become unavailable to finance private investment or consumption, and thus the situation represents a substitution of public spending for private spending. Borrowed funds must also be paid back with accrued interest, which implies that larger future taxes will have to be collected assuming that budget balance or a surplus is eventually achieved.
When governments borrow, they will issue Treasury bonds with varying maturities. Thus some will be paid back in one of two years, but others perhaps not for thirty years. In the meantime, the total outstanding balance of IOUs (i.e., I owe you) that the government must pay back in the future is called the national debtThe total value of government debt outstanding at a point in time. Alternatively, the sum total face value of government bonds that have been sold but not yet redeemed.. This debt is owed to whoever has purchased the Treasury bonds; for many countries, a substantial amount is purchased by domestic citizens, meaning that the country borrows from itself and thus must pay back its own citizens in the future. The national debt is often confused with a nation’s international indebtedness to the rest of the world, which is known as its international investment position (defined in the next section).
Excessive borrowing by a government can cause economic difficulties. Sometimes private lenders worry that the government may become insolvent (i.e., unable to repay its debts) in the future. In this case, creditors may demand a higher interest rate to compensate for the higher perceived risk. To prevent that risk, governments sometimes revert to the printing of money to reduce borrowing needs. However, excessive money expansion is invariably inflationary and can cause long-term damage to the economy.
In Table 1.3 "Budget Balance and National Debt (Percentage of GDP), 2009", we present budget balances for a selected set of countries. Each is shown as a percentage of GDP, which gives a more accurate portrayal of the relative size. Although there is no absolute number above which a budget deficit or a national debt is unsustainable, budget deficits greater than 5 percent per year, those that are persistent over a long period, or a national debt greater than 50 percent of GDP tends to raise concerns among investors.
Table 1.3 Budget Balance and National Debt (Percentage of GDP), 2009
| Country/Region | Budget Balance (%) | National Debt (%) |
|---|---|---|
| European Union | −6.5 | — |
| United States | −11.9 | 37.5 |
| China | −3.4 | 15.6 |
| Japan | −7.7 | 172.1 |
| India | −8.0 | 56.4 |
| Russia | −8.0 | 6.5 |
| Brazil | −3.2 | 38.8 |
| South Korea | −4.5 | 24.4 |
| Indonesia | −2.6 | 29.3 |
| Spain | −10.8 | 40.7 |
| South Africa | −5.0 | 31.6 |
| Estonia | −4.0 | 4.8 |
Source: Economist, Weekly Indicators, December 17, 2009, and the CIA World Factbook.
Note that all the budget balances for this selected set of countries are in deficit. For many countries, the deficits are very large, exceeding 10 percent in the U.S. and Spain. Although deficits for most countries are common, usually they are below 5 percent of the GDP. The reason for the higher deficits now is because most countries have increased their government spending to counteract the economic recession, while at the same time suffering a reduction in tax revenues also because of the recession. Thus budget deficits have ballooned around the world, though to differing degrees.
As budget deficits rise and as GDP falls due to the recession, national debts as a percent of GDP are also on the rise in most countries. In the United States, the national debt is still at a modest 37.5 percent, but recent projections suggest that in a few years it may quickly rise to 60 percent or 70 percent of the GDP. Note also that these figures subtract any debt issued by the government and purchased by another branch of the government. For example, in the United States for the past decade or more, the Social Security system has collected more in payroll taxes than it pays out in benefits. The surplus, known as the Social Security “trust fund,” is good because in the next few decades as the baby boom generation retires, the numbers of Social Security recipients is expected to balloon. But for now the surplus is used to purchase government Treasury bonds. In other words, the Social Security administration lends money to the rest of the government. Those loans currently sum to about 30 percent of GDP or somewhat over $4 trillion. If we include these loans as a part of the national debt, the United States debt is now, according to the online national debt clock, more than $12 trillion or about 85 percent of GDP. (This is larger than 37.5 + 30 percent because the debt clock is an estimate of more recent figures and reflects the extremely large government budget deficit run in the previous year.)
Most other countries’ debts are on a par with that of the U.S. with two notable exceptions. First, China and Russia’s debts are fairly modest at only 15.6 percent and 6.5 percent of GDP, respectively. Second, Japan’s national debt is an astounding 172 percent of GDP. It has arisen because the Japanese government has tried to extricate its economy from an economic funk by spending and borrowing over the past two decades.
Key Takeaways
- GDP and GDP per capita are two of the most widely tracked indicators of both the size of national economies and an economy’s capacity to provide for its citizens.
- In general, we consider an economy more successful if its GDP per capita is high, unemployment rate is low (3–5 percent), inflation rate is low and nonnegative (0–6 percent), government budget deficit is low (less than 5 percent of GDP) or in surplus, and its national debt is low (less than 25 percent).
-
The United States, as the largest national economy in the world, is a good reference point for comparing macroeconomic data.
- The U.S. GDP in 2008 stood at just over $14 trillion while per capita GDP stood at $47,000. U.S. GDP made up just over 20 percent of world GDP in 2008.
- The U.S. unemployment rate was unusually high at 10 percent in November 2009 while its inflation rate was very low at 1.8 percent.
- The U.S. government budget deficit was at an unusually high level of 11.9 percent of GDP in 2009 while its international indebtedness made it a debtor nation in the amount of 37 percent of its GDP.
-
Several noteworthy statistics are presented in this section:
- Average world GDP per person stands at around $10,000 per person.
- The GDP in the U.S. and most developed countries rises as high as $50,000 per person.
- The GDP in the poorest countries like Kenya, Ghana, and Burundi is less than $2,000 per person per year.
- U.S. unemployment has risen to a very high level of 10 percent; however, in Spain it sits over 19 percent, while in South Africa it is over 24 percent.
- Inflation is relatively low in most countries but stands at over 9 percent in Russia and over 11 percent in India. In several countries like Japan and Estonia, deflation is occurring.
- Due to the world recession, budget deficits have grown larger in most countries, reaching almost 12 percent of GDP in the United States.
- The national debts of countries are also growing larger, and Japan’s has grown to over 170 percent of GDP.
Exercises
-
Jeopardy Questions. As in the popular television game show, you are given an answer to a question and you must respond with the question. For example, if the answer is “a tax on imports,” then the correct question is “What is a tariff?”
- The approximate value of world GDP in 2008.
- The approximate value of EU GDP in 2008.
- The approximate value of U.S. GDP in 2008.
- The approximate value of world GDP per capita in 2008.
- The approximate value of EU GDP per capita in 2008.
- The approximate value of U.S. GDP per capita in 2008.
- The approximate value of South Africa’s unemployment rate in 2009.
- The approximate value of India’s inflation rate in 2009.
- The approximate value of the U.S. budget balance as a percentage of its GDP in 2009.
- The approximate value of Japan’s national debt as a percentage of its GDP in 2009.
- Use the information in Table 1.1 "GDP and GDP per Capita (PPP in Billions of Dollars), 2009" and Table 1.3 "Budget Balance and National Debt (Percentage of GDP), 2009" to calculate the dollar values of the government budget balance and the national debt for Japan, China, Russia, South Korea, and Indonesia.
1.3 Exchange Rate Regimes, Trade Balances, and Investment Positions
Learning Objective
- Learn current values for several important international macroeconomic indicators from a selected set of countries, including the trade balance, the international investment position, and exchange rate systems.
Countries interact with each other in two important ways: trade and investment. Trade encompasses the export and import of goods and services. Investment involves the borrowing and lending of money and the foreign ownership of property and stock within a country. The most important international macroeconomic variables, then, are the trade balance, which measures the difference between the total value of exports and the total value of imports, and the exchange rate, which measures the number of units of one currency that exchanges for one unit of another currency.
Exchange Rate Regimes
Because countries use different national currencies, international trade and investment requires an exchange of currency. To buy something in another country, one must first exchange one’s national currency for another. Governments must decide not only how to issue its currency but how international transactions will be conducted. For example, under a traditional gold standard, a country sets a price for gold (say $20 per ounce) and then issues currency such that the amount in circulation is equivalent to the value of gold held in reserve. In this way, money is “backed” by gold because individuals are allowed to convert currency to gold on demand.
Today’s currencies are not backed by gold; instead most countries have a central bank that issues an amount of currency that will be adequate to maintain a vibrant growing economy with low inflation and low unemployment. A central bank’s ability to achieve these goals is often limited, especially in turbulent economic times, and this makes monetary policy contentious in most countries.
One of the decisions a country must make with respect to its currency is whether to fix its exchange value and try to maintain it for an extended period, or whether to allow its value to float or fluctuate according to market conditions. Throughout history, fixed exchange ratesAn exchange rate system in which the rate is fixed at a specified value by the government. have been the norm, especially because of the long period that countries maintained a gold standard (with currency fixed to gold) and because of the fixed exchange rate system (called the Bretton Woods system) after World War II. However, since 1973, when the Bretton Woods system collapsed, countries have pursued a variety of different exchange rate mechanisms.
The International Monetary Fund (IMF), created to monitor and assist countries with international payments problems, maintains a list of country currency regimes. The list displays a wide variety of systems currently being used. The continuing existence of so much variety demonstrates that the key question, “Which is the most suitable currency system?” remains largely unanswered. Different countries have chosen differently. Later, this course will explain what is necessary to maintain a fixed exchange rate or floating exchange rateAn exchange rate system in which the rate fluctuates, or floats, because it is determined by supply and demand in the private market. system and what are some of the pros and cons of each regime. For now, though, it is useful to recognize the varieties of regimes around the world.
Table 1.4 Exchange Rate Regimes
| Country/Region | Regime |
|---|---|
| Euro Area | Single currency within: floating externally |
| United States | Float |
| China | Crawling peg |
| Japan | Float |
| India | Managed float |
| Russia | Fixed to composite |
| Brazil | Float |
| South Korea | Float |
| Indonesia | Managed float |
| Spain | Euro zone; fixed in the European Union; float externally |
| South Africa | Float |
| Estonia | Currency board |
Source: International Monetary Fund, De Facto Classification of Exchange Rate Regimes and Monetary Policy Framework, 2008.
Table 1.4 "Exchange Rate Regimes" shows the selected set of countries followed by a currency regime. Notice that many currencies—including the U.S. dollar, the Japanese yen, the Brazilian real, the South Korean won, and the South African rand—are independently floating, meaning that their exchange values are determined in the private market on the basis of supply and demand. Because supply and demand for currencies fluctuate over time, so do the exchange values, which is why the system is called floating.
Note that India and Indonesia are classified as “managed floating.” This means that the countries’ central banks will sometimes allow the currency to float freely, but at other times will nudge the exchange rate in one direction or another.
China is listed and maintaining a crawling peg, which means that the currency is essentially fixed except that the Chinese central bank is allowing its currency to appreciate slowly with respect to the U.S. dollar. In other words, the fixed rate itself is gradually but unpredictably adjusted.
Estonia is listed as having a currency board. This is a method of maintaining a fixed exchange rate by essentially eliminating the central bank in favor of a currency board that is mandated by law to follow procedures that will automatically keep its currency fixed in value.
Russia is listed as fixing to a composite currency. This means that instead of fixing to one other currency, such as the U.S. dollar or the euro, Russia fixes to a basket of currencies, also called a composite currency. The most common currency basket to fix to is the Special Drawing Rights (SDR), a composite currency issued by the IMF used for central bank transactions.
Finally, sixteen countries in the European Union are currently members of the euro area. Within this area, the countries have retired their own national currencies in favor of using a single currency, the euro. When all countries circulate the same currency, it is the ultimate in fixity, meaning they have fixed exchange rates among themselves because there is no need to exchange. However, with respect to other external currencies, like the U.S. dollar or the Japanese yen, the euro is allowed to float freely.
Trade Balances and International Investment Positions
One of the most widely monitored international statistics is a country’s trade balance. If the value of total exports from a country exceeds total imports, we say a country has a trade surplusOccurs when the value of exports exceeds the value of imports during a year.. However, if total imports exceed total exports, then the country has a trade deficitOccurs when the value of imports exceeds the value of exports during a year.. Of course, if exports equal imports, then the country has balanced trade.
The terminology is unfortunate because it conveys a negative connotation to trade deficits, a positive connotation to trade surpluses, and perhaps an ideal connotation to trade balance. Later in the text, we will explain if or when these connotations are accurate and when they are inaccurate. Suffice it to say, for now, that sometimes trade deficits can be positive, trade surpluses can be negative, and trade balance could be immaterial.
Regardless, it is popular to decry large deficits as being a sign of danger for an economy, to hail large surpluses as a sign of strength and dominance, and to long for the fairness and justice that would arise if only the country could achieve balanced trade. What could be helpful at an early stage, before delving into the arguments and explanations, is to know how large the countries’ trade deficits and surpluses are. A list of trade balances as a percentage of GDP for a selected set of countries is provided in Table 1.5 "Trade Balances and International Investment Positions GDP, 2009".
It is important to recognize that when a country runs a trade deficit, residents of the country purchase a larger amount of foreign products than foreign residents purchase from them. Those extra purchases are financed by the sale of domestic assets to foreigners. The asset sales may consist of property or businesses (a.k.a. investment), or it may involve the sale of IOUs (borrowing). In the former case, foreign investments entitle foreign owners to a stream of profits in the future. In the latter case, foreign loans entitle foreigners to a future repayment of principal and interest. In this way, trade and international investment are linked.
Because of these future profit takings and loan repayments, we say that a country with a deficit is becoming a debtor country. On the other hand, anytime a country runs a trade surplus, it is the domestic country that receives future profit and is owed repayments. In this case, we say a country running trade surpluses is becoming a creditor country. Nonetheless, trade deficits or surpluses only represent the debts or credits extended over a one-year period. If trade deficits continue year after year, then the total external debt to foreigners continues to grow larger. Likewise, if trade surpluses are run continually, then credits build up. However, if a deficit is run one year followed by an equivalent surplus the second year, rather than extending new credit to foreigners, the surplus instead will represent a repayment of the previous year’s debt. Similarly, if a surplus is followed by an equivalent deficit, rather than incurring debt to foreigners, the deficit instead will represent foreign repayment of the previous year’s credits.
All of this background is necessary to describe a country’s international investment position (IIP)A measure of the difference between the total value of domestic holdings of foreign assets and the value of foreign assets held in the domestic country., which measures the total value of foreign assets held by domestic residents minus the total value of domestic assets held by foreigners. It corresponds roughly to the sum of a country’s trade deficits and surpluses over its entire history. Thus if the value of a country’s trade deficits over time exceeds the value of its trade surpluses, then its IIP will reflect a larger value of foreign ownership of domestic assets than domestic ownership of foreign assets and we would say the country is a net debtor. In contrast, if a country has greater trade surpluses than deficits over time, it will be a net creditor.
Note how this accounting is similar to that for the national debt. A country’s national debt reflects the sum of the nation’s government budget deficits and surpluses over time. If deficits exceed surpluses, as they often do, a country builds up a national debt. Once a debt is present, though, government surpluses act to retire some of that indebtedness.
The key differences between the two are that the national debt is public indebtedness to both domestic and foreign creditors whereas the international debt (i.e., the IIP) is both public and private indebtedness but only to foreign creditors. Thus repayment of the national debt sometimes represents a transfer between domestic citizens and so in the aggregate has no impact on the nation’s wealth. However, repayment of international debt always represents a transfer of wealth from domestic to foreign citizens.
Table 1.5 Trade Balances and International Investment Positions GDP, 2009
| Country/Region | Trade Balance (%) | Debtor (−)/Creditor (+) Position (%) |
|---|---|---|
| Euro Area | −0.9 | −17.5 |
| United States | −3.1 | −24.4 |
| China | +6.1 | +35.1 |
| Japan | +2.7 | +50.4 |
| India | −0.3 | −6.8 |
| Russia | +2.2 | +15.1 |
| Brazil | −0.8 | −26.6 |
| South Korea | +3.8 | −57.9 |
| Indonesia | +1.2 | −31.4 |
| Spain | −5.7 | −83.6 |
| South Africa | −5.4 | −4.1 |
| Estonia | +5.8 | −83.1 |
Sources: Economist, the IMF, and the China State Administration of Foreign Exchange. See Economist, Weekly Indicators, December 30, 2009; IMF Dissemination Standards Bulletin Board at http://dsbb.imf.org/Applications/web/dsbbhome; IMF GDP data from Wikipedia at http://en.wikipedia.org/wiki/List_of_countries_by_GDP_%28nominal%29; and China State Administration of Foreign Exchange at http://www.safe.gov.cn/model_safe_en/tjsj_en/tjsj_detail_en.jsp?ID=30303000000000000,18&id=4.
Table 1.5 "Trade Balances and International Investment Positions GDP, 2009" shows the most recent trade balances and international investment positions, both as a percentage of GDP, for a selected set of countries. One thing to note is that some of the selected countries are running trade deficits while others are running trade surpluses. Overall, the value of all exports in the world must equal the value of all imports, meaning that some countries’ trade deficits must be matched with other countries’ trade surpluses. Also, although there is no magic number dividing good from bad, most observers contend that a trade deficit over 5 percent of GDP is cause for concern and an international debt position over 50 percent is probably something to worry about. Any large international debt is likely to cause substantial declines in living standards for a country when it is paid back—or at least if it is paid back.
The fact that debts are sometimes defaulted on, meaning the borrower decides to walk away rather than repay, poses problems for large creditor nations. The more money one has lent to another, the more one relies on the good faith and effort of the borrower. There is an oft-quoted idiom used to describe this problem that goes, “If you owe me $100, you have a problem, but if you owe me a million dollars, then I have a problem.” Consequently, international creditor countries may be in jeopardy if their credits exceed 30, 40, or 50 percent of GDP.
Note from the data that the United States is running a trade deficit of 3.1 percent of GDP, which is down markedly from about 6 percent a few years prior. The United States has also been running a trade deficit for more than the past thirty years and as a result has amassed a debt to the rest of the world larger than any other country, totaling about $3.4 trillion or almost 25 percent of U.S. GDP. As such, the U.S. is referred to as the largest debtor nation in the world.
In stark contrast, during the past twenty-five or more years Japan has been running persistent trade surpluses. As a result, it has amassed over $2.4 trillion of credits to the rest of the world or just over 50 percent of its GDP. It is by far the largest creditor country in the world. Close behind Japan is China, running trade surpluses for more than the past ten years and amassing over $1.5 trillion of credits to other countries. That makes up 35 percent of its GDP and makes China a close second to Japan as a major creditor country. One other important creditor country is Russia, with over $250 billion in credits outstanding or about 15 percent of its GDP.
Note that all three creditor nations are also running trade surpluses, meaning they are expending their creditor position by becoming even bigger lenders.
Like the United States, many other countries have been running persistent deficits over time and have amassed large international debts. The most sizeable are for Spain and Estonia, both over 80 percent of their GDPs. Note that Spain continues to run a trade deficit that will add to it international debt whereas Estonia is now running a trade surplus that means it is in the process of repaying its debt. South Korea and Indonesia are following a similar path as Estonia. In contrast, the Euro area, South Africa, and to a lesser degree Brazil and India are following the same path as the United States—running trade deficits that will add to their international debt.
Key Takeaways
- Exchange rates and trade balances are two of the most widely tracked international macroeconomic indicators used to discern the health of an economy.
- Different countries pursue different exchange rate regimes, choosing variations of floating and fixed systems.
-
The United States, as the largest national economy in the world, is a good reference point for comparing international macroeconomic data.
- The United States maintains an independently floating exchange rate, meaning that its value is determined on the private market.
- The United States trade deficit is currently at 3.1 percent of GDP. This is down from 6 percent recently but is one of a string of deficits spanning over thirty years.
- The U.S. international investment position stands at almost 25 percent of GDP, which by virtue of the U.S. economy size, makes the United States the largest debtor nation in the world.
-
Several other noteworthy statistics are presented in this section:
- China maintains a crawling peg fixed exchange rate.
- Russia fixes its currency to a composite currency while Estonia uses a currency board to maintain a fixed exchange rate.
- Japan is the largest creditor country in the world, followed closely by China and more distantly by Russia.
- Spain and Estonia are examples of countries that have serious international debt concerns, with external debts greater than 80 percent of their GDPs.
Exercises
-
Jeopardy Questions. As in the popular television game show, you are given an answer to a question and you must respond with the question. For example, if the answer is “a tax on imports,” then the correct question is “What is a tariff?”
- The de facto exchange rate regime implemented in China in 2008.
- The de facto exchange rate regime implemented in the United States in 2008.
- The de facto exchange rate regime implemented in Indonesia in 2008.
- The de facto exchange rate regime implemented in Estonia in 2008.
- The name for the exchange rate regime in which a fixed exchange rate is adjusted gradually and unpredictably.
- The name for the exchange rate regime in which the exchange rate value is determined by supply and demand for currencies in the private marketplace.
- The term for the measure of the total value of foreign assets held by domestic residents minus the total value of domestic assets held by foreigners.
- This country was the largest creditor country in the world as of 2008.
- Use the information in Table 1.1 "GDP and GDP per Capita (PPP in Billions of Dollars), 2009" and Table 1.5 "Trade Balances and International Investment Positions GDP, 2009" to calculate the dollar values of the trade balance and the international investment position for Japan, China, Russia, South Korea, and Indonesia.
1.4 Business Cycles: Economic Ups and Downs
Learning Objectives
- Understand the distinctions between an economic recession and a depression.
- Compare and contrast the current recession in the United States with previous economic downturns.
- Recognize why the economic downturn in the 1930s is called the Great Depression.
In 2009 the world was in the midst of the largest economic downturn since the early 1980s. Economic production was falling and unemployment rising. International trade fell substantially everywhere in the world, while investment both domestically and internationally dried up.
The source of these problems was the bursting of a real estate bubble. Bubbles are fairly common in both real estate and stock markets. A bubble is described as a steady and persistent increase in prices in a market, in this case, in the real estate markets in the United States and abroad. When bubbles are developing, many market observers argue that the prices are reflective of true values despite a sharp and unexpected increase. These justifications fool many people into buying the products in the hope that the prices will continue to rise and generate a profit.
When the bubble bursts, the demand driving the price increases ceases and a large number of participants begin to sell off their product to realize their profit. When these occur, prices quickly plummet. The dramatic drop in real estate prices in the United States in 2007 and 2008 left many financial institutions near bankruptcy. These financial market instabilities finally spilled over into the real sectorThe sector of an economy where goods and services are produced. (i.e., the sector where goods and services are produced), contributing to a world recession. As the current economic crisis unfolds, there have been many suggestions about similarities between this recession and the Great Depression in the 1930s. Indeed, it is common for people to say that this is the biggest economic downturn since the Great Depression. But is it?
To understand whether it is or not, it is useful to look at the kind of data used to measure recessions or depressions and to compare what has happened recently with what happened in the past. First, here are some definitions.
An economic recessionRefers to a decline in a country’s measured real gross domestic product (GDP) over a period usually coupled with an increasing aggregate unemployment rate. refers to a decline in a country’s measured real gross domestic product (GDP) over a period usually coupled with an increasing aggregate unemployment rate. In other words, it refers to a decline in economic productive activity. How much of a decline is necessary before observers will begin to call it a recession is almost always arguable, although there are a few guidelines one can follow.
In the United States, it is typical to define a recession as two successive quarters of negative real GDP growth. This definition dates to the 1970s and is little more than a rule of thumb, but it is one that has become widely applied. A more official way to define a recession is to accept the pronouncements of the National Bureau of Economic Research (NBER). This group of professional economists looks at more factors than just GDP growth rates and will also make judgments about when a recession has begun and when one has ended. According to the NBER, the current recession began in December 2007 in the United States. However, it did not proclaim that until December 2008. Although the U.S. economy contracted in the fourth quarter of 2007, it grew in the first two quarters of 2008, meaning that it did not fulfill the two successive quarters rule. That wasn’t satisfied until the last two quarters of 2008 both recorded a GDP contraction. As of January 2010, the U.S. economy continues in a recession according to the NBER.See the National Bureau of Economic Research, http://www.nber.org/cycles.html.
A very severe recession is referred to as a depression. How severe a recession has to be to be called a depression is also a matter of judgment. In fact in this regard there are no common rules of thumb or NBER pronouncements. Some recent suggestions in the press are that a depression is when output contracts by more than 10 percent or the recession lasts for more than two years. Based on the second definition and using NBER records dating the length of recessions, the United States experienced depressions from 1865 to 1867, 1873 to 1879, 1882 to 1885, 1910 to 1912, and 1929 to 1933. Using this definition, the current recession could be judged a depression if NBER dates the end of the contraction to a month after December 2009.
The opposite of a recession is an economic expansion or economic boom. Indeed, the NBER measures not only the contractions but the expansions as well because its primary purpose is to identify the U.S. economy’s peaks and troughs (i.e., high points and low points). When moving from a peak to a trough the economy is in a recession, but when moving from a trough to a peak it is in an expansion or boom. The term used to describe all of these ups and downs over time is the business cycleThe term used to describe the cyclical pattern of economic expansions and contractions over time..
The business cycle has been a feature of economies since economic activity has been measured. The NBER identifies recessions going back to the 1800s with the earliest listed in 1854. Overall, the NBER has classified thirty-four recessions since 1854 with an average duration of seventeen months. The longest recession was sixty-five months from 1873 to 1879, a contraction notable enough to be called the Great Depression until another one came along to usurp it in the 1930s. On the upside, the average economic expansion in the United States during this period lasted thirty-eight months, with the longest being 120 months from 1991 to 2001. Interestingly, since 1982 the United States has experienced three of its longest expansions segmented only by relatively mild recessions in 1991 and 2001. This had led some observers to proclaim, “The business cycle is dead.” Of course, that was until we headed into the current crisis. (See here for a complete listing of NBER recessions: http://www.nber.org/cycles/cyclesmain.html.)
The Recession of 2008–2009
Next, let’s take a look at how the GDP growth figures look recently and see how they compare with previous periods. First, growth rates refer to the percentage change in real GDP, which means that the effects of inflation have been eliminated. The rates are almost always reported in annual terms (meaning the growth rate over a year) even when the period is defined as one quarter. In the United States and most other countries, GDP growth rates are reported every quarter, and that rate represents how much GDP would grow during a year if the rate of increase proceeded at the same pace as the growth during that quarter. Alternatively, annual growth rates can be reported as the percentage change in real GDP from the beginning to the end of the calendar year (January 1 to December 31).
Table 1.6 "U.S. Real GDP Growth and Unemployment Rate, 2007–2009" presents the quarterly real GDP growth rates from the beginning of 2007 to the end of 2009 and the corresponding unemployment rate that existed during the middle month of each quarter. Note first that in 2007, GDP growth was a respectable 2 to 3 percent and unemployment was below 5 percent, signs of a healthy economy. However, by the first quarter in 2008, GDP became negative although unemployment remained low. Growth rebounded to positive territory in the second quarter of 2008 while at the same time unemployment began to rise rapidly. At this time, there was great confusion about whether the U.S. economy was stalling or whether it was experiencing a temporary slowdown. By late 2008, though, speculation about an impending recession came to an end. Three successive quarters of significant GDP decline occurred between the second quarter of 2008 and the end of the first quarter in 2009, while the unemployment rate began to skyrocket. By the middle of 2009, the decline of GDP subsided and reversed to positive territory by the third quarter. However, the unemployment rate continued to rise, though at a slower pace. What happens next is anyone’s guess, but to get a sense of the severity of this recession it is worth analyzing at least two past recessions: that of 1981 to 1982 and the two that occurred in the 1930s, which together are known as the Great Depression.
Table 1.6 U.S. Real GDP Growth and Unemployment Rate, 2007–2009
| Year.Quarter | Growth Rate (%) | Unemployment Rate (%) |
|---|---|---|
| 2007.1 | 1.2 | 4.5 |
| 2007.2 | 3.2 | 4.5 |
| 2007.3 | 3.6 | 4.7 |
| 2007.4 | 2.1 | 4.7 |
| 2008.1 | −0.7 | 4.8 |
| 2008.2 | 1.5 | 5.6 |
| 2008.3 | −2.7 | 6.2 |
| 2008.4 | −5.4 | 6.8 |
| 2009.1 | −6.4 | 8.1 |
| 2009.2 | −0.7 | 9.4 |
| 2009.3 | 2.2 | 9.7 |
| 2009.4 | — | 10.0 |
Sources: U.S. Bureau of Economic and Analysis and U.S. Department of Labor.
The Recession of 1980–1982
At a glance the current recession most resembles the recessionary period from 1980 to 1982. The NBER declared two recessions during that period; the first lasting from January to July 1980 and the second lasting from July 1981 to November 1982. As can be seen in Table 1.7 "U.S. Real GDP Growth and Unemployment Rate, 1980–1983", GDP growth moved like a roller coaster ride. Coming off a sluggish period of stagflationAn economic situation characterized by low or negative GDP growth together with high inflation. in the mid-1970s, unemployment began somewhat higher at around 6 percent, while growth in 1979 (not shown) was less than 1 percent in several quarters. Then in the second quarter of 1980, GDP plummeted by almost 8 percent, which is much more severe than anything in the current recession. Note that the largest quarterly decrease in the U.S. GDP in the post–World War II era was −10.4 percent in the first quarter of 1958. In the same quarter, unemployment soared, rising over a percentage point in just three months. However, this contraction was short-lived since the GDP fell only another 0.7 percent in the third quarter and then rebounded with substantial growth in the fourth quarter of 1980 and the first quarter of 1981. Notice that despite the very rapid increase in the GDP, unemployment hardly budged downward, remaining stubbornly fixed around 7.5 percent. The rapid expansion was short-lived, as the GDP tumbled again by over 3 percent in the second quarter of 1981 only to rise again by a healthy 5 percent in the third quarter. But once again, the economy plunged back into recession with substantial declines of 5 percent and over 6 percent for two successive quarters in the GDP in late 1981 and early 1982. Meanwhile, from mid-1981 until after the real rebound began in 1983, the unemployment rate continued to rise, reaching a peak of 10.8 percent in late 1982, the highest unemployment rate in the post–World War II period.
Table 1.7 U.S. Real GDP Growth and Unemployment Rate, 1980–1983
| Year.Quarter | Growth Rate (%) | Unemployment Rate (%) |
|---|---|---|
| 1980.1 | +1.3 | 6.3 |
| 1980.2 | −7.9 | 7.5 |
| 1980.3 | −0.7 | 7.7 |
| 1980.4 | +7.6 | 7.5 |
| 1981.1 | +8.6 | 7.4 |
| 1981.2 | −3.2 | 7.5 |
| 1981.3 | +4.9 | 7.4 |
| 1981.4 | −4.9 | 8.3 |
| 1982.1 | −6.4 | 8.9 |
| 1982.2 | +2.2 | 9.4 |
| 1982.3 | −1.5 | 9.8 |
| 1982.4 | +0.3 | 10.8 |
| 1983.1 | +5.1 | 10.4 |
| 1983.2 | +9.3 | 10.1 |
| 1983.3 | +8.1 | 9.5 |
| 1983.4 | +8.5 | 8.5 |
Sources: U.S. Bureau of Economics and Analysis (http://www.bea.gov) and U.S. Department of Labor (http://www.dol.gov).
If indeed the current recession turns out like the 1980 to 1983 episode, we might expect to see substantial swings in the GDP growth rates in future quarters in the United States. The ups and downs are analogous to a bicycle smoothly traversing along a smooth road when the rider suddenly hits a large obstruction. The obstruction jolts the bike to one side while the rider compensates to pull the bike upright. However, the compensation is often too much, and the bike swings rapidly to the opposite side. This too inspires an exaggerated response that pushes the bike again too quickly to the original side. In time, the rider regains his balance and directs the bike along a smooth trajectory. That is what we see in Table 1.7 "U.S. Real GDP Growth and Unemployment Rate, 1980–1983" of the last quarters in 1983, when rapid growth becomes persistent and unemployment finally begins to fall.
The other lesson from this comparison is to note how sluggishly unemployment seems to respond to a growing economy. In late 1980 and early 1981, unemployment didn’t budge despite the rapid revival of economic growth. In 1983, it took almost a full year of very rapid GDP growth before the unemployment rate began to fall substantially. This slow response is why the unemployment rate is often called a lagging indicator of a recession; it responds only after the recession has already abated.
The Great Depression
During the current recession there have been many references to the Great Depression of the 1930s. One remark often heard is that this is the worst recession since the Great Depression. As we can see in Table 1.7 "U.S. Real GDP Growth and Unemployment Rate, 1980–1983", this is not quite accurate since the recession of the early 1980s can easily be said to have been worse than the current one…at least so far.
It is worth comparing numbers between the current period and the Depression years if only to learn how bad things really were during the 1930s. The Great Depression was a time that transformed attitudes and opinions around the world and can surely be credited with having established the necessary preconditions for the Second World War.
So let’s take a look at how bad it really was. Once again, we’ll consider the U.S. experience largely because the data are more readily available. However, it is worth remembering that all three of the economic downturns described here are notable in that they were worldwide in scope.
First of all, there is no quarterly data available for the 1930s as quarterly data in the United States first appeared in 1947. Indeed, there was no formal organized collection of data in the 1930s for a variable such as GDP. Thus the numbers presented by the U.S. Bureau of Economic and Analysis (BEA) were constructed by piecing together available data.
A second thing to realize is that annual GDP growth rates tend to have much less variance than quarterly data. In other words, the highs are not as high and the lows not as low. This is because the annual data are averaging the growth rates over the four quarters. Also, sometimes economic downturns occur at the end of one year and the beginning of the next so that the calendar year growth may still be positive in both years. For example in 2008, even though GDP growth was negative in three of four quarters, the annual GDP growth that year somehow registered a +0.4 percent. Also in 1980, despite an almost 8 percent GDP drop in the second quarter, the annual GDP growth that year was −0.3 percent. The same is true for 1982, which registered two quarters of negative GDP growth at −6.4 percent and −1.5 percent but still the GDP fell annually at only −1.9 percent.
With this caveat in mind, the U.S. GDP growth rates for the 1930s are astounding. From 1930 to 1933, the United States registered annual growth rates of −8.6 percent, −6.5 percent, −13.1 percent, and −1.3 percent. The unemployment rate, which is estimated to have been around 3 percent in the 1920s, rose quickly in 1930 to 8.9 percent and continued to rise rapidly to a height of almost 25 percent in 1933. Although growth returned with vigor in 1934 and for another four years, the unemployment rate remained high and only slowly fell to 14.3 percent by 1937.
Table 1.8 U.S. Real GDP Growth and Unemployment Rate, 1930–1940
| Year | Growth Rate (%) | Unemployment Rate (%) |
|---|---|---|
| 1930 | −8.6 | 8.9 |
| 1931 | −6.5 | 15.9 |
| 1932 | −13.1 | 23.6 |
| 1933 | −1.3 | 24.9 |
| 1934 | +10.9 | 21.7 |
| 1935 | +8.9 | 20.1 |
| 1936 | +13.0 | 17.0 |
| 1937 | +5.1 | 14.3 |
| 1938 | −3.4 | 19.0 |
| 1939 | +8.1 | 17.2 |
| 1940 | +8.8 | 14.6 |
Sources: U.S. Bureau of Economics and Analysis and U.S. Department of Labor.
The NBER dated the first part of the Depression as having started in August 1929 and ending in March 1933. But a second wave came, another recession beginning in May 1937 and ending in June 1938. This caused GDP to fall by another 3.4 percent in 1938 while unemployment rose back above 15 percent for another two years.
The Great Depression is commonly used to refer to the economic crisis (or crises) that persisted for the entire decade of the 1930s, only truly coming to an end at the start of World War II. Even then it is worth mentioning that although GDP began to grow rapidly during World War II, with GDP growth from 1941 to 1943 at 17.1 percent, 18.5 percent, and 16.4 percent, respectively, and with U.S. unemployment falling to 1.2 percent in 1944, these data mask the fact that most of the extra production was for bullets and bombs and much of the most able part of the workforce was engaged in battle in the Atlantic and Pacific war theaters. In other words, the movement out of the Great Depression was associated with a national emergency rather than a more secure and rising standard of living.
Although the data presented only cover the United States, the Great Depression was a worldwide phenomenon. Without digging too deeply into the data or just by taking a quick look at Wikipedia’s article on the Great Depression, it reveals the following: unemployment in 1932 peaked at 29 percent in Australia, 27 percent in Canada, and 30 percent in Germany. In some towns with specialized production in the United Kingdom, unemployment rose as high as 70 percent.
Needless to say, the Great Depression was indeed “great” in the sense that it was the worst economic downturn the world experienced in the twentieth century. In comparison, the current recession, which is coming to be known as the Great Recession, comes nowhere close to the severity of the Great Depression…at least for the moment (as of January 2010). A more accurate description of the current recession is that it is the worst since the 1980s in the United States. However, we should always be mindful of a second downturn as was seen in the late 1930s. Even after things begin to improve, economies can suffer secondary collapses. Hopefully, demands will soon rebound, production will sluggishly increase, and unemployment rates will begin to fall around the world. We will soon see.
Key Takeaways
- The business cycle refers to the cyclical pattern of economic expansions and contractions. Business cycles have been a persistent occurrence in all modern economies.
- The current recession, sometimes called the Great Recession, is comparable in GDP decline and unemployment increases in the United States to the recessions in the early 1980s.
- The Great Depression of the 1930s displayed much greater decreases in GDP, showed much larger increases in unemployment, and lasted for a longer period than any economic downturn in the United States since then.
- The largest annual decrease in the U.S. GDP during the Great Depression was −13.1 percent while the highest unemployment rate was 24.9 percent.
- The largest quarterly decrease in the U.S. GDP during the current recession was −6.4 percent while the highest unemployment rate was 10.1 percent.
- The largest quarterly decrease in the U.S. GDP since World War II was −10.4 percent in the first quarter of 1958, while the highest unemployment rate was 10.8 percent in 1982.
- Of the thirty-four U.S. recessions since 1854 classified by the NBER, the longest was sixty-five months in the 1870s, whereas the average length was seventeen months.
- Of all the U.S. expansions since 1854 classified by the NBER, the longest was 120 months in the 1990s whereas the average length was thirty-eight months.
Exercise
-
Jeopardy Questions. As in the popular television game show, you are given an answer to a question and you must respond with the question. For example, if the answer is “a tax on imports,” then the correct question is “What is a tariff?”
- Approximately the worst U.S. quarterly economic growth performance between 2007 and 2009.
- Approximately the worst U.S. quarterly economic growth performance between 1980 and 1983.
- Approximately the worst U.S. annual economic growth performance between 1930 and 1940.
- Approximately the best U.S. annual economic growth performance between 1930 and 1940.
- Approximately the period of time generally known as the Great Depression.
- Approximately the highest unemployment rate in the U.S. during the Great Depression.
- Approximately the highest unemployment rate in Germany during the Great Depression.
- Approximately the best U.S. annual economic growth performance in the midst of World War II.
- The longest economic recession (in months) in the United States since 1854 as classified by the NBER.
- The longest economic expansion (in months) in the United States since 1854 as classified by the NBER.
- The term used to describe the cyclical pattern of economic expansions followed by economic contractions.
1.5 International Macroeconomic Institutions: The IMF and the World Bank
Learning Objectives
- Learn about the origins of the World Bank and the International Monetary Fund.
- Understand the purpose of the International Monetary Fund both during the fixed exchange rate regime from 1945 to 1973 and after 1973.
After the Great Depression, one of the things policymakers thought was important was to return the international economy to a system of fixed exchange rates. Before the Depression (i.e., in the 1920s and before), the world mostly maintained a gold standard. Under such a system, a country establishes two rules: first, it fixes its currency value to a weight of gold; second, it establishes convertibility between the currency and gold. This means that any individual holding the national currency is allowed to cash in the currency for its equivalent in gold upon demand.
In essence, the gold standard derives from a system in which gold itself was used as a currency in exchange. Since gold was sufficiently rare and because it was inherently valuable to people, it was an ideal substance to use as a store of value and a medium of exchange (as was silver). However, once trucking gold around became more difficult, it became easier for governments to issue paper currency but to back up that currency with gold on reserve. Thus currency in circulation was just a representation of actual gold in the government’s vault, and if a person ever wished to see that actual gold, he or she could simply demand conversion.
There is much that can be said about how a gold standard operates, but that discussion is reserved for a later chapter. For our purposes here, it is sufficient to explain that the gold standard was a system of fixed exchange rates. For example, before the 1930s the United States fixed the dollar at $20.67 per ounce of gold. During the same period, the United Kingdom fixed its currency at £4.24 per ounce. As a result of the gold-currency convertibility in both countries, this meant the dollar and pound were fixed to each other at a rate of $4.875/£.
During the Depression years, most countries dropped off the gold standard because the loss of confidence threatened a complete conversion of currency to gold and the depletion of national gold reserves. But, as World War II drew to a close, experts were assembled in Bretton Woods, New Hampshire, in the United States in 1944 to design a set of institutions that would help establish an effective international monetary system and to prevent some of the adjustment catastrophes that occurred after World War I. One such catastrophe occurred in Germany in 1922 to 1923 when a floating German currency resulted in one of the worst hyperinflations in modern history. Photos from that period show people with wheelbarrows full of money being used to make basic purchases. One way to prevent a reoccurrence was to establish a system of fixed exchange rates. As will be shown later, an important benefit of fixed exchange rates is the potential for such a system to prevent excessive inflation.
The Bretton Woods ConferenceA monetary conference held in 1944 in Bretton Woods, New Hampshire, that laid the groundwork for the establishment of the World Bank and the IMF., more formally called the United Nations Monetary and Financial Conference, was held in July 1944. The purpose of the conference was to establish a set of institutions that would support international trade and investment and prevent some of the monetary instabilities that had plagued the world after World War I. The conference proposed three institutions, only two of which finally came into being.
The unsuccessful institution was the International Trade Organization (ITO), which was intended to promote the reduction of tariff barriers and to coordinate domestic policies so as to encourage a freer flow of goods between countries. Although a charter was drawn up for the ITO, the United States refused to sign onto it, fearing that it would subordinate too many of its domestic policies to international scrutiny. A subagreement of the ITO, the General Agreement on Tariffs and Trade (GATT), designed to promote multilateral tariff reductions, was established independently though.
The two successfully chartered institutions from the Bretton Woods Conference were the International Bank for Reconstruction and Development (IBRD)The core institution in the World Bank whose mission is to provide loans to assist postwar reconstruction and economic development. and the International Monetary Fund (IMF)The international organization created after World War II to oversee the Bretton Woods system of fixed exchange rates..
The IBRD is one component of a larger organization called the World Bank. Its purpose was to provide loans to countries to aid their reconstruction after World War II and to promote economic development. Much of its early efforts focused on reconstruction of the war-torn economies, but by the 1960s, its efforts were redirected to developing countries. The intent was to get countries back on their feet, economically speaking, as quickly as possible.
The second successfully chartered organization was the IMF. Its purpose was to monitor and maintain the stability of the fixed exchange rate system that was established. The system was not the revival of a gold standard but rather what is known as a gold-exchange standard. Under this system, the U.S. dollar was singled out as the international reserve currency. Forty-four of the forty-five ratifying countries agreed to have their currency fixed to the dollar. The dollar in turn was fixed to gold at $35 per ounce. The countries also agreed not to exchange officially held gold deposits for currency as had been the practice under the gold standard. However, countries agreed that officially held gold could be exchanged between central banks.
Another important requirement designed to facilitate the expansion of international trade was that countries agreed not to put any restrictions or controls on the exchange of currencies when that exchange was intended for transactions on the current account. In other words, individuals would be free to exchange one currency for another if they wanted to import goods from another country. However, currency controls or restrictions were allowed for transactions recorded on the financial accounts. This allowed countries to prevent foreign purchases of businesses and companies or to prevent foreign banks from lending or borrowing money. These types of restrictions are commonly known as capital controlsAny type of government restriction on international financial, or capital, transactions. This may include taxes on financial transactions or regulations specifying whether foreign citizens can buy domestic assets or in what quantities. (also, currency controls and/or exchange restrictions). These controls were allowed largely because it was believed they were needed to help maintain the stability of the fixed exchange rate system.
The way a fixed exchange system operates in general, and the way the Bretton Woods gold exchange standard operated in particular, is covered in detail in Chapter 11 "Fixed Exchange Rates". For now I will simply state without explanation that to maintain a credible fixed exchange rate system requires regular intervention in the foreign exchange markets by country central banks. Sometimes to maintain the fixed rate a country might need to sell a substantial amount of U.S. dollars that it is holding on reserve. These reserves are U.S. dollar holdings that had been purchased earlier, but sometimes a country can run what is called a balance of payments deficit—that is, run out of dollar reserves and threaten the stability of the fixed exchange rate system.
At the Bretton Woods Conference, participants anticipated that this scenario would be a common occurrence and decided that a “fund” be established to essentially “bail out” countries that suffered from balance of payments problems. That fund was the IMF.
The IMF was created to help stabilize exchange rates in the fixed exchange rate system. In particular, member countries contribute reserves to the IMF, which is then enabled to lend money to countries suffering balance of payments problems. With these temporary loans, countries can avoid devaluations of their currencies or other adjustments that can affect the confidence in the monetary system. Because the monies used by the IMF are contributions given by other countries in the group, it is expected that once a balance of payments problem subsides that the money will be repaid. To assure repayment the IMF typically establishes conditions, known as conditionality, for the recipients of the loans. These conditions generally involve changes in monetary and fiscal policies intended to eliminate the original problems with the balance of payments in the first place.
The role of the IMF has changed more recently though. The fixed exchange rate system, under which the IMF is designed to operate, collapsed in 1973. Since that time, most of the major currencies in the world—including the U.S. dollar, the British pound, the Japanese yen, and many others—are floating. When a currency is allowed to float, its value is determined by supply and demand in the private market and there is no longer any need for a country’s central bank to intervene. This in turn means that a country can no longer get into a balance of payments problem since that balance is automatically achieved with the adjustment in the exchange rate value. In essence the raison d’être of the IMF disappeared with the collapse of the Bretton Woods system.
Curiously, the IMF did not fall out of existence. Instead, it reinvented itself as a kind of lender of last resort to national governments. After 1973, the IMF used its “fund” to assist national governments that had international debt problems. For example, a major debt crisis developed in the early 1980s when national governments of Mexico, Brazil, Venezuela, Argentina, and eventually many other nations were unable to pay the interest on their external debt, or the money they borrowed from other countries. Many of these loans were either taken by the national governments or were guaranteed by the national governments. This crisis, known as the Third World debt crisis, threatened to bring down the international financial system as a number of major banks had significant exposure of foreign loans that were ultimately defaulted on. The IMF stepped in to provide “structural adjustment programs” in this instance. So the IMF not only loaned money for countries experiencing balance of payments crises but also now provided loans to countries that could not pay back their foreign creditors. And also, because the IMF wanted to get its money back (meaning the money contributed by the member nations), the structural adjustment loans came with strings attached: IMF conditionalityConditions that countries must promise to fulfill to receive a loan from the IMF. Conditions can include requirements to reduce government budget deficits, suggestions for privatization of state-owned enterprises, and strict controls on monetary expansion..
Since that time, the IMF has lent money to many countries suffering from external debt repayment problems. It stepped in to help Brazil and Argentina several times in the 1980s and later. It helped Mexico during the peso crisis in 1994. It assisted countries during the Asian currency crisis of 1997 and helped Russia one year later when the Asian contagion swept through.
Although the IMF has come under much criticism, especially because conditionality is viewed by some as excessively onerous, it is worth remembering that the IMF makes loans, not grants. Thus it has the motivation to demand changes in policies that raise the chances of being repaid. These conditions have generally involved things like fiscal and monetary responsibility. That means reducing one’s government budget deficit and curtailing the growth of the money supply. It also prescribed privatization that involves the sale or divestiture of state-owned enterprises. The free market orientation of these conditions came to be known as the Washington ConsensusA set of free market-oriented policies often prescribed by the IMF as a part of its conditions for countries to receive a structural adjustment loan..
Also mitigating the criticisms is the fact that the countries that participate in IMF programs are free to accept the loans, or not. To illustrate the alternative, Malaysia was one country that refused to participate in an IMF structural adjustment program during the Asian currency crisis and as a result did not have to succumb to any conditions. Thus it is harder to criticize the IMF’s conditions when the countries themselves have volunteered to participate. In exchange for what were often tens of billions of dollars in loans, these countries were able to maintain their good standing in the international financial community.
Although controversial, the IMF has played a significant role in maintaining the international financial system even after the collapse of fixed exchange rates. One last issue worth discussing in this introduction is the issue of moral hazard. In the past thirty years or so, almost every time a country has run into difficulty repaying its external debt, the IMF has stepped in to assure continued repayment. That behavior sends a signal to international investors that the risk of lending abroad is reduced. After all, if the country gets into trouble the IMF will lend the country money and the foreign creditors will still get their money back. The moral hazard refers to the fact that lending institutions in the developed countries may view the IMF like an insurance policy and thus make much riskier loans than they would have otherwise. In this way, the IMF could be contributing to the problem of international financial crisis rather than merely being the institution that helps clean up the mess.
Key Takeaways
- The World Bank and the IMF were proposed during the Bretton Woods Conference in 1944.
- The main purpose of the World Bank is to provide loans for postwar reconstruction and economic development for developing countries.
- The main purpose of the IMF was to monitor the international fixed exchange rate system and to provide temporary loans to countries suffering balance of payments problems.
- Since the breakup of the Bretton Woods fixed exchange rate system in 1973, the IMF has mostly assisted countries by making structural adjustment loans to those that have difficulty repaying international debts.
- The IMF conditionalities are the often-criticized conditions that the IMF places on foreign governments accepting their loans. The free-market orientation of these conditions is known as the Washington Consensus.
Exercise
-
Jeopardy Questions. As in the popular television game show, you are given an answer to a question and you must respond with the question. For example, if the answer is “a tax on imports,” then the correct question is “What is a tariff?”
- The name for the original division of the World Bank that describes its original purpose.
- The name for the international institution that was designed to assist countries suffering from balance of payments problems.
- The common name for the international institution whose primary function today is to make loans to countries to assist their economic development.
- In the Bretton Woods system, these types of regulations were allowed for transactions recorded on the financial account.
- This type of currency regime was implemented immediately after the collapse of the Bretton Woods system.
- The term used for the conditions the IMF places on loans it makes to countries.
- The term used for the type of loans made by the IMF to assist countries having difficulty making international debt repayments.
- The term used to describe the standard free market package of conditions typically invoked by the IMF on loans it makes to countries.