This is “Public Finance and Public Choice”, chapter 15 from the book Microeconomics Principles (v. 2.0). For details on it (including licensing), click here.
For more information on the source of this book, or why it is available for free, please see the project's home page. You can browse or download additional books there. To download a .zip file containing this book to use offline, simply click here.


Chapter 15 Public Finance and Public Choice
Start Up: Where Your Tax Dollars Go
You pay sales taxes on most of the goods you purchase. If you smoke or drink or drive a car, you pay taxes on cigarettes, alcohol, and gasoline. If you work, you may pay income and payroll taxes.
What does the government do with the taxes it collects? If you go to a public school, you are a consumer of public sector services. You also consume the services of the public sector when you drive on a public street or go to a public park. You consume public sector services since you are protected by law enforcement agencies and by the armed forces. And the production of everything else you consume is affected by regulations imposed by local, state, or federal agencies.
The public sector is a crucially important segment of the economy, due in part to its size. The nearly 90,000 government jurisdictions in the United States, from local fire protection districts to the federal government, either produce or purchase about one-fifth of all domestic goods and services. The U.S. government is the largest single purchaser of goods and services in the world.
This chapter examines the role of government in a market economy and the ways in which the taxes that support government affect economic behavior. The study of government expenditure and tax policy and of their impact on the economy is called public financeThe study of government expenditure and tax policy and of their impact on the economy..
We will also explore the economics of public sector choices. Economists put the notions of self-interest and the marginal decision rule to work in the analysis of choices made by people in the public sector—voters, government employees, interest groups, and politicians.
15.1 The Role of Government in a Market Economy
Learning Objectives
- Discuss and illustrate government responses to the market failures of public goods, external costs and benefits, and imperfect competition and how these responses have the potential to reduce deadweight loss.
- Define behavioral economics and explain how findings in this area of economics may be used to design government policy.
- Discuss ways in which governments redistribute income.
What do we want from our government? One answer is that we want a great deal more than we did several decades ago. The role of government has expanded dramatically in the last 80+ years. In 1929 (the year the Commerce Department began keeping annual data on macroeconomic performance in the United States), government expenditures at all levels (state, local, and federal) were less than 10% of the nation’s total output, which is called gross domestic product (GDP). In the current century, that share has more than tripled.
Figure 15.1 "Government Expenditures and Revenues as a Percentage of GDP" shows total government expenditures and revenues as a percentage of GDP from 1929 to 2010. All levels of government are included. Government expendituresAll spending by government agencies. include all spending by government agencies. Government revenuesAll funds received by government agencies. include all funds received by government agencies. The primary component of government revenues is taxes; revenue also includes miscellaneous receipts from fees, fines, and other sources. We will look at types of government revenues and expenditures later in this chapter.
Figure 15.1 Government Expenditures and Revenues as a Percentage of GDP
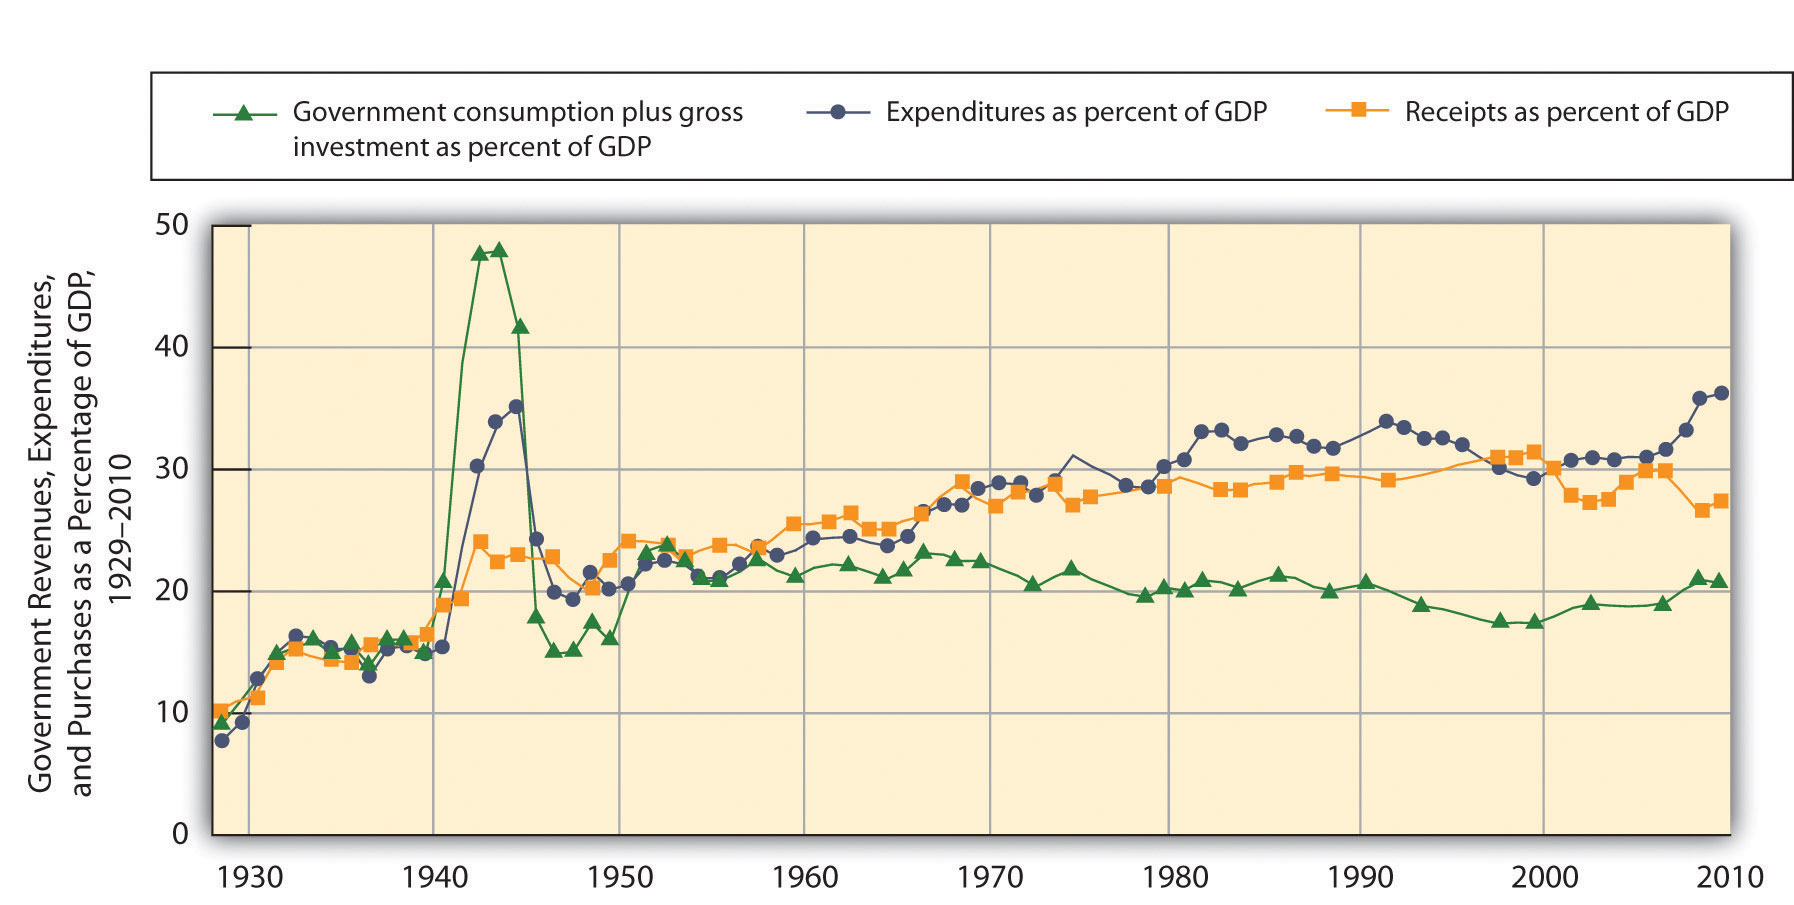
Government expenditures and revenues have risen dramatically as a percentage of GDP, the most widely used measure of economic activity, since 1929.
Source: U.S. Department of Commerce, Bureau of Economic Analysis, NIPA Tables 1.1.5 and 3.1.
Figure 15.1 "Government Expenditures and Revenues as a Percentage of GDP" also shows government purchases as a percentage of GDP. Government purchasesGoods or services purchased by a government agency. happen when a government agency purchases or produces a good or a service. We measure government purchases to suggest the opportunity cost of government. Whether a government agency purchases a good or service or produces it, factors of production are being used for public sector, rather than private sector, activities. A city police department’s purchase of new cars is an example of a government purchase. Spending for public education is another example.
Government expenditures and purchases are not equal because much government spending is not for the purchase of goods and services. The primary source of the gap is transfer paymentsPayments made by government agencies to individuals in the form of grants rather than in return for labor or other services., payments made by government agencies to individuals in the form of grants rather than in return for labor or other services. Transfer payments represent government expenditures but not government purchases. Governments engage in transfer payments in order to redistribute income from one group to another. The various welfare programs for low-income people are examples of transfer payments. Social Security is the largest transfer payment program in the United States. This program transfers income from people who are working (by taxing their pay) to people who have retired. Interest payments on government debt, which are also a form of expenditure, are another example of an expenditure that is not counted as a government purchase.
Several points about Figure 15.1 "Government Expenditures and Revenues as a Percentage of GDP" bear special attention. Note first the path of government purchases. Government purchases relative to GDP rose dramatically during World War II, then dropped back to about their prewar level almost immediately afterward. Government purchases rose again, though less sharply, during the Korean War. This time, however, they did not drop back very far after the war. It was during this period that military spending rose to meet the challenge posed by the former Soviet Union and other communist states—the “Cold War.” Government purchases have ranged between 17 and 23% of GDP ever since. The Vietnam War, the Persian Gulf War, and the wars in Afghanistan and Iraq did not have the impact on purchases that characterized World War II or even the Korean War. A second development, the widening gap between expenditures and purchases, has occurred since the 1960s. This reflects the growth of federal transfer programs, principally Social Security, programs to help people pay for health-care costs, and aid to low-income people. We will discuss these programs later in this chapter.
Finally, note the relationship between expenditures and receipts. When a government’s revenues equal its expenditures for a particular period, it has a balanced budgetSituation that occurs when a government’s revenues equal its expenditures for a particular period.. A budget surplusSituation that occurs when a government’s revenues exceed its expenditures. occurs if a government’s revenues exceed its expenditures, while a budget deficitSituation that occurs when government expenditures exceed revenues. exists if government expenditures exceed revenues.
Prior to 1980, revenues roughly matched expenditures for the public sector as a whole, except during World War II. But expenditures remained consistently higher than revenues between 1980 and 1996. The federal government generated very large deficits during this period, deficits that exceeded surpluses that typically occur at the state and local levels of government. The largest increases in spending came from Social Security and increased health-care spending at the federal level. Efforts by the federal government to reduce and ultimately eliminate its deficit, together with surpluses among state and local governments, put the combined budget for the public sector in surplus beginning in 1997. As of 1999, the Congressional Budget Office was predicting that increased federal revenues produced by a growing economy would continue to produce budget surpluses well into the twenty-first century.
That rather rosy forecast was set aside after September 11, 2001. Terrorist attacks on the United States and later on several other countries led to sharp and sustained increases in federal spending for wars in Afghanistan and Iraq, as well as expenditures for Homeland Security. The administration of George W. Bush proposed, and Congress approved, a tax cut. The combination of increased spending on the aforementioned items and others, as well as tax cuts, produced substantial deficits. The deficit grew markedly wider following the recession that began in December 2007. As incomes fell, tax receipts fell. Expenditures grew due to increased spending associated with the American Recovery and Reinvestment Act of 2009 designed to stimulate the economy. It included such things as extended unemployment compensation, increased assistance for the poor, and increased infrastructure spending.
The evidence presented in Figure 15.1 "Government Expenditures and Revenues as a Percentage of GDP" does not fully capture the rise in demand for public sector services. In addition to governments that spend more, people in the United States have clearly chosen governments that do more. The scope of regulatory activity conducted by governments at all levels, for example, has risen sharply in the last several decades. Regulations designed to prevent discrimination, to protect consumers, and to protect the environment are all part of the response to a rising demand for public services, as are federal programs in health care and education.
Figure 15.2 "Government Revenue Sources and Expenditures: 2009" summarizes the main revenue sources and types of expenditures for the U.S. federal government and for the European Union. In the United States, most revenues came from personal income taxes and from payroll taxes. Most expenditures were for transfer payments to individuals. Federal purchases were primarily for national defense; the “other purchases” category includes things such as spending for transportation projects and for the space program. Interest payments on the national debt and grants by the federal government to state and local governments were the other major expenditures. The situation in the European Union differs primarily by the fact that a greater share of revenue comes from taxes on production and imports and substantially less is spent on defense.
Figure 15.2 Government Revenue Sources and Expenditures: 2009
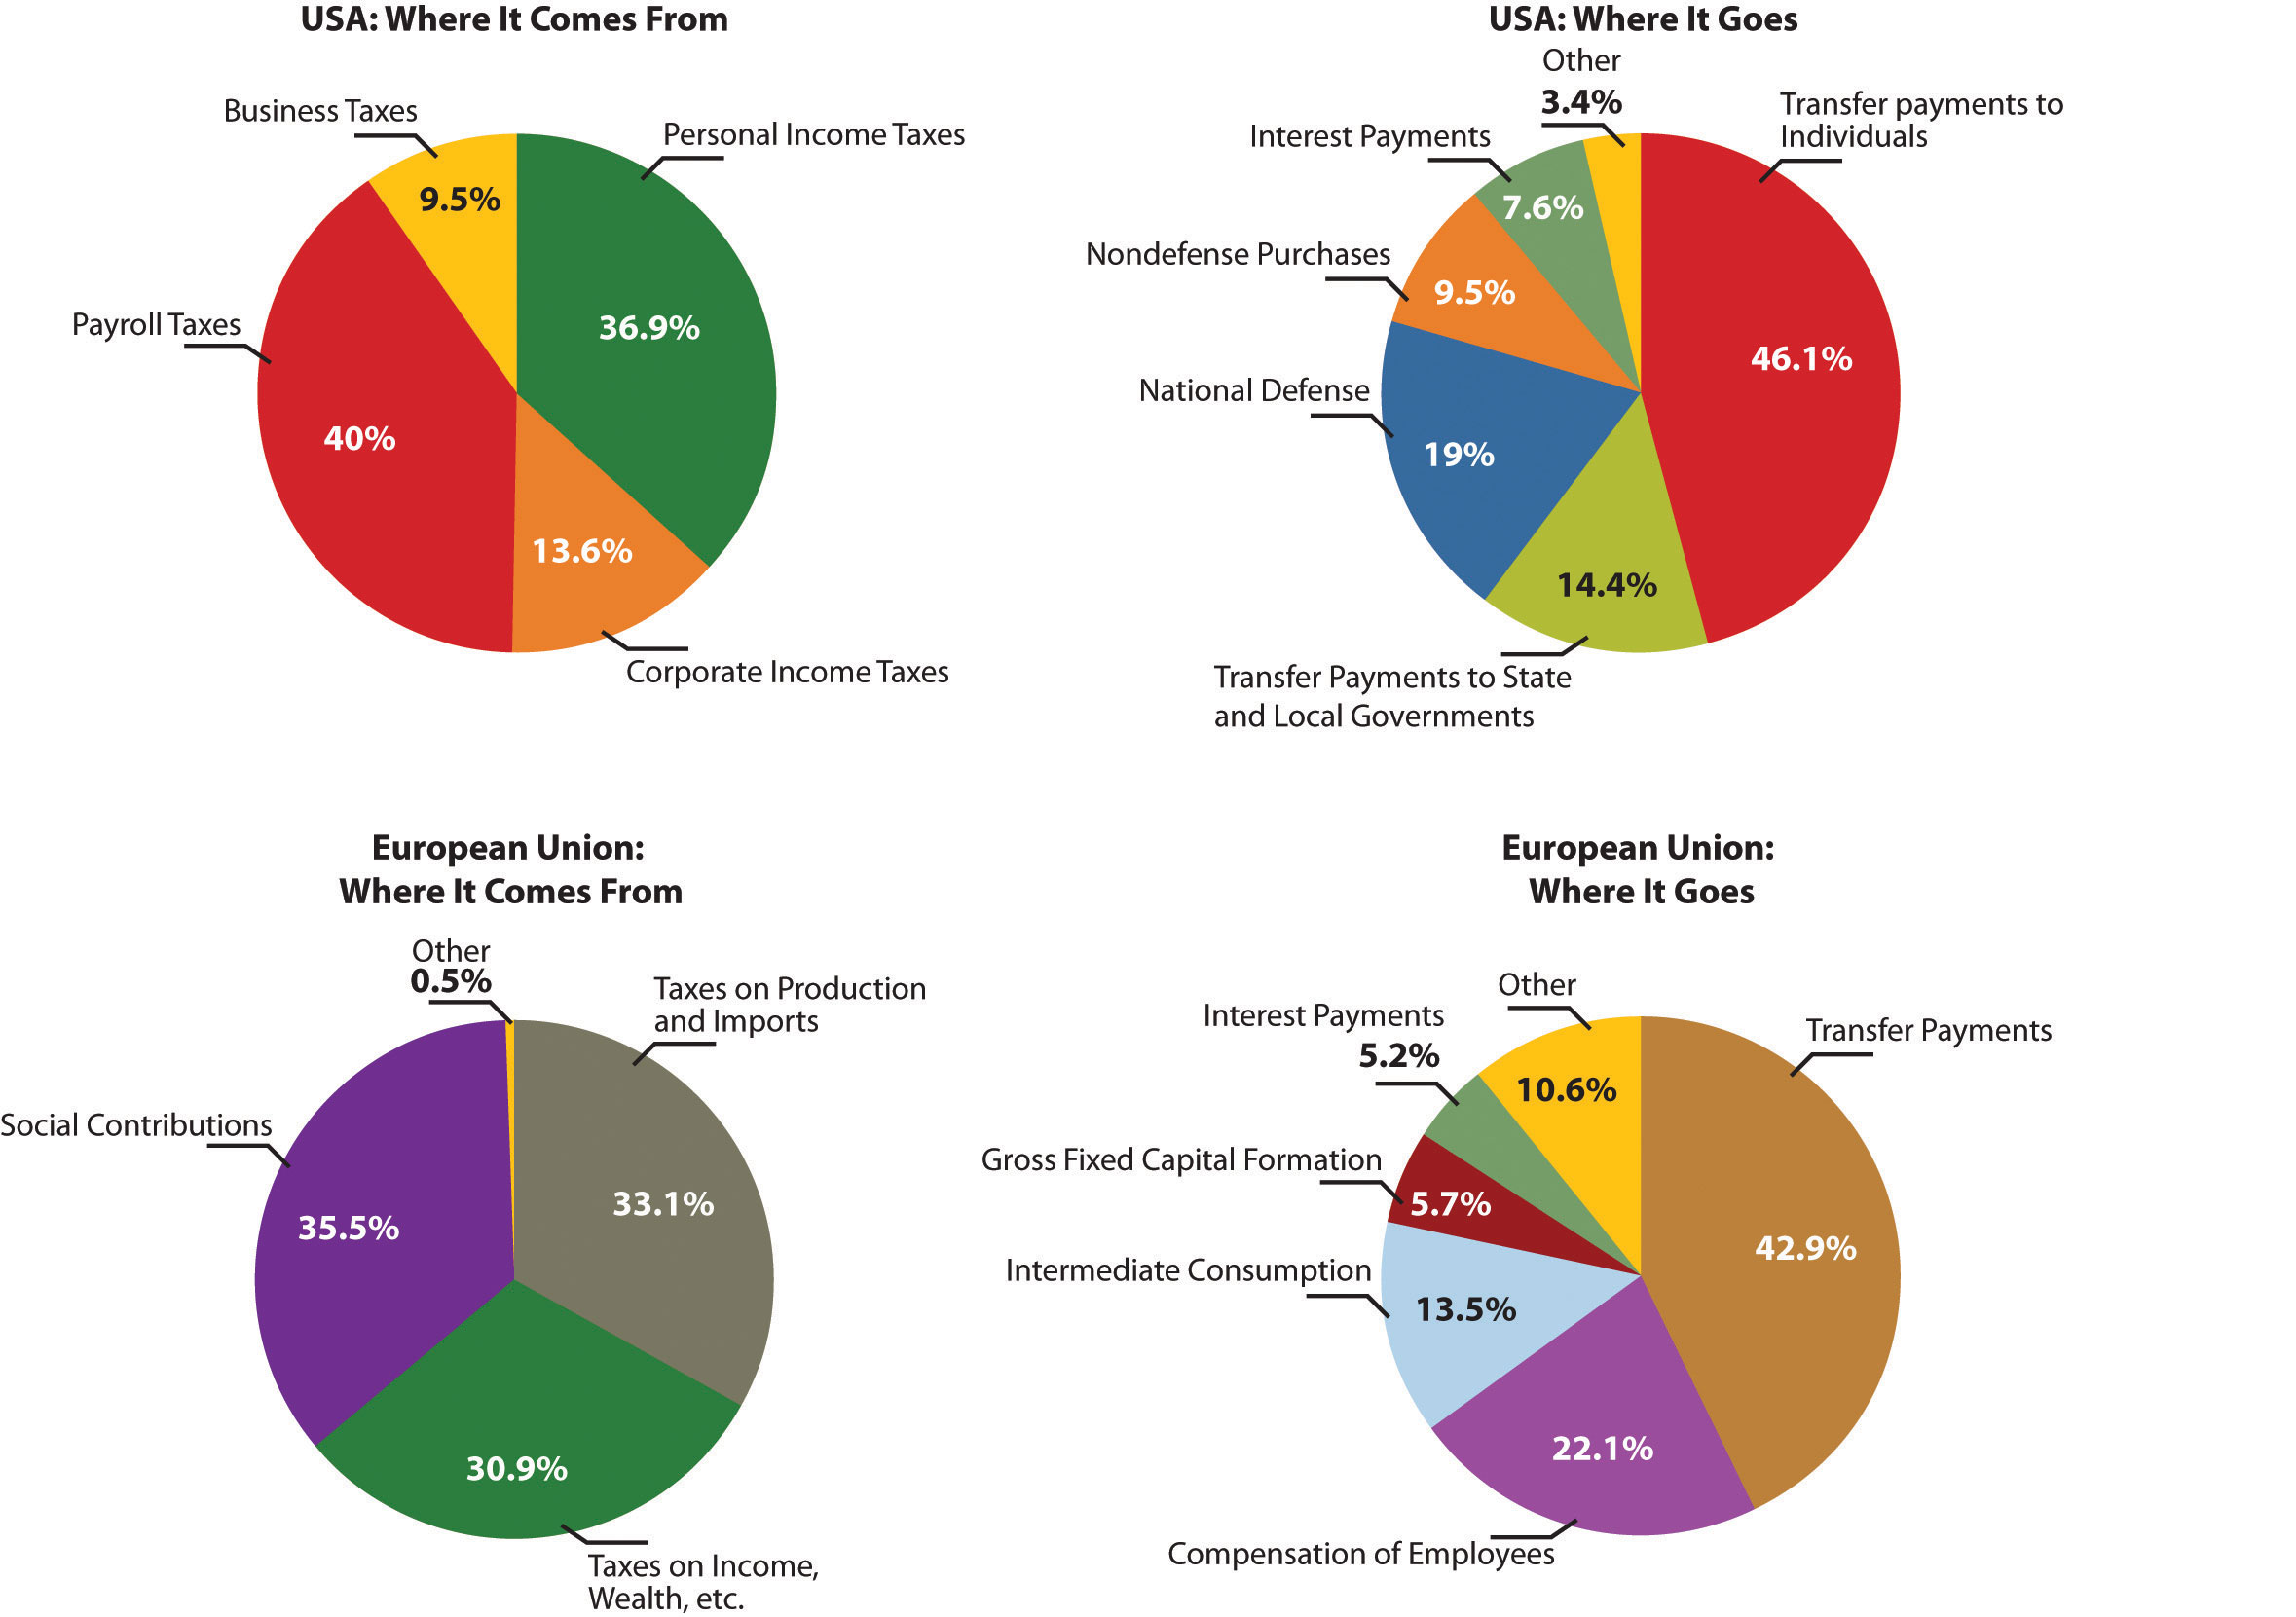
The four panels show the sources of government revenues and the shares of expenditures on various activities for all levels of government in the United States and the European Union in 2009.
Sources: Survey of Current Business, August 2011, Tables 3.2 and 3.10.5; Laurent Freysson, “General Government Expenditure Trends 2005–2010,” Eurostat Statistics in Focus 42 (2011); Laura Wahrig, “Tax Revenue in the European Union,” Eurostat Statistics in Focus 26 (2011).
To understand the role of government, it will be useful to distinguish four broad types of government involvement in the economy. First, the government attempts to respond to market failures to allocate resources efficiently. In a particular market, efficiency means that the quantity produced is determined by the intersection of a demand curve that reflects all the benefits of consuming a particular good or service and a supply curve that reflects the opportunity costs of producing it. Second, government agencies act to encourage or discourage the consumption of certain goods and services. The prohibition of drugs such as heroin and cocaine is an example of government seeking to discourage consumption of these drugs. Third, the government redistributes income through programs such as welfare and Social Security. Fourth, the government can use its spending and tax policies to influence the level of economic activity and the price level.
We will examine the first three of these aspects of government involvement in the economy in this chapter. The fourth, efforts to influence the level of economic activity and the price level, fall within the province of macroeconomics.
Responding to Market Failure
In an earlier chapter on markets and efficiency, we learned that a market maximizes net benefit by achieving a level of output at which marginal benefit equals marginal cost. That is the efficient solution. In most cases, we expect that markets will come close to achieving this result—that is the important lesson of Adam Smith’s idea of the market as an invisible hand, guiding the economy’s scarce factors of production to their best uses. That is not always the case, however.
We have studied several situations in which markets are unlikely to achieve efficient solutions. In an earlier chapter, we saw that private markets are likely to produce less than the efficient quantities of public goods such as national defense. They may produce too much of goods that generate external costs and too little of goods that generate external benefits. In cases of imperfect competition, we have seen that the market’s output of goods and services is likely to fall short of the efficient level. In all these cases, it is possible that government intervention will move production levels closer to their efficient quantities. In the next three sections, we shall review how a government could improve efficiency in the cases of public goods, external costs and benefits, and imperfect competition.
Public Goods
A public good is a good or service for which exclusion is prohibitively costly and for which the marginal cost of adding another consumer is zero. National defense, law enforcement, and generally available knowledge are examples of public goods.
The difficulty posed by a public good is that, once it is produced, it is freely available to everyone. No consumer can be excluded from consumption of the good on grounds that he or she has not paid for it. Consequently, each consumer has an incentive to be a free rider in consuming the good, and the firms providing a public good do not get a signal from consumers that reflects their benefit of consuming the good.
Certainly we can expect some benefits of a public good to be revealed in the market. If the government did not provide national defense, for example, we would expect some defense to be produced, and some people would contribute to its production. But because free-riding behavior will be common, the market’s production of public goods will fall short of the efficient level.
The theory of public goods is an important argument for government involvement in the economy. Government agencies may either produce public goods themselves, as do local police departments, or pay private firms to produce them, as is the case with many government-sponsored research efforts. An important debate in the provision of public education revolves around the question of whether education should be produced by the government, as is the case with traditional public schools, or purchased by the government, as is done in charter schools.
External Costs and Benefits
External costs are imposed when an action by one person or firm harms another, outside of any market exchange. The social costThe private cost of producing a good or service plus the external cost of producing it. of producing a good or service equals the private cost plus the external cost of producing it. In the case of external costs, private costs are less than social costs.
Similarly, external benefits are created when an action by one person or firm benefits another, outside of any market exchange. The social benefitThe private benefit of a good revealed in the market plus external benefits. of an activity equals the private benefit revealed in the market plus external benefits. When an activity creates external benefits, its social benefit will be greater than its private benefit.
The lack of a market transaction means that the person or firm responsible for the external cost or benefit does not face the full cost or benefit of the choice involved. We expect markets to produce more than the efficient quantity of goods or services that generate external costs and less than the efficient quantity of goods or services that generate external benefits.
Consider the case of firms that produce memory chips for computers. The production of these chips generates water pollution. The cost of this pollution is an external cost; the firms that generate it do not face it. These firms thus face some, but not all, of the costs of their production choices. We can expect the market price of chips to be lower, and the quantity produced greater, than the efficient level.
Inoculations against infectious diseases create external benefits. A person getting a flu shot, for example, receives private benefits; he or she is less likely to get the flu. But there will be external benefits as well: Other people will also be less likely to get the flu because the person getting the shot is less likely to have the flu. Because this latter benefit is external, the social benefit of flu shots exceeds the private benefit, and the market is likely to produce less than the efficient quantity of flu shots. Public, private, and charter schools often require such inoculations in an effort to get around the problem of external benefits.
Imperfect Competition
In a perfectly competitive market, price equals marginal cost. If competition is imperfect, however, individual firms face downward-sloping demand curves and will charge prices greater than marginal cost. Consumers in such markets will be faced by prices that exceed marginal cost, and the allocation of resources will be inefficient.
An imperfectly competitive private market will produce less of a good than is efficient. As we saw in the chapter on monopoly, government agencies seek to prohibit monopoly in most markets and to regulate the prices charged by those monopolies that are permitted. Government policy toward monopoly is discussed more fully in a later chapter.
Assessing Government Responses to Market Failure
In each of the models of market failure we have reviewed here—public goods, external costs and benefits, and imperfect competition—the market may fail to achieve the efficient result. There is a potential for government intervention to move inefficient markets closer to the efficient solution.
Figure 15.3 "Correcting Market Failure" reviews the potential gain from government intervention in cases of market failure. In each case, the potential gain is the deadweight loss resulting from market failure; government intervention may prevent or limit this deadweight loss. In each panel, the deadweight loss resulting from market failure is shown as a shaded triangle.
Figure 15.3 Correcting Market Failure
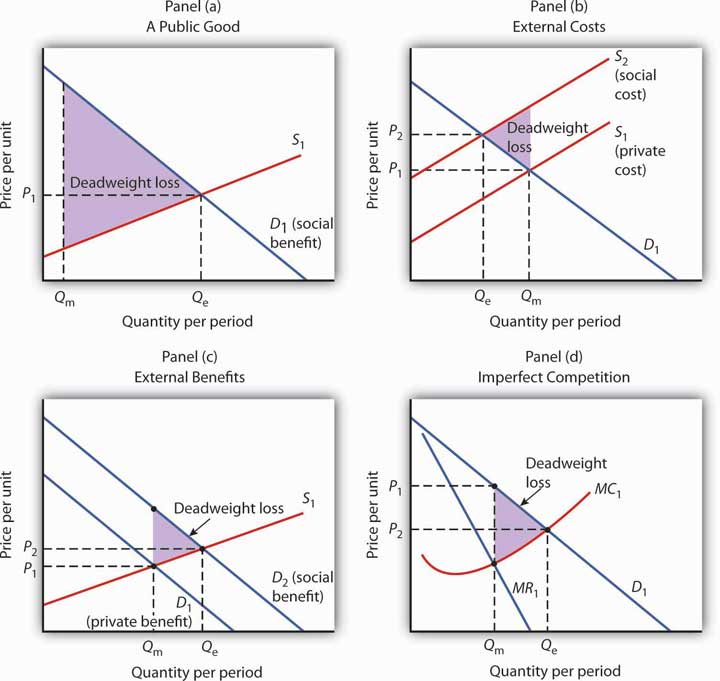
In each panel, the potential gain from government intervention to correct market failure is shown by the deadweight loss avoided, as given by the shaded triangle. In Panel (a), we assume that a private market produces Qm units of a public good. The efficient level, Qe, is defined by the intersection of the demand curve D1 for the public good and the supply curve S1. Panel (b) shows that if the production of a good generates an external cost, the supply curve S1 reflects only the private cost of the good. The market will produce Qm units of the good at price P1. If the public sector finds a way to confront producers with the social cost of their production, then the supply curve shifts to S2, and production falls to the efficient level Qe. Notice that this intervention results in a higher price, P2, which confronts consumers with the real cost of producing the good. Panel (c) shows the case of a good that generates external benefits. Purchasers of the good base their choices on the private benefit, and the market demand curve is D1. The market quantity is Qm. This is less than the efficient quantity, Qe, which can be achieved if the activity that generates external benefits is subsidized. That would shift the market demand curve to D2, which intersects the market supply curve at the efficient quantity. Finally, Panel (d) shows the case of a monopoly firm that produces Qm units and charges a price P1. The efficient level of output, Qe, could be achieved by imposing a price ceiling at P2. As is the case in each of the other panels, the potential gain from such a policy is the elimination of the deadweight loss shown as the shaded area in the exhibit.
Panel (a) of Figure 15.3 "Correcting Market Failure" illustrates the case of a public good. The market will produce some of the public good; suppose it produces the quantity Qm. But the demand curve that reflects the social benefits of the public good, D1, intersects the supply curve at Qe; that is the efficient quantity of the good. Public sector provision of a public good may move the quantity closer to the efficient level.
Panel (b) shows a good that generates external costs. Absent government intervention, these costs will not be reflected in the market solution. The supply curve, S1, will be based only on the private costs associated with the good. The market will produce Qm units of the good at a price P1. If the government were to confront producers with the external cost of the good, perhaps with a tax on the activity that creates the cost, the supply curve would shift to S2 and reflect the social cost of the good. The quantity would fall to the efficient level, Qe, and the price would rise to P2.
Panel (c) gives the case of a good that generates external benefits. The demand curve revealed in the market, D1, reflects only the private benefits of the good. Incorporating the external benefits of the good gives us the demand curve D2 that reflects the social benefit of the good. The market’s output of Qm units of the good falls short of the efficient level Qe. The government may seek to move the market solution toward the efficient level through subsidies or other measures to encourage the activity that creates the external benefit.
Finally, Panel (d) shows the case of imperfect competition. A firm facing a downward-sloping demand curve such as D1 will select the output Qm at which the marginal cost curve MC1 intersects the marginal revenue curve MR1. The government may seek to move the solution closer to the efficient level, defined by the intersection of the marginal cost and demand curves.
While it is important to recognize the potential gains from government intervention to correct market failure, we must recognize the difficulties inherent in such efforts. Government officials may lack the information they need to select the efficient solution. Even if they have the information, they may have goals other than the efficient allocation of resources. Each instance of government intervention involves an interaction with utility-maximizing consumers and profit-maximizing firms, none of whom can be assumed to be passive participants in the process. So, while the potential exists for improved resource allocation in cases of market failure, government intervention may not always achieve it.
The late George Stigler, winner of the Nobel Prize for economics in 1982, once remarked that people who advocate government intervention to correct every case of market failure reminded him of the judge at an amateur singing contest who, upon hearing the first contestant, awarded first prize to the second. Stigler’s point was that even though the market is often an inefficient allocator of resources, so is the government likely to be. Government may improve on what the market does; it can also make it worse. The choice between the market’s allocation and an allocation with government intervention is always a choice between imperfect alternatives. We will examine the nature of public sector choices later in this chapter and explore an economic explanation of why government intervention may fail to move market solutions closer to their efficient levels.
Irrational Behavior
The growing field of behavioral economicsAn area of economics that draws on psychology and neuroscience to understand how and why individuals make decisions.—an area of economics that draws on psychology and neuroscience to understand how and why individuals make decisions—has led to consideration of new areas for government policy. Using experiments and surveys, behavioral economists have found that people’s decisions are subject to cognitive limitations and biases, as well as to emotions, resulting in seemingly irrational choices. The information in this section is based largely on Richard H. Thaler and Sendhil Mullainathan, “Behavioral Economics” Concise Encyclopedia of Economics 2011 at http://www.econlib.org and Ian M. McDonald, “For the Student: Behavioral Economics,” Australian Economic Review 41(2) (2008): 222–228.
For example, 1955 Nobel Prize–winning economist Herbert Simon noted that people possess neither unlimited abilities nor unlimited time for processing information and hence may not solve all problems optimally. Instead they may resort to rules of thumb. They are being rational but their rationality is “bounded.” For example, a rule of thumb such as “you get what you pay for” may lead people to pay more for something when the cheaper version is just as good or better.
Behavioral economics has also found that people have bounded willpower (i.e., that they lack complete self-control and have a bias toward the present). Surprising? Hardly. Some people may eat, drink, or spend too much or exercise, save, or work too little. They may even be aware of their self-control problems and try to counter them. For example, they may choose to buy cigarettes by the pack instead of by the carton, which is cheaper; they may make New Year’s resolutions; they may have more of their salaries withheld than necessary in order to be sure they will get a tax refund so they can purchase goods they do not have the willpower to save for on their own.
Other findings suggest overconfidence (surveys show that 90% of people think they are among the top 50% in such areas as driving ability and health); loss aversion (getting extreme utility loss from negative outcomes that fall below a reference point and only mild utility increases from gains above the reference point); and over-reaction or under-reaction to information. Moreover, their errors persist—always thinking of themselves as above average in various areas despite evidence to the contrary and always putting off changes in behavior that they know would make them better off.
How might government policy be changed to help people make better decisions? One concrete proposal is for government to mandate that when employees become eligible for joining retirement plans, the default option would be signing them up instead of the more common approach of inviting them to do so. Though they could still opt out, studies have shown that a switch in the default option greatly increases participation in retirement plans. The change appears to reduce procrastination. The policy could be improved further by taking into account the notion of loss aversion. Building on studies that have shown that people are overly reluctant to sell stocks that have gone down in price because they do not want to have to admit the loss to themselves, Richard Thaler has suggested that employers not only switch the retirement plan default but additionally sign employees up for a plan that automatically increases their contribution rates, timed to coincide with any increases in salary they may be receiving. Never seeing a reduction in take-home pay, the employee avoids facing loss aversion.
But are people really being irrational? Perhaps an excess of optimism is good for mental health even if it leads one to make mistakes. Focusing on the present may beat out worrying about the future. Even if people are at times irrational, to what extent should government get involved? Most countries seem to have accepted that imposing speed limits and seat belt use is appropriate. Should sugary soft drinks be banned or at least taxed? Should government simply alert citizens to sign up for retirement plans or mandate companies to make signing up the default option?
To what extent should the model of homo economicus be altered to better understand economic outcomes? Will the extra dose of reality in looking at the way people make decisions contribute to or detract from the ability of economists to understand or explain economic outcomes? With the advent of new methods of testing, such as brain studies, these questions are likely to take center stage in coming years, both within and outside of the economics profession.
Income Redistribution
The proposition that a private market will allocate resources efficiently if the efficiency condition is met always comes with a qualification: the allocation of resources will be efficient given the initial distribution of income. If 5% of the people receive 95% of the income, it might be efficient to allocate roughly 95% of the goods and services produced to them. But many people (at least 95% of them!) might argue that such a distribution of income is undesirable and that the allocation of resources that emerges from it is undesirable as well.
There are several reasons to believe that the distribution of income generated by a private economy might not be satisfactory. For example, the incomes people earn are in part due to luck. Much income results from inherited wealth and thus depends on the family into which one happens to have been born. Likewise, talent is distributed in unequal measure. Many people suffer handicaps that limit their earning potential. Changes in demand and supply can produce huge changes in the values—and the incomes—the market assigns to particular skills. Given all this, many people argue that incomes should not be determined solely by the marketplace.
A more fundamental reason for concern about income distribution is that people care about the welfare of others. People with higher incomes often have a desire to help people with lower incomes. This preference is demonstrated in voluntary contributions to charity and in support of government programs to redistribute income.
A public goods argument can be made for government programs that redistribute income. Suppose that people of all income levels feel better off knowing that financial assistance is being provided to the poor and that they experience this sense of well-being whether or not they are the ones who provide the assistance. In this case, helping the poor is a public good. When the poor are better off, other people feel better off; this benefit is nonexclusive. One could thus argue that leaving private charity to the marketplace is inefficient and that the government should participate in income redistribution. Whatever the underlying basis for redistribution, it certainly occurs. The governments of every country in the world make some effort to redistribute income.
Experiments conducted by behavioral economists also provide insights into notions of fairness. In various versions of the “ultimatum game,” experimenters tell one player in the game to propose to give a share of an amount of money (say $10) to the other player. If the other player accepts the offer, both players keep their shares of the total. If the other player refuses the offer, both walk away with nothing.
If the responding player were selfish, he or she would accept any positive offer, and a selfish proposer would offer only a small amount, perhaps a penny or a nickel. In actual experiments, though, proposing players tend to offer about 40% of the total ($4 in this example) and responding players tend to reject offers of less than 20% ($2 in this example). The conclusion seems to hold even when substantial sums of money are used to play the game. Rejecting any offer that leaves both players better off seems irrational and suggests a concern for fairness.
Programs to redistribute income can be divided into two categories. One transfers income to poor people; the other transfers income based on some other criterion. A means-tested transfer paymentTransfer payment for which the recipient qualifies on the basis of income. is one for which the recipient qualifies on the basis of income; means-tested programs transfer income from people who have more to people who have less. The largest means-tested program in the United States is Medicaid, which provides health care to the poor. Other means-tested programs include Temporary Assistance to Needy Families (TANF) and food stamps. A non-means-tested transfer paymentTransfer payment for which income is not a qualifying factor. is one for which income is not a qualifying factor. Social Security, a program that taxes workers and their employers and transfers this money to retired workers, is the largest non-means-tested transfer program. Indeed, it is the largest transfer program in the United States. It transfers income from working families to retired families. Given that retired families are, on average, wealthier than working families, Social Security is a somewhat regressive program. Other non-means tested transfer programs include Medicare, unemployment compensation, and programs that aid farmers.
Figure 15.4 "Federal Transfer Payment Spending" shows federal spending on means-tested and non-means-tested programs as a percentage of GDP, the total value of output, since 1962. As the chart suggests, the bulk of income redistribution efforts in the United States are non-means-tested programs.
Figure 15.4 Federal Transfer Payment Spending
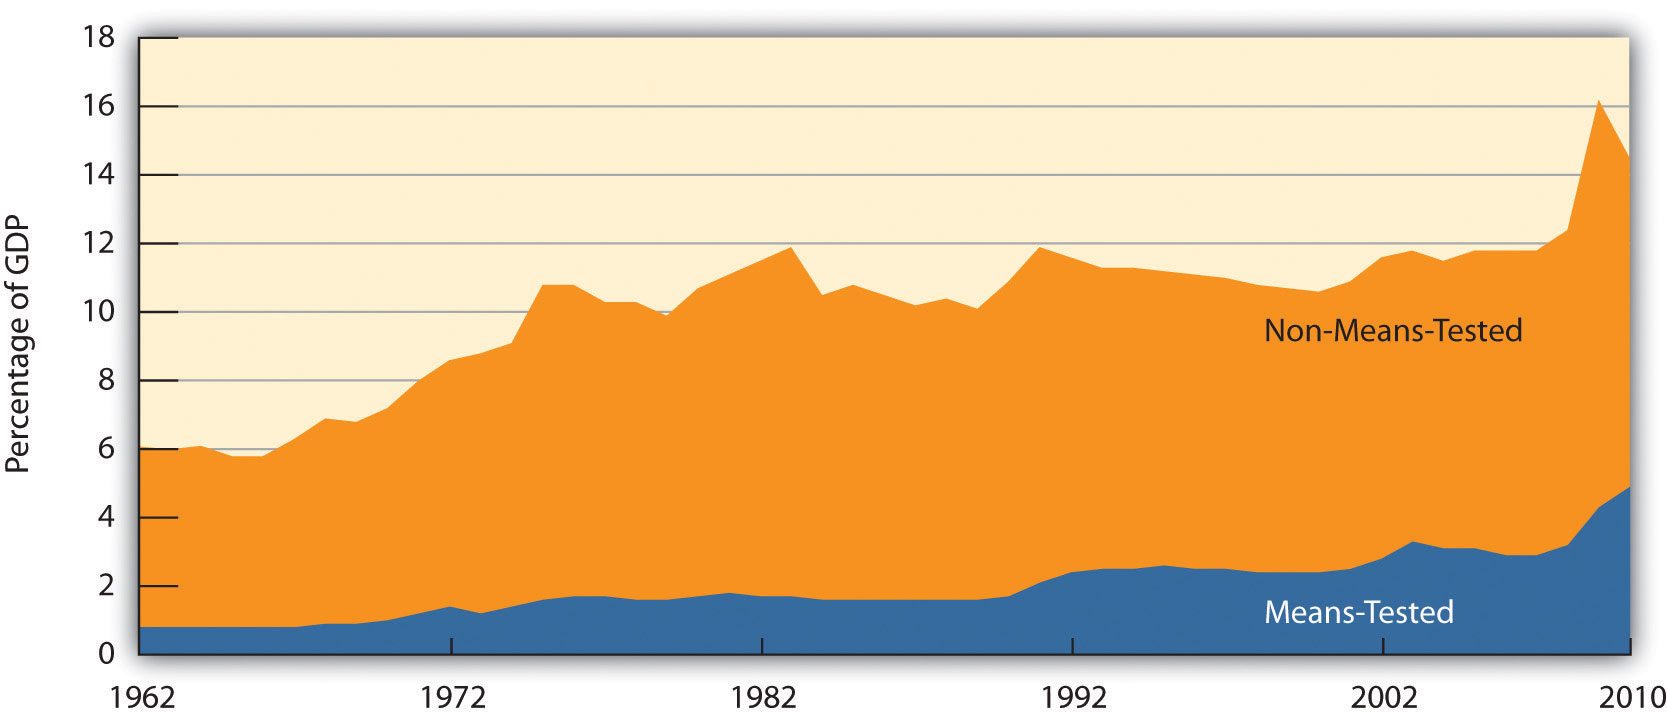
The chart shows federal means-tested and non-means-tested transfer payment spending as a percentage of GDP from 1962–2010.
Source: Congressional Budget Office, The Budget and Economic Outlook: Fiscal Years 2004–2013 (January 2003), Table F-10 for 1962–2002; thereafter Congressional Budget Office, The Budget and Economic Outlook: Fiscal Years 2011 to 2021 (January 2011), Table E-10 with means-tested as medicaid plus income security and non-means-tested everything else.
The fact that most transfer payments in the United States are not means-tested leads to something of a paradox: some transfer payments involve taxing people whose incomes are relatively low to give to people whose incomes are relatively high. Social Security, for example, transfers income from people who are working to people who have retired. But many retired people enjoy higher incomes than working people in the United States. Aid to farmers, another form of non-means-tested payments, transfers income to farmers, who on average are wealthier than the rest of the population. These situations have come about because of policy decisions, which we discuss later in the chapter.
Key Takeaways
- One role of government is to correct problems of market failure associated with public goods, external costs and benefits, and imperfect competition.
- Government intervention to correct market failure always has the potential to move markets closer to efficient solutions and thus reduce deadweight losses. There is, however, no guarantee that these gains will be achieved.
- Experiments and surveys undertaken by behavioral economists suggest that consumers may not always make rational decisions. Thus, governments may seek to alter the provision of certain goods and services or the amounts consumed based on the notion that consumers will otherwise consume too much or too little of the goods.
- Governments redistribute income through transfer payments. Such redistribution often goes from people with higher incomes to people with lower incomes, but other transfer payments go to people who are relatively better off.
Try It!
Here is a list of actual and proposed government programs. Each is a response to one of the justifications for government activity described in the text: correction of market failure (due to public goods, external costs, external benefits, or imperfect competition); encouragement or discouragement of consumption due to consumers not making rational choices; and redistribution of income. In each case, identify the source of demand for the activity described.
- The Justice Department sought to prevent Microsoft Corporation from releasing Windows ’98, arguing that the system’s built-in Internet browser represented an attempt by Microsoft to monopolize the market for browsers.
- In 2004, Congress considered a measure that would extend taxation of cigarettes to vendors that sell cigarettes over the Internet.
- The federal government engages in research to locate asteroids that might hit the earth, and studies how impacts from asteroids could be prevented.
- The federal government increases spending for food stamps for people whose incomes fall below a certain level.
- The federal government increases benefits for recipients of Social Security.
- The Environmental Protection Agency sets new standards for limiting the emission of pollutants into the air.
- A state utilities commission regulates the prices charged by utilities that provide natural gas to homes and businesses.
Case in Point: Externalities, Irrationalities, and Smoking

© 2010 Jupiterimages Corporation
Smokers impose tremendous costs on themselves. Based solely on the degree to which smoking shortens their life expectancy, the cost per pack of cigarettes is estimated to be $35.64. That cost, of course, is a private cost. In addition to that private cost, smokers impose costs on others. Those external costs come in three ways. First, they increase health care costs and thus increase health insurance premiums. Second, smoking causes fires that destroy property. Third, other people die each year as a result of secondhand smoke. Various estimates of these external costs put them at about $.40 per pack. If a tax were to be based solely on external effects, one would also need to recognize that smokers also generate external benefits. They contribute to retirement programs and to Social Security and then die sooner than nonsmokers. They thus subsidize the retirement programs of the rest of the population. So from the perspective of externalities, the optimal tax would be less than $.40 per pack.
Cigarette taxes, though, are much higher than that. Should they be? Is that fair? One rationale is simply that “sin” taxes are a source of government revenue. Economists Jonathan Gruber and Botond Koszegi suggest something else—that an excise tax on cigarettes of as much as $4.76 per pack may actually improve the welfare of smokers. Smokers, they argue, are “time-inconsistent.” Lacking self-control or willpower, they seek the immediate gratification of a cigarette and then regret their decisions later. Higher taxes would serve to reduce the quantity of cigarettes demanded and thus reduce behavior smokers would otherwise regret. Their argument is that smokers impose “internalities” on themselves and that higher taxes would reduce this.
Where does this lead us? If smokers are “rationally addicted” to smoking (i.e., they have weighed the benefits and costs of smoking and have chosen to smoke), then the only program for public policy is to design a tax that takes into account the net external costs of smoking. Current excise taxes on cigarettes seem to more than accomplish that. But if the decision to smoke is an irrational one, welfare may be improved by higher excise taxes on smoking.
In a study titled, “Do Cigarette Taxes Make Smokers Happier,” Gruber and Sendhil Mullainathan used self-reported happiness measures and variations in cigarette excise taxes across states to see the effect of excise taxes on happiness of people who have a propensity to smoke. They found that people with a propensity to smoke were significantly happier with higher cigarette excise taxes. This finding, they argue, is more consistent with a model based on bounded willpower and time inconsistency than one based on rational addiction.
Sources: Jonathan Gruber and Botond Koszegi, “Tax Incidence When Individuals Are Time-Inconsistent: The Case of Cigarette Excise Taxes,” Journal of Public Economics 88 (2004); 1959–1987; Jonathan H. Gruber and Sendhil Mullainathan, “Do Cigarette Taxes Make Smokers Happier?” Journal of Economic Analysis and Policy: Advances in Economic Policy 5:1 (2005): 1–45.
Answers to Try It! Problems
- This is an attempt to deal with monopoly, so it is a response to imperfect competition.
- Cigarette consumption may result from an irrational decision.
- Protecting the earth from such a calamity is an example of a public good.
- Food Stamps are a means-tested program to redistribute income.
- Social Security is an example of a non-means-tested income redistribution program.
- This is a response to external costs.
- This is a response to monopoly, so it falls under the imperfect competition heading.
15.2 Financing Government
Learning Objectives
- Explain the ability-to-pay and the benefits-received principles of taxation.
- Distinguish among regressive, proportional, and progressive taxes.
- Define tax incidence analysis and explain and illustrate the conditions under which the burden of an excise tax falls mainly on buyers or sellers.
If government services are to be provided, people must pay for them. The primary source of government revenue is taxes. In this section we examine the principles of taxation, compare alternative types of taxes, and consider the question of who actually bears the burden of taxes.
In addition to imposing taxes, governments obtain revenue by charging user feesFees levied on consumers of government-provided services., which are fees levied on consumers of government-provided services. The tuition and other fees charged by public universities and colleges are user fees, as are entrance fees at national parks. Finally, government agencies might obtain revenue by selling assets or by holding bonds on which they earn interest.
Principles of Taxation
Virtually anything can be taxed, but what should be taxed? Are there principles to guide us in choosing a system of taxes?
Jean-Baptiste Colbert, a minister of finance in seventeenth-century France, is generally credited with one of the most famous principles of taxation:
“The art of taxation consists in so plucking the goose as to obtain the largest possible amount of feathers with the smallest possible amount of hissing.”
Economists, who do not typically deal with geese, cite two criteria for designing a tax system. The first is based on the ability of people to pay taxes and the second focuses on the benefits they receive from particular government services.
Ability to Pay
The ability-to-pay principlePrinciple that holds that people with more income should pay more taxes. holds that people with more income should pay more taxes. As income rises, the doctrine asserts, people are able to pay more for public services; a tax system should therefore be constructed so that taxes rise too. Wealth, the total of assets less liabilities, is sometimes used as well as income as a measure of ability to pay.
The ability-to-pay doctrine lies at the heart of tax systems that link taxes paid to income received. The relationship between taxes and income may take one of three forms: taxes can be regressive, proportional, or progressive.
Regressive Tax
A regressive taxA tax that takes a higher percentage of income as income falls. is one that takes a higher percentage of income as income falls. Taxes on cigarettes, for example, are regressive. Cigarettes are an inferior good—their consumption falls as incomes rise. Thus, people with lower incomes spend more on cigarettes than do people with higher incomes. The cigarette taxes paid by low-income people represent a larger share of their income than do the cigarette taxes paid by high-income people and are thus regressive.
Proportional Tax
A proportional taxTax that takes a fixed percentage of income, no matter what the level of income. is one that takes a fixed percentage of income. Total taxes rise as income rises, but taxes are equal to the same percentage no matter what the level of income. Some people argue that the U.S. income tax system should be changed into a flat tax system, a tax that would take the same percentage of income from all taxpayers. Such a tax would be a proportional tax.
Progressive Tax
A progressive taxA tax that takes a higher percentage of income as income rises. is one that takes a higher percentage of income as income rises. The federal income tax is an example of a progressive tax. Table 15.1 "Federal Income Tax Brackets, 2011" shows federal income tax rates for various brackets of income for a married couple in 2011. As shown in the table, at higher income levels, couples faced a higher percentage tax rate. Any income over $379,150, for example, was taxed at a rate of 35%.
Table 15.1 Federal Income Tax Brackets, 2011
| 2011 adjusted gross income (married couple) | Personal income tax rate applied to bracket |
|---|---|
| Less than $17,000 | 10% |
| 17,000–$69,000 | 15% |
| $69,000–139,350 | 25% |
| $139,350–$212,300 | 28% |
| $212,300–$379,150 | 33% |
| Greater than $379,150 | 35% |
The federal income tax is progressive. The percentage tax rate rises as adjusted gross income rises.
While a pure flat tax would be proportional, most proposals for such a tax would exempt some income from taxation. Suppose, for example, that households paid a “flat” tax of 20% on all income over $40,000 per year. This tax would be progressive. A household with an income of $25,000 per year would pay no tax. One with an income of $50,000 per year would pay a tax of $2,000 (.2 times $10,000), or 4% of its income. A household with an income of $100,000 per year would pay a tax of $12,000 (.2 times $60,000) per year, or 12% of its income. A flat tax with an income exemption would thus be a progressive tax.
Benefits Received
An alternative criterion for establishing a tax structure is the benefits-received principlePrinciple that holds that a tax should be based on the benefits received from the government services funded by the tax., which holds that a tax should be based on the benefits received from the government services funded by the tax.
Local governments rely heavily on taxes on property, in large part because the benefits of many local services, including schools, streets, and the provision of drainage for wastewater, are reflected in higher property values. Suppose, for example, that public schools in a particular area are especially good. People are willing to pay more for houses served by those schools, so property values are higher; property owners benefit from better schools. The greater their benefit, the greater the property tax they pay. The property tax can thus be viewed as a tax on benefits received from some local services.
User fees for government services apply the benefits-received principle directly. A student paying tuition, a visitor paying an entrance fee at a national park, and a motorist paying a highway toll are all paying to consume a publicly provided service; they are thus paying directly for something from which they expect to benefit. Such fees can be used only for goods for which exclusion is possible; a user fee could not be applied to a service such as national defense.
Income taxes to finance public goods may satisfy both the ability-to-pay and benefits-received principles. The demand for public goods generally rises with income. Thus, people with higher incomes benefit more from public goods. The benefits-received principle thus suggests that taxes should rise with income, just as the ability-to-pay principle does. Consider, for example, an effort financed through income taxes by the federal government to clean up the environment. People with higher incomes will pay more for the cleanup than people with lower incomes, consistent with the ability-to-pay principle. Studies by economists consistently show that people with higher incomes have a greater demand for environmental improvement than do people with lower incomes—a clean environment is a normal good. Requiring people with higher incomes to pay more for the cleanup can thus be justified on the benefits-received principle as well.
Certainly taxes cannot respond precisely to benefits received. Neither the ability-to-pay nor the benefits-received doctrine gives us a recipe for determining just what each person “should” pay in taxes, but these doctrines give us a framework for thinking about the justification for particular taxes.
Types of Taxes
Figure 15.5 Sources of Government Revenue
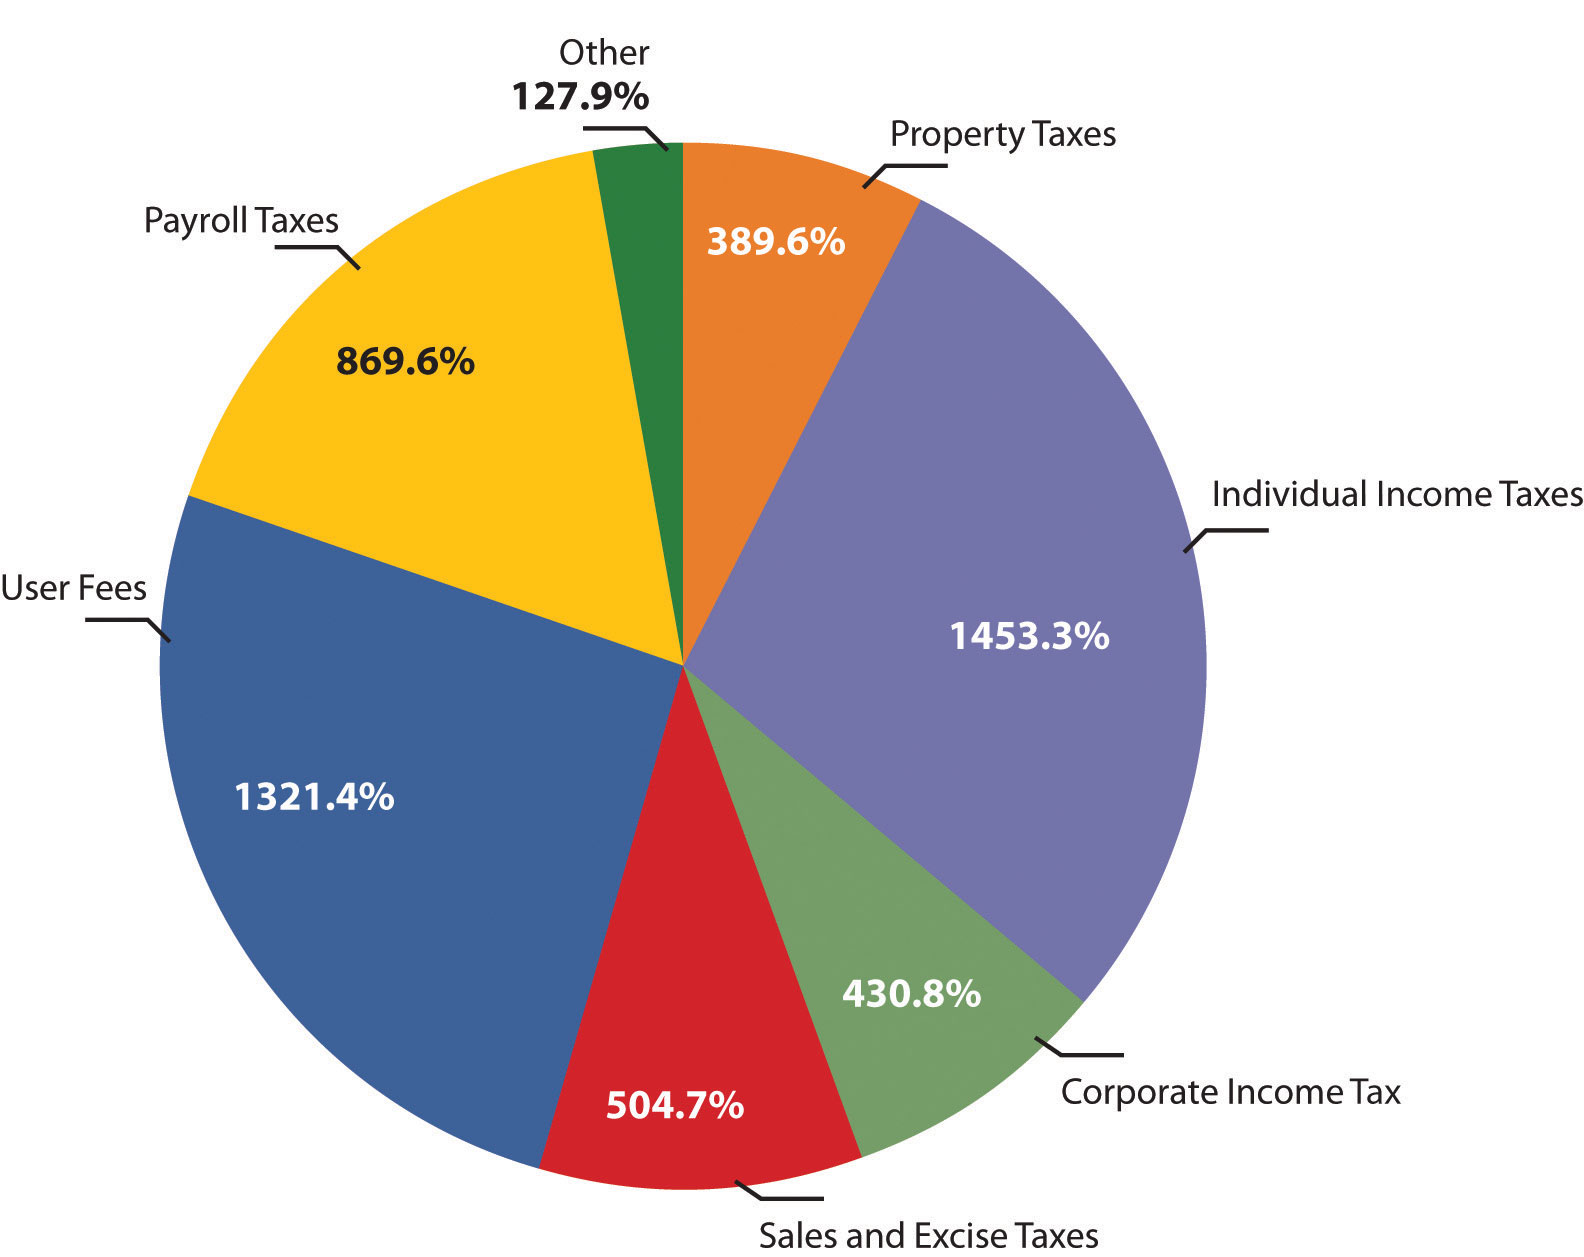
The chart shows sources of revenue for federal, state, and local governments in the United States. The data omit revenues from government-owned utilities and liquor stores. All figures are in billions of dollars. Data are for 2007.
Source: U.S. Bureau of the Census, Statistical Abstract of US, 2011 (online) Tables 434 and 473.
It is hard to imagine anything that has not been taxed at one time or another. Windows, closets, buttons, junk food, salt, death—all have been singled out for special taxes. In general, taxes fall into one of four primary categories. Income taxesTaxes imposed on the income earned by a person or firm. are imposed on the income earned by a person or firm; property taxesTaxes imposed on assets. are imposed on assets; sales taxesTaxes imposed on the value of goods sold. are imposed on the value of goods sold; and excise taxesTaxes imposed on specific goods or services. are imposed on specific goods or services. Figure 15.5 "Sources of Government Revenue" shows the major types of taxes financing all levels of government in the United States.
Personal Income Taxes
The federal personal income tax is the largest single source of tax revenue in the United States; most states and many cities tax income as well. All income tax systems apply a variety of exclusions to a taxpayer’s total income before arriving at taxable incomeThe amount of income that is actually subject to any tax., the amount of income that is actually subject to the tax. In the U.S. federal income tax system, for example, a family deducted several thousand dollars for each member of the family as part of its computation of taxable income.
Income taxes can be structured to be regressive, proportional, or progressive. Income tax systems in use today are progressive.
In analyzing the impact of a progressive tax system on taxpayer choice, economists focus on the marginal tax rateThe tax rate that would apply to an additional $1 of taxable income earned.. This is the tax rate that would apply to an additional $1 of taxable income earned. Suppose an individual was earning taxable income of $8,000 and paid federal income taxes of $800, or 10% of taxable income (ignoring exemptions that would eliminate taxes for such an individual). Suppose the next tax bracket of 15% starts at $8,001 and the taxpayer were to receive $100 more of taxable income. That $100 would be taxed at a rate of 15%. That person thus faces a marginal tax rate of 15%.
Economists argue that choices are made at the margin; it is thus the marginal tax rate that is most likely to affect decisions. Say that the individual in our example is considering taking on additional work that would increase his or her income to $15,000 per year. With a marginal tax rate of 15%, the individual would keep $5,950 of the additional $7,000 earned. It is that $5,950 that the individual will weigh against the opportunity cost in forgone leisure in deciding whether to do the extra work.
Property Taxes
Property taxes are taxes imposed on assets. Local governments, for example, generally impose a property tax on business and personal property. A government official (typically a local assessor) determines the property’s value, and a proportional tax rate is then applied to that value.
Property ownership tends to be concentrated among higher income groups; economists generally view property taxes as progressive. That conclusion, however, rests on assumptions about who actually pays the tax, an issue examined later in this chapter.
Sales Taxes
Sales taxes are taxes imposed as a percentage of firms’ sales and are generally imposed on retail sales. Some items, such as food and medicine, are often exempted from sales taxation.
People with lower incomes generally devote a larger share of their incomes to consumption of goods covered by sales taxes than do people with higher incomes. Sales taxes are thus likely to be regressive.
Excise Taxes
An excise tax is imposed on specific items. In some cases, excise taxes are justified as a way of discouraging the consumption of demerit goods, such as cigarettes and alcoholic beverages. In other cases, an excise tax is a kind of benefits-received tax. Excise taxes on gasoline, for example, are typically earmarked for use in building and maintaining highways, so that those who pay the tax are the ones who benefit from the service provided.
The most important excise tax in the United States is the payroll tax imposed on workers’ earnings. The proceeds of this excise on payrolls finance Social Security and Medicare benefits. Most U.S. households pay more in payroll taxes than in any other taxes.
Tax Incidence Analysis
Next time you purchase an item at a store, notice the sales tax imposed by your state, county, and city. The clerk rings up the total, then adds up the tax. The store is the entity that “pays” the sales tax, in the sense that it sends the money to the government agencies that imposed it, but you are the one who actually foots the bill—or are you? Is it possible that the sales tax affects the price of the item itself?
These questions relate to tax incidence analysisA type of economic analysis that seeks to determine where the actual burden of a tax rests., a type of economic analysis that seeks to determine where the actual burden of a tax rests. Does the burden fall on consumers, workers, owners of capital, owners of natural resources, or owners of other assets in the economy? When a tax imposed on a good or service increases the price by the amount of the tax, the burden of the tax falls on consumers. If instead it lowers wages or lowers prices for some of the other factors of production used in the production of the good or service taxed, the burden of the tax falls on owners of these factors. If the tax does not change the product’s price or factor prices, the burden falls on the owner of the firm—the owner of capital. If prices adjust by a fraction of the tax, the burden is shared.
Figure 15.6 "Tax Incidence in the Model of Demand and Supply" gives an example of tax incidence analysis. Suppose D1 and S1 are the demand and supply curves for beef. The equilibrium price is $3 per pound; the equilibrium quantity is 3 million pounds of beef per day. Now suppose an excise tax of $2 per pound of beef is imposed. It does not matter whether the tax is levied on buyers or on sellers of beef; the important thing to see is that the tax drives a $2 per pound “wedge” between the price buyers pay and the price sellers receive. This tax is shown as the vertical green line in the exhibit; its height is $2.
Figure 15.6 Tax Incidence in the Model of Demand and Supply
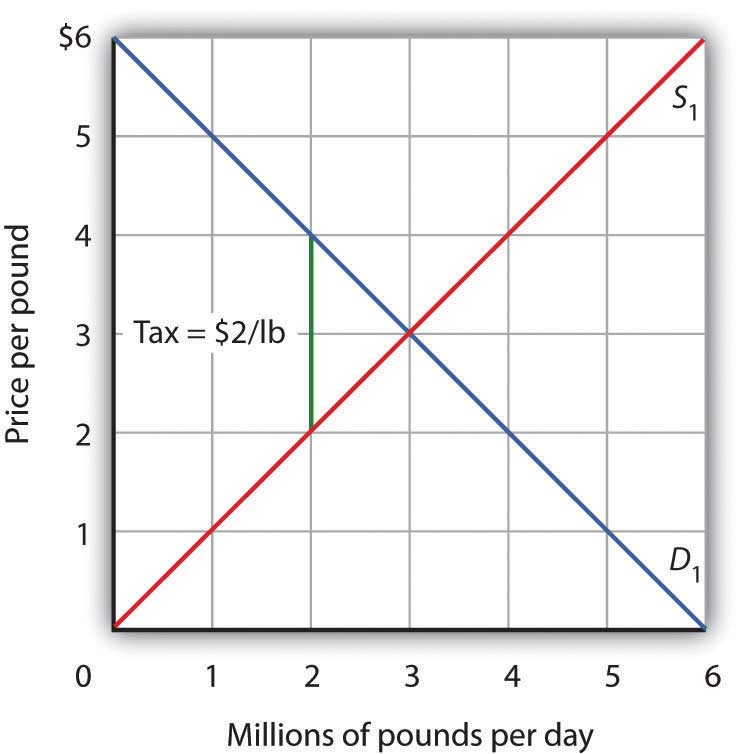
Suppose the market price of beef is $3 per pound; the equilibrium quantity is 3 million pounds per day. Now suppose an excise tax of $2 per pound is imposed, shown by the vertical green line. We insert this tax wedge between the demand and supply curves. It raises the market price to $4 per pound, suggesting that buyers pay half the tax in the form of a higher price. Sellers receive a price of $2 per pound; they pay half the tax by receiving a lower price. The equilibrium quantity falls to 2 million pounds per day.
We insert our tax “wedge” between the demand and supply curves. In our example, the price paid by buyers rises to $4 per pound. The price received by sellers falls to $2 per pound; the other $2 goes to the government. The quantity of beef demanded and supplied falls to 2 million pounds per day. In this case, we conclude that buyers bear half the burden of the tax (the price they pay rises by $1 per pound), and sellers bear the other half (the price they receive falls by $1 per pound). In addition to the change in price, a further burden of the tax results from the reduction in consumer and in producer surplus. We have not shown this reduction in the graph.
Figure 15.7 "Tax Incidence and the Elasticity of Demand and of Supply" shows how tax incidence varies with the relative elasticities of demand and supply. All four panels show markets with the same initial price, P1, determined by the intersection of demand D1 and supply S1. We impose an excise tax, given by the vertical green line. As before, we insert this tax wedge between the demand and supply curves. We assume the amount of the tax per unit is the same in each of the four markets.
Figure 15.7 Tax Incidence and the Elasticity of Demand and of Supply
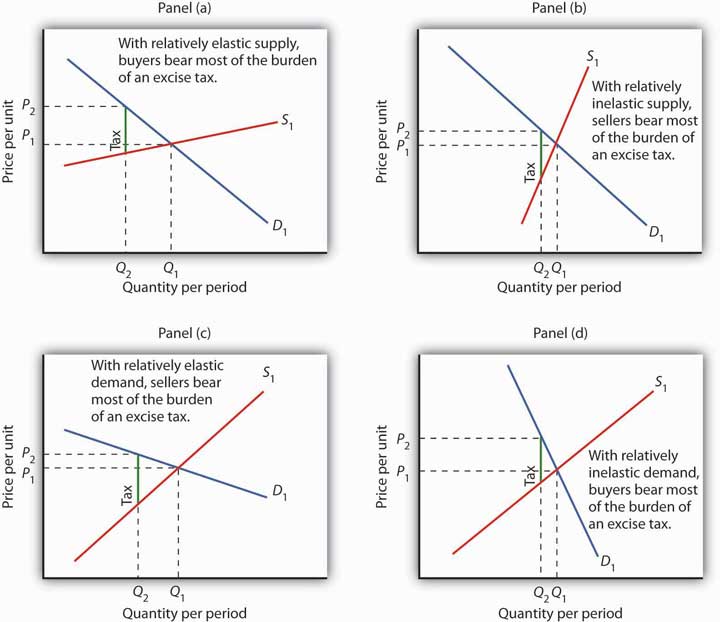
We show the effect of an excise tax, given by the vertical green line, in the same way that we did in Figure 15.6 "Tax Incidence in the Model of Demand and Supply". We see that buyers bear most of the burden of such a tax in cases of relatively elastic supply (Panel (a)) and of relatively inelastic demand (Panel (d)). Sellers bear most of the burden in cases of relatively inelastic supply (Panel (b)) and of relatively elastic demand (Panel (c)).
In Panel (a), we have a market with a relatively elastic supply curve S1. When we insert our tax wedge, the price rises to P2; the price increase is nearly as great as the amount of the tax. In Panel (b), we have the same demand curve as in Panel (a), but with a relatively inelastic supply curve S2. This time the price paid by buyers barely rises; sellers bear most of the burden of the tax. When the supply curve is relatively elastic, the bulk of the tax burden is borne by buyers. When supply is relatively inelastic, the bulk of the burden is borne by sellers.
Panels (c) and (d) of the exhibit show the same tax imposed in markets with identical supply curves S1. With a relatively elastic demand curve D1 in Panel (c) (notice that we are in the upper half, that is, the elastic portion of the curve), most of the tax burden is borne by sellers. With a relatively inelastic demand curve D1 in Panel (d) (notice that we are in the lower half, that is, the inelastic portion of the curve), most of the burden is borne by buyers. If demand is relatively elastic, then sellers bear more of the burden of the tax. If demand is relatively inelastic, then buyers bear more of the burden.
Table 15.2 "Federal Tax Burdens in the United States (All Numbers in %)" provides an estimate of the federal tax burden for different quintiles (groups containing 20% of the population) of the U.S. population and for different taxes, based on estimates of who bears the burden of a tax, not on who pays the tax. For example, studies argue that, even though businesses pay half of the payroll taxes, the burden of payroll taxes actually falls on households. The reason is that the supply curve of labor is relatively inelastic, as shown in Panel (b) of Figure 15.7 "Tax Incidence and the Elasticity of Demand and of Supply". Taking these adjustments into account, the table shows progressivity in federal taxes overall but that the payroll tax is regressive while the other types of taxes are progressive.
Table 15.2 Federal Tax Burdens in the United States (All Numbers in %)
| Cash Income Percentile | Individual Income Tax | Payroll Tax | Corporate Income Tax | Estate Tax | Effective Federal Tax Rate, 2011 |
|---|---|---|---|---|---|
| Lowest quintile | −5.7 | 6.2 | 0.4 | * | 0.8 |
| Second quintile | −2.8 | 8.1 | 0.5 | * | 5.8 |
| Middle quintile | 3.2 | 8.8 | 0.5 | * | 12.5 |
| Fourth quintile | 7.0 | 8.9 | 0.7 | * | 16.6 |
| Highest quintile | 14.0 | 5.6 | 3.2 | 0.2 | 23.1 |
| All quintiles | 9.0 | 7.0 | 2.0 | 0.1 | 18.1 |
| *Less than 0.05 | |||||
In a regressive tax system, people in the lowest quintiles face the highest tax rates. A proportional system imposes the same rates on everyone; a progressive system imposes higher rates on people in higher deciles. The table gives estimates of the burden on each quintile of federal taxes in 2011. As you can see, the tax structure in the United States is progressive.
Source: Urban-Brookings Tax Policy Center Microsimulation Model (version 0411-2), preliminary results, August 24, 2011, at http://www.taxpolicycenter.org.
Key Takeaways
- The primary principles of taxation are the ability-to-pay and benefits-received principles.
- The percentage of income taken by a regressive tax rises as income falls. A proportional tax takes a constant percentage of income regardless of income level. A progressive tax takes a higher percentage of income as taxes as incomes rise.
- The marginal tax rate is the tax rate that applies to an additional dollar of income earned.
- Tax incidence analysis seeks to determine who ultimately bears the burden of a tax.
- The major types of taxes are income taxes, sales taxes, property taxes, and excise taxes.
- Buyers bear most of the burden of an excise tax when supply is relatively elastic and when demand is relatively inelastic; sellers bear most of the burden when supply is relatively inelastic and when demand is relatively elastic.
- The federal tax system in the United States is progressive.
Try It!
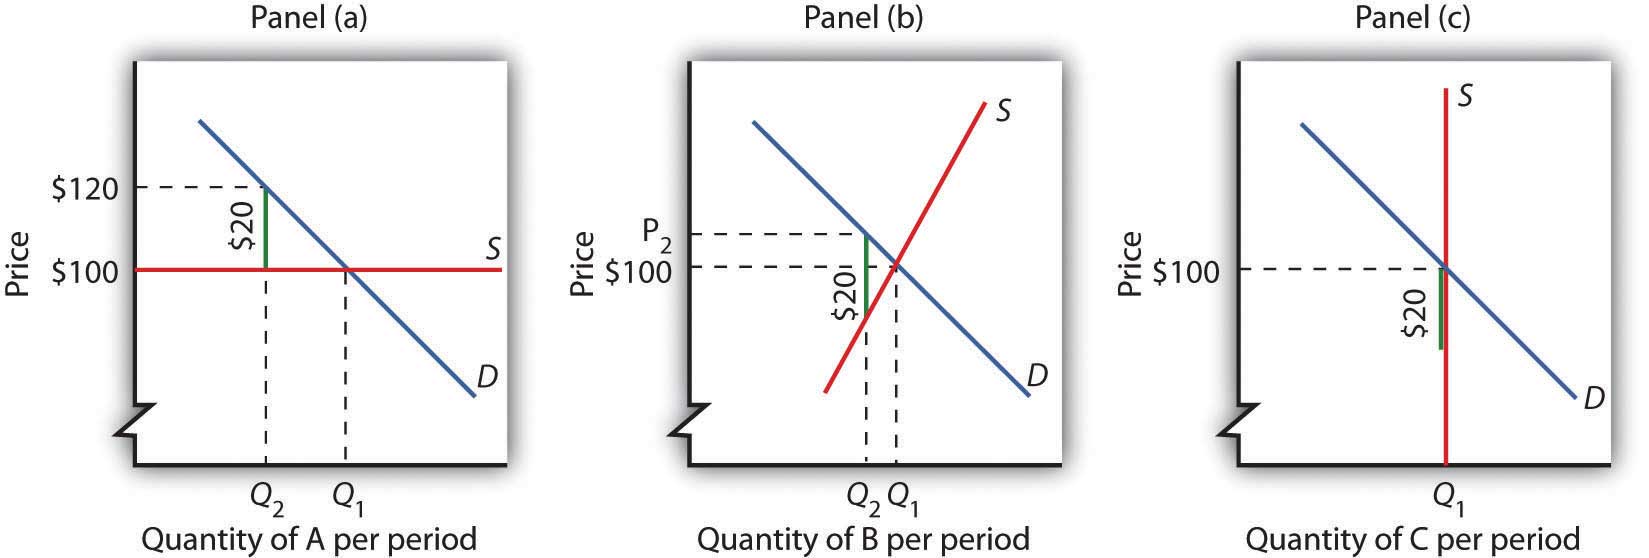
Consider three goods, A, B, and C. The prices of all three goods are determined by demand and supply (that is, the three industries are perfectly competitive) and equal $100. The supply curve for good A is perfectly elastic; the supply curve for good B is a typical, upward-sloping curve; and the supply curve for good C is perfectly inelastic. Suppose the federal government imposes a tax of $20 per unit on suppliers of each good. Explain and illustrate graphically how the tax will affect the price of each good in the short run. Show whether the equilibrium quantity will rise, fall, or remain unchanged. Who bears the burden of the tax on each good in the short run? (Hint: Review the chapter on the elasticity for a discussion of perfectly elastic and perfectly inelastic supply curves; remember that the tax increases variable cost by $20 per unit.)
Case in Point: What Are Marginal Tax Rates?
© 2010 Jupiterimages Corporation
We speak often of the importance of tax rates at the margin—of how much of an extra dollar earned through labor or interest on saving will be kept by the decision-maker. It turns out, however, that figuring out just what that marginal tax rate is is not an easy task.
Consider the difficulty of untangling just what those marginal tax rates are. First, Americans face a bewildering complex of taxes. They all face the federal income tax. Each state—and many cities—levy additional taxes on income. Then there is the FICA payroll tax, federal and state corporate income taxes, and excise taxes, as well as federal, state, and local sales taxes. A person trying to figure out his or her marginal tax rate cannot stop there. Gaining an additional dollar of income will affect not only taxes but eligibility for various transfer payment programs in the level of payments the individual or household can expect to receive. Given the enormous complexity involved, it is safe to say that no one really knows what his or her marginal rate is.
Economists Laurence J. Kotlikoff and David Rapson of Boston University have taken on the task of sorting out marginal tax rates for the United States. They used a commercial tax analysis program, Economic Security Planner™, and added their own computer programs to incorporate the effect of additional income on various transfer payment programs. Their analysis assumed the taxpayer lived in Massachusetts, but the general tenor of their results applies to people throughout the United States.
Consider a 60-year-old couple earning $10,000 per year. That couple is eligible for a variety of welfare programs. With food stamps, there is a dollar-for-dollar reduction in aid for each additional dollar of income earned. In effect, the couple faces an effective marginal tax rate of 100%. Considering all other taxes and welfare programs, the economists concluded that the couple faced a marginal tax rate of about 50% on labor income. Overall, they found that a pattern of marginal rates for various ages and income levels could be described in a single word: “bizarre.”
The tables below give the economists’ estimates of marginal rates for current year labor supply for a single individual and for couples with children at various incomes and ages. While the overall structure of taxes in the United States is progressive, the special treatment of welfare programs can add a strong element of regressivity.
| Marginal Net Tax Rates on Current-Year Labor Supply (Couples, percentages) | |||||
|---|---|---|---|---|---|
| Total Annual Household Earnings (000s) | |||||
| Age | 10 | 20 | 30 | 50 | 75 |
| 30 | −14.2 | 42.5 | 42.3 | 24.4 | 36.9 |
| 45 | −11.4 | 41.7 | 41.8 | 35.8 | 36.1 |
| 60 | 50.9 | 32.0 | 36.3 | 36.3 | 45.5 |
| Age | 100 | 150 | 200 | 300 | 500 |
| 30 | 37.0 | 45.9 | 36.8 | 43.9 | 44.0 |
| 45 | 36.1 | 45.1 | 35.9 | 40.0 | 43.2 |
| 60 | 45.5 | 47.7 | 43.2 | 45.8 | 45.0 |
Source: Laurence J. Kotlikoff and David Rapson, “Does It Pay, At the Margin, to Work and Save?” NBER Tax Policy & the Economy, 2007, 21(1): 83–143. The tables shown here are Tables 4.2 and 4.3 in the article.
| Marginal Net Tax Rates on Current-Year Labor Supply (Individuals, percentages) | |||||
|---|---|---|---|---|---|
| Total Annual Household Earnings (000s) | |||||
| Age | 10 | 20 | 30 | 50 | 75 |
| 30 | 72.3 | 42.9 | 42.9 | 37.0 | 37.0 |
| 45 | −0.8 | 42.9 | 42.6 | 37.0 | 36.1 |
| 60 | 39.5 | 37.3 | 37.7 | 46.4 | 45.5 |
| Age | 125 | 150 | 200 | 250 | |
| 30 | 36.2 | 36.9 | 42.0 | 41.5 | |
| 45 | 36.1 | 36.5 | 42.0 | 41.5 | |
| 60 | 38.8 | 44.0 | 45.0 | 44.0 | |
Look again at our 60-year-old couple. It faces a very high marginal tax rate. A younger couple with the same income actually faces a negative marginal tax rate—increasing its labor income by a dollar actually increases its after-tax income by more than a dollar. Why the difference? The economists assumed that the younger couple would have children and thus qualify for a variety of programs, including the Earned Income Tax Credit. The couple at age 60 still faces the dollar-for-dollar reduction in payments in the Food Stamp program. No one designed these marginal incentives. They simply emerge from the bewildering mix of welfare and tax programs households face.
Answer to Try It! Problem
The tax adds a $20 wedge between the price paid by buyers and received by sellers. In Panel (a), the price rises to $120; the entire burden is borne by buyers. In Panel (c), the price remains $100; sellers receive just $80. Therefore, sellers bear the burden of the tax. In Panel (b), the price rises by less than $20, and the burden is shared by buyers and sellers. The relative elasticities of demand and supply determine whether the tax is borne primarily by buyers or sellers, or shared equally by both groups.
15.3 Choices in the Public Sector
Learning Objectives
- Compare public interest theory and public choice theory.
- Use public choice theory to explain rational abstention and why legislative choices may serve special interests.
How are choices made in the public sector? This section examines two perspectives on public sector choice. The first is driven by our examination of market failure. Choices in the public sector are a matter of locating problems of market failure, determining the efficient solution, and finding ways to achieve it. This approach, called the public interest theoryTheory that assumes that the goal of government is to seek an efficient allocation of resources. of government, assumes that the goal of government is to seek an efficient allocation of resources.
An alternative approach treats public sector choices like private sector choices. The body of economic thought based on the assumption that individuals involved in public sector choices make those choices to maximize their own utility is called public choice theoryBody of economic thought based on the assumption that individuals involved in public sector choices make those choices to maximize their own utility.. Public choice theory argues that individuals in the public sector make choices that maximize their utility—whether as voters, politicians, or bureaucrats, people seek solutions consistent with their self-interest. People who operate business firms may try to influence public sector choices to increase the profits of their firms. The effort to influence public choices to advance one’s own self-interest is called rent-seeking behaviorThe effort to influence public choices to advance one’s own self-interest..
Public Interest Theory
In the approach to the analysis of public sector choices known as public interest theory, decision making is a technical matter. The task of government officials is to locate the efficient solution and find a way to move the economy to that point.
For a public good, the efficient solution occurs where the demand curve that reflects social benefits intersects the supply curve for producing the good; that is, the solution at quantity Qe and price P1 given in Panel (a) of Figure 15.3 "Correcting Market Failure" Because this demand curve for a public good is not revealed in the market, the task for government officials is to find a way to estimate these curves and then to arrange for the production of the optimum quantity. For this purpose, economists have developed an approach called cost-benefit analysisA type of economic analysis that seeks to quantify the costs and benefits of an activity., which seeks to quantify the costs and benefits of an activity. Public officials can use cost-benefit analysis to try to locate the efficient solution. In general, the efficient solution occurs where the net benefit of the activity is maximized.
Public sector intervention to correct market failure presumes that market prices do not reflect the benefits and costs of a particular activity. If those prices are generated by a market that we can regard as perfectly competitive, then the failure of prices to convey information about costs or benefits suggests that there is a free-rider problem on the demand side or an external cost problem on the supply side. In either case, it is necessary to estimate costs or benefits that are not revealed in the marketplace.
The public interest perspective suggests an approach in which policy makers identify instances of potential market failure and then look for ways to correct them. Public choice theory instead looks at what motivates the people making those policy choices.
The Public Choice Perspective
Public choice theory discards the notion that people in the public sector seek to maximize net benefits to society as a whole. Rather, it assumes that each participant in the public sector seeks to maximize his or her own utility. This section introduces the flavor of the public choice approach by examining two of its more important conclusions: that many people will abstain from voting, and that legislative choices are likely to serve special interests.
Economics and Voting: The Rational Abstention Problem
Public choice theory argues that individuals do not leave their self-interests behind when they enter the voting booth—or even when they are thinking about whether to go to the voting booth. The assumption of utility maximization by voters helps us to understand why most people do not vote in most elections.
Suppose your state is about to hold a referendum on expanded support for state recreation areas, to be financed by an increase in the state sales tax. Given your own likely use of these areas and the way in which you expect to be affected by the tax, you estimate that you will be better off if the program passes. In fact, you have calculated that the present value of your net benefits from the program is $1,000. Will you vote?
As a utility maximizer, you will vote if the marginal benefits to you of voting exceed the marginal costs. One benefit of voting is the possibility that your vote will cause the measure to be passed. That would be worth $1,000 to you. But $1,000 is a benefit to you of voting only if it is your vote that determines the outcome.
The probability that any statewide election will be decided by a single vote is, effectively, zero. State elections that are decided by as many as a few hundred votes are likely to be subject to several recounts, each of which is likely to produce a different result. The outcomes of extremely close elections are ordinarily decided in the courts or in legislative bodies; there is no chance that one vote would, in fact, determine the outcome. Thus, the $1,000 benefit that you expect to receive will not be a factor in your decision about whether to vote. The other likely benefit of voting is the satisfaction you receive from performing your duty as a citizen in a free society. There may be additional personal benefits as well from the chance to visit with other people in your precinct. The opportunity cost of voting would be the value of the best alternative use of your time, together with possible transportation costs.
The fact that no one vote is likely to determine the outcome means that a decision about whether to vote is likely to rest on individual assessments of the satisfactions versus the costs of voting. Most people making such decisions find the costs are greater. In most elections, most people who are eligible to vote do not vote. Public choice analysis suggests that such a choice is rational; a decision not to vote because the marginal costs outweigh the marginal benefits is called rational abstentionA decision not to vote because the marginal costs outweigh the marginal benefits..
Rational abstention suggests there is a public sector problem of external benefits. Elections are a way of assessing voter preferences regarding alternative outcomes. An election is likely to do a better job of reflecting voter preferences when more people vote. But the benefits of an outcome that reflects the preferences of the electorate do not accrue directly to any one voter; a voter faces only some of the benefits of voting and essentially all of the costs. Voter turnouts are thus likely to be lower than is economically efficient.
In the 2000 presidential election, for example, just 50.7% of the voting-age population actually cast votes. President Bush received 47.9% of the vote, which means he was elected with the support of just 24% of the electorate. Mr. Bush actually received fewer votes than his opponent, Albert Gore, Jr. Mr. Bush, however, won a majority in the Electoral College. The Case in Point essay describes the 2000 election in more detail. Voter turnout was higher in the 2004 and 2008 presidential elections.
Legislative Choice and Special Interests
One alternative to having the general public vote on issues is to elect representatives who will make choices on their behalf. Public choice theory suggests that there are some difficulties with this option as well.
Suppose legislators seek to maximize the probability that they will be reelected. That requires that a legislator appeal to a majority of voters in his or her district. Suppose that each legislator can, at zero cost, learn the preferences of every voter in his or her district. Further, suppose that every voter knows, at zero cost, precisely how every government program will affect him or her.
In this imaginary world of costless information and ambitious legislators, each representative would support programs designed to appeal to a majority of voters. Organized groups would play no special role. Each legislator would already know how every voter feels about every issue, and every voter would already know how every program will affect him or her. A world of costless information would have no lobbyists, no pressure groups seeking a particular legislative agenda. No voter would be more important than any other.
Now let us drop the assumption that information is costless but retain the assumption that each legislator’s goal is to be reelected. Legislators no longer know how people in the district feel about each issue. Furthermore, voters may not be sure how particular programs will affect them. People can obtain this information, but it is costly.
In this more realistic world of costly information, special-interest groups suddenly play an important role. A legislator who does not know how elderly voters in his or her district feel about a certain issue may find a conversation with a representative of the American Association of Retired Persons (AARP) to be a useful source of information. A chat with a lobbyist for the Teamster’s Union may reveal something about the views of union members in the district. These groups also may be able to influence voter preferences through speeches and through public information and political action efforts.
A legislator in a world of costly information thus relies on special-interest groups for information and for support. To ensure his or her reelection, the legislator might try to fashion a program that appeals not to a majority of individuals but to a coalition of special-interest groups capable of delivering the support of a majority of voters. These groups are likely to demand something in exchange for their support of a particular candidate; they are likely to seek special programs to benefit their members. The role of special-interest groups is thus inevitable, given the cost of information and the desire of politicians to win elections. In the real world, it is not individual voters who count but well-organized groups that can deliver the support of voters to a candidate.
Public choice theorists argue that the inevitable importance of special-interest groups explains many choices the public sector makes. Consider, for example, the fact noted earlier in this chapter that a great many U.S. transfer payments go to groups, many of whose members are richer than the population as a whole. In the public choice perspective, the creation of a federal transfer program, even one that is intended to help poor people, will lead to competition among interest groups to be at the receiving end of the transfers. To win at this competition, a group needs money and organization—things poor people are not likely to have. In the competition for federal transfers, then, it is the nonpoor who often win.
The perception of growing power of special-interest groups in the United States has led to proposals for reform. One is the imposition of term limits, which restrict the number of terms a legislator can serve. Term limits were first established in Colorado in 1990; California and Oklahoma established term limits the same year. Subsequently, 18 other states adopted them. They have been found unconstitutional in four State Supreme Courts (Massachusetts, Oregon, Washington, and Wyoming). They have been repealed by the state legislatures of Idaho and Utah. Thus, term limits now apply in 15 states.“Legislative Term Limits: An Overview,” National Conference of State Legislatures, April 22, 2005.
One argument for term limits from the public choice perspective is that over time, incumbent legislators establish such close relationships with interest groups that they are virtually assured reelection; limiting terms may weaken these relationships and weaken special interests. The Supreme Court ruled in 1995 that individual states could not impose term limits on members of Congress. If such limits are to prevail at the federal level, a constitutional amendment will be required.
Arguments against the term limits approach include the fact that term limits automatically remove experienced legislators who could be very effective. They also restrict voter choice.
A second type of reform effort is a proposal that campaigns for seats in Congress be federally funded. If candidates did not need to seek funding from special interests, the influence of these groups would wane.
Key Takeaways
- Public interest theory examines government as an institution that seeks to maximize public well-being or net social benefit. It assumes government will seek the efficient solution to market failure problems.
- Public choice theory assumes that individuals engage in rent-seeking behavior by pursuing their self-interest in their dealings with the public sector; they continue to try to maximize utility or profit.
- It may be rational for eligible voters to abstain from voting, according to the public choice theory.
- Public choice theory suggests that politicians seeking reelection will try to appeal to coalitions of special-interest groups.
Try It!
Here is a list of possible explanations for government programs and policies. In each case, identify whether the explanation reflects the public interest theory or the public choice theory of government action.
- “It is possible to explain much government activity by investigating the public’s demand for government services, but one should not ignore the incentives for increased supply of government services.”
- “Through careful application of cost-benefit analysis, we can identify the amount of a public good that should be provided by the government.”
- “The determination of what are merit or demerit goods is inherently political rather than scientific and more often than not can be traced to the efforts of groups with an ax to grind or some private motive to pursue.”
- “While it is possible that policy makers follow some well-reasoned-out application of ability-to-pay or benefit-received principles, it is more credible to recognize that many of the taxes in this country reflect the fact that groups find it in their interest to organize to get tax burdens shifted to others.”
- “It is in the public interest to correct the market failure caused by monopoly firms. Therefore, it behooves us to do so.”
Case in Point: The Presidential Election of 2000
© 2010 Jupiterimages Corporation
Public opinion polls on the eve of the election between George W. Bush and Al Gore showed the race to be a toss-up. Ordinarily, one might expect this to produce a large turnout. But barely more than half—50.7%—of registered voters went to the polls.
The 2000 election provides an illustration of the concept of rational abstention. It also illustrates another point made in the text. If an election is close, the outcome is likely to be determined in the courts.
Florida, with its 25 electoral votes, proved to be the decisive state. The winner of that state’s electoral votes would win the presidency. The outcome in that state was not determined until late November, when Florida’s Secretary of State, Republican Katherine Harris, declared George Bush the winner by a few hundred votes. Mr. Gore took the case to court. The Florida State Supreme Court ordered a recount.
The recounting process proved to be one of the most bizarre chapters in American political history. Thousands of lawyers descended on the state. Each ballot in key counties was scrutinized in an effort to determine which candidate each voter “intended” to choose. Chads, the small pieces of paper that are removed from a punch-card ballot, turned out to be of crucial importance. “Hanging chads,” which occurred when the ballot was not thoroughly punched and which literally remained hanging from the ballot, prevented a ballot from being counted by the state’s electric counting machines. The Florida’s Supreme Court ruled that the roughly 170,000 ballots that had been discarded by the machines because they were not properly punched had to be re-examined.
As the recounting went on, other controversies arose. Pursuant to Florida law, Ms. Harris had ordered County Clerks to remove ex-felons from their registered voter lists. One clerk, seeing her own name on the list, refused to remove the names. Ms. Harris had come up with a list of 57,700 ex-felons for her “scrub list.” The precise number of voters removed is not known. Harper’s Magazine columnist Greg Palast charges that 90% of the voters on the scrub list were not, in fact, ex-felons. He notes that they were, however, black—and likely to vote Democratic—90% of ex-felons who are allowed to vote vote Democratic.
In the end, the case went to the United States Supreme Court. The Court decided, by a single vote, that Ms. Harris’s certification of the outcome would stand, and George Bush became the president-elect of the United States.
All elections have stories of irregularities. The 2000 election was certainly no exception. What made it different was that the outcome came down to the votes in a single state. The official tally in Florida had Mr. Bush with 2,912,790 and Mr. Gore with 2,912,253. What was the “real” outcome? No one will ever know.
Sources: Florida Secretary of State, John Fund, “Vote Early and…” The Wall Street Journal, December 12, 2001; Greg Palast, “The Great Florida Ex-Con Game,” Harper’s Magazine, March 1, 2002; and U. S. Supreme Court, George W. Bush et al. vs. Albert Gore, Jr. et al., December 12, 2000.
Answer to Try It! Problem
Statements (2) and (5) reflect a public interest perspective. Statements (1), (3), and (4) reflect a public choice perspective.
15.4 Review and Practice
Summary
In this chapter we examined the role of the public sector in the market economy. Since 1929, both the size and scope of government activities in the market have expanded considerably in the United States.
People demand government participation in three areas of economic activity. First, people may want correction of market failure involving public goods, external costs and benefits, and inefficient allocation created by imperfect competition. In each case of market failure, the shift from an inefficient allocation to an efficient one has the potential to eliminate or reduce deadweight losses. Second, people may seek government intervention to counteract irrational behaviors. Third, people often want government to participate in the transfer of income. Programs to transfer income have grown dramatically in the United States within the past few decades. The bulk of transfer payment spending is not means-tested.
Government activity is financed primarily by taxes. Two principles of taxation are the ability-to-pay principle, which holds that tax payments should rise with income, and the benefits-received principle, which holds that tax payments should be based on the benefits each taxpayer receives. Taxes may be regressive, proportional, or progressive. The major types of taxes in the United States are income taxes, sales and excise taxes, and property taxes. Economists seek to determine who bears the burden of a tax by examining its incidence. Taxes may be borne by buyers or sellers, depending on the relative elasticities of demand and supply.
Two broad perspectives are used to examine choices in the public sector. One is the public interest approach, which uses cost-benefit analysis to find the efficient solution to resource allocation problems. It assumes that the goal of the public sector is to maximize net social benefits. Cost-benefit analysis requires the estimation of benefits and costs that are not revealed in the marketplace. The second approach to the analysis of the public sector is public choice theory, which assumes utility-maximizing and rent-seeking behavior on the part of participants in the public sector and those trying to influence it. We examined two insights stemming from public choice theory: the problem of rational abstention from voting and the role of special interests.
Concept Problems
-
Identify each of the following government programs as efforts to correct market failure, to promote or discourage the consumption of goods subject to irrational decisions, or to transfer income.
- Head Start, a preschool program for low-income children
- Sports leagues for children sponsored by local governments
- A program to limit air pollution generated by power plants
- Species preservation efforts by the government
- Public Broadcasting System (PBS) stations regularly solicit contributions from viewers. Yet only about 11% of these viewers, who on average have much higher incomes than the rest of the population, ever contribute. Why?
- Do you expect to benefit from the research efforts sponsored by the American Cancer Society? Do you contribute? If you answered “Yes,” then “No,” does this make you a free rider?
- Suppose the population of the United States increases. What will happen to the demand for national defense? What will happen to the efficient quantity of defense?
- How could a program that redistributes income from rich to poor be considered a public good?
- Local governments typically supply tennis courts but not bowling alleys. Can you give a public choice explanation for this phenomenon? How about a public interest explanation?
- Find out the turnout at the most recent election for student body president at your school. Does the turnout indicate student apathy?
- Some welfare programs reduce benefits by $1 for every $1 that recipients earn; in effect, this is a tax of 100% on recipient earnings. Who pays the tax?
- Suppose the quality of elementary education is a public good. How might we infer the demand for elementary school quality from residential property values?
- V.I. Lenin, founder of the former Soviet Union, wrote that “the State is a machine for the oppression of one class by another.” Explain whether Lenin’s view typifies the public interest or the public choice school of public sector choice.
- Sugar prices in the United States are several times higher than the world price of sugar. This disparity results from a federal government program that keeps enough foreign-produced sugar out of the United States to hold U.S. sugar prices at a high level. The program raises the price of all sweetened foods produced in the United States; it boosts food costs for the average household by more than a hundred dollars per year. Who benefits from the program? Why do you suppose it exists?
- The table on federal income tax rates facing various income groups suggests that the marginal tax rate in the United States has fallen since the 1993–1996 period used in the study of marginal tax rates and labor supply discussed in the Case in Point essay. What would your prediction be as to how this reduction in the marginal tax rate would affect the quantity of labor supplied in the United States?
- Given that we cannot have a perfectly accurate count of the votes in any election, is there any point in having elections at all?
Numerical Problems
-
In an effort to beautify their neighborhood, four households are considering leasing a small section of vacant land for a park. For a monthly leasing fee, the owner of the vacant land is willing to arrange for some of the maintenance and to make the park available only to the four households. The demand curves for the four households (A, B, C, and D) wanting parkland are as follows (all demand curves are linear):
Acres of Parkland Demanded per Month Price per month A B C D $100 0 0 0 0 $75 1 0 0 0 $50 2 1⅓ 0 0 $25 3 2⅔ 2 0 $0 4 4 4 1 Draw the demand curves for the four neighbors, and show the neighborhood demand curve for parkland.
- Suppose the owner of the vacant land will provide for and maintain a neighborhood park at a fee of $125 per acre; the neighbors may lease up to 5 acres of land per month. Add this information to the graph you drew in Problem 1, and show the efficient solution. Are the neighbors likely to achieve this solution? Explain the problems involved in achieving it.
-
The perfectly competitive blank compact disc industry is in long-run equilibrium, selling blank discs for $5 apiece. Now the government imposes an excise tax of $2 per disc produced.
- Show what happens to the price and output of discs in the short run.
- Now show the impact in the long run.
- Who pays the tax? (Note: Show quantities as Q1, Q2, etc.)
-
A monopoly firm has just taken over the blank compact-disc industry. There have been technological advances that have lowered production cost, but the monopoly firm charges a price greater than average total cost, even in the long run. As it turns out, the firm is still selling compact discs for $5. The government imposes an excise tax of $2 per disc produced.
- What happens to price?
- What happens to output?
- Compare your results to your answer in Problem 3 and explain.
-
The following hypothetical data give annual spending on various goods and services for households at different income levels. Assume that an excise tax on any of these would, in the long run, be shifted fully to consumers.
Income range Average income Food Clothing Entertainment $0–$25,000 $20,000 $5,000 $1,000 $500 $25,000–$50,000 $40,000 $8,000 $2,000 $2,000 $50,000–$75,000 $65,000 $9,750 $3,250 $5,200 $75,000–$100,000 $80,000 $10,000 $4,000 $8,000 > $100,000 $200,000 $16,000 $10,000 $30,000 Determine whether a tax on any of the following goods would be progressive, proportional, or regressive.
- Food.
- Clothing.
- Entertainment.