This is “Natural Resources and Conservation”, section 13.3 from the book Microeconomics Principles (v. 2.0). For details on it (including licensing), click here.
For more information on the source of this book, or why it is available for free, please see the project's home page. You can browse or download additional books there. To download a .zip file containing this book to use offline, simply click here.


13.3 Natural Resources and Conservation
Learning Objectives
- Distinguish between exhaustible and renewable natural resources.
- Discuss the market for exhaustible natural resources in terms of factors that influence both demand and supply.
- Discuss the market for renewable natural resources and relate the market outcome to carrying capacity.
- Explain and illustrate the concept of economic rent.
Natural resources are the gifts of nature. They include everything from oil to fish in the sea to magnificent scenic vistas. The stock of a natural resource is the quantity of the resource with which the earth is endowed. For example, a certain amount of oil lies in the earth, a certain population of fish live in the sea, and a certain number of acres make up an area such as Yellowstone National Park or Manhattan. These stocks of natural resources, in turn, can be used to produce a flow of goods and services. Each year, we can extract a certain quantity of oil, harvest a certain quantity of fish, and enjoy a certain number of visits to Yellowstone.
As with capital, we examine the allocation of natural resources among alternative uses across time. By definition, natural resources cannot be produced. Our consumption of the services of natural resources in one period can affect their availability in future periods. We must thus consider the extent to which the expected demands of future generations should be taken into account when we allocate natural resources.
Natural resources often present problems of property rights in their allocation. A resource for which exclusive property rights have not been defined will be allocated as a common property resource. In such a case, we expect that the marketplace will not generate incentives to use the resource efficiently. In the absence of government intervention, natural resources that are common property may be destroyed. In this section, we shall consider natural resources for which exclusive property rights have been defined. The public sector’s role in the allocation of common property resources is investigated in the chapter on the environment.
We can distinguish two categories of natural resources, those that are renewable and those that are not. A renewable natural resourceA resource whose services can be used in one period without necessarily reducing the stock of the resource that will be available in subsequent periods. is one whose services can be used in one period without necessarily reducing the stock of the resource that will be available in subsequent periods. The fact that they can be used in such a manner does not mean that they will be; renewable natural resources can be depleted. Wilderness areas, land, and water are renewable natural resources. The consumption of the services of an exhaustible natural resourceA resource whose services cannot be used in one period without reducing the stock of the resource that will be available in subsequent periods., on the other hand, necessarily reduces the stock of the resource. Oil and coal are exhaustible natural resources.
Exhaustible Natural Resources
Owners of exhaustible natural resources can be expected to take the interests of future as well as current consumers into account in their extraction decisions. The greater the expected future demand for an exhaustible natural resource, the greater will be the quantity preserved for future use.
Expectations and Resource Extraction
Suppose you are the exclusive owner of a deposit of oil in Wyoming. You know that any oil you pump from this deposit and sell cannot be replaced. You are aware that this is true of all the world’s oil; the consumption of oil inevitably reduces the stock of this resource.
If the quantity of oil in the earth is declining and the demand for this oil is increasing, then it is likely that the price of oil will rise in the future. Suppose you expect the price of oil to increase at an annual rate of 15%.
Given your expectation, should you pump some of your oil out of the ground and sell it? To answer that question, you need to know the interest rate. If the interest rate is 10%, then your best alternative is to leave your oil in the ground. With oil prices expected to rise 15% per year, the dollar value of your oil will increase faster if you leave it in the ground than if you pump it out, sell it, and purchase an interest-earning asset. If the market interest rate were greater than 15%, however, it would make sense to pump the oil and sell it now and use the revenue to purchase an interest-bearing asset. The return from the interest-earning asset, say 16%, would exceed the 15% rate at which you expect the value of your oil to increase. Higher interest rates thus reduce the willingness of resource owners to preserve these resources for future use.
Figure 13.5 Future Generations and Exhaustible Natural Resources
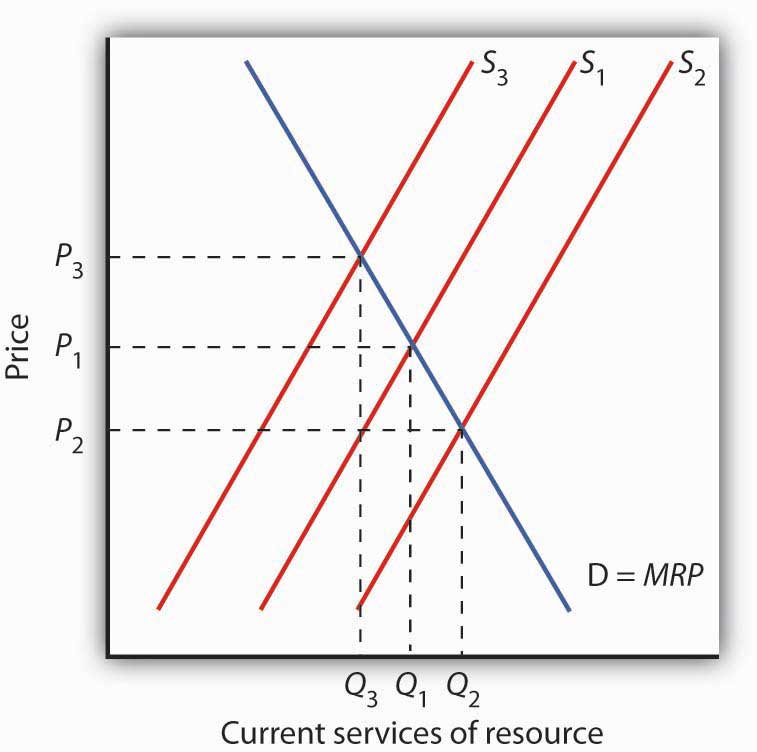
The current demand D for services of an exhaustible resource is given by the marginal revenue product (MRP). S1 reflects the current marginal cost of extracting the resource, the prevailing interest rate, and expectations of future demand for the resource. The level of current consumption is thus at Q1. If the interest rate rises, the supply curve shifts to S2, causing the price of the resource to fall to P2 and the quantity consumed to rise to Q2. A drop in the interest rate shifts the supply curve to S3, leading to an increase in price to P3 and a decrease in consumption to Q3.
The supply of an exhaustible resource such as oil is thus governed by its current price, its expected future price, and the interest rate. An increase in the expected future price—or a reduction in the interest rate—reduces the supply of oil today, preserving more for future use. If owners of oil expect lower prices in the future, or if the interest rate rises, they will supply more oil today and conserve less for future use. This relationship is illustrated in Figure 13.5 "Future Generations and Exhaustible Natural Resources". The current demand D for these services is given by their marginal revenue product (MRP). Suppose S1 reflects the current marginal cost of extracting the resource, the prevailing interest rate, and expectations of future demand for the resource. If the interest rate increases, owners will be willing to supply more of the natural resource at each price, thereby shifting the supply curve to the right to S2. The current price of the resource will fall. If the interest rate falls, the supply curve for the resource will shift to the left to S3 as more owners of the resource decide to leave more of the resource in the earth. As a result, the current price rises.
Resource Prices Over Time
Since using nonrenewable resources would seem to mean exhausting a fixed supply, then one would expect the prices of exhaustible natural resources to rise over time as the resources become more and more scarce. Over time, however, the prices of most exhaustible natural resources have fluctuated considerably relative to the prices of all other goods and services. Figure 13.6 "Natural Resource Prices, 1980–2010" shows the prices of four major exhaustible natural resources 1980 to 2010. Prices have been adjusted for inflation to reflect the prices of these resources relative to other prices.
During the final two decades of the twentieth century, exhaustible natural resource prices were generally falling. With the start of the current century, their prices have been rising. In short, why do prices of natural resources fluctuate as they do? Should the process of continuing to “exhaust” them just drive their prices up over time?
Figure 13.6 Natural Resource Prices, 1980–2010
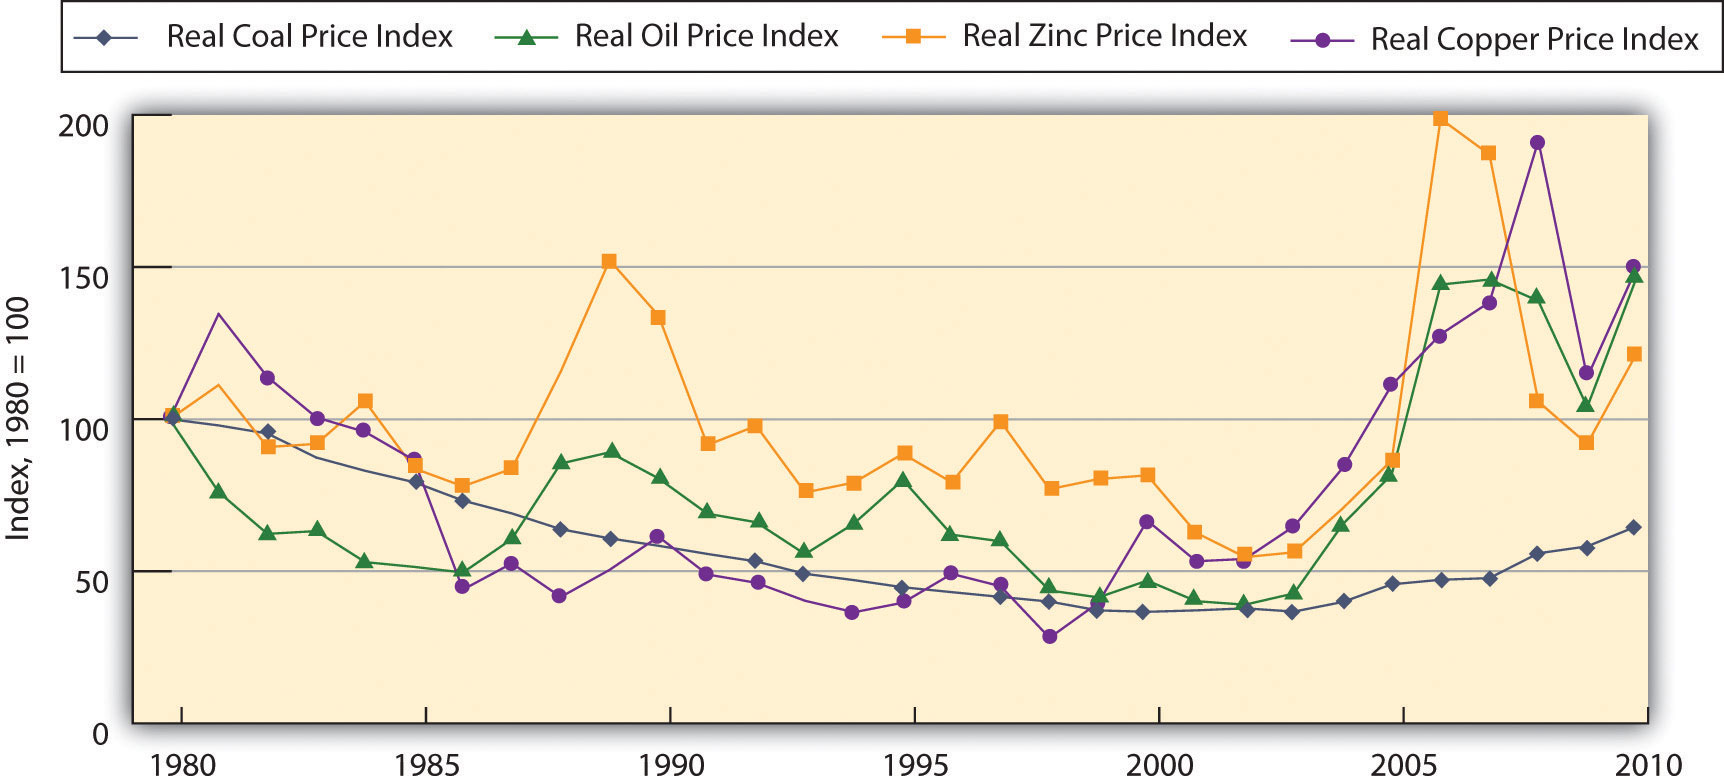
The chart shows changes in the prices of four exhaustible resources—copper, zinc, oil, and coal from 1980–2010.
Sources: U.S. Bureau of the Census, Statistical Abstract of the United States, online; U.S. Energy Information Administration, Annual Energy Review, online; U.S. Geological Survey, Minerals Yearbook, online.
In setting their expectations, people in the marketplace must anticipate not only future demand but also future supply as well. Demand in future periods could fall short of expectations if new technologies produce goods and services using less of a natural resource. That has clearly happened. The quantity of energy—which is generally produced using exhaustible fossil fuels—used to produce a unit of output has fallen by more than half in the last three decades. At the same time, rising income levels around the world, particularly in China and India over the last two decades, have led to increased demand for energy. Supply increases when previously unknown deposits of natural resources are discovered and when technologies are developed to extract and refine resources more cheaply. Figure 13.7 "An Explanation for Falling Resource Prices" shows that discoveries that reduce the demand below expectations and increase the supply of natural resources can push prices down in a way that people in previous periods might not have anticipated. This scenario explains the fall in some prices of natural resources in the latter part of the twentieth century. To explain the recent rise in exhaustible natural resources prices, we can say that the factors contributing to increased demand for energy and some other exhaustible natural resources were outweighing the factors contributing to increased supply, resulting in higher prices—a scenario opposite to what is shown in Figure 13.7 "An Explanation for Falling Resource Prices". This upward trend began to reverse itself again in late 2008, as the world economies began to slump and then picked up again.
Figure 13.7 An Explanation for Falling Resource Prices
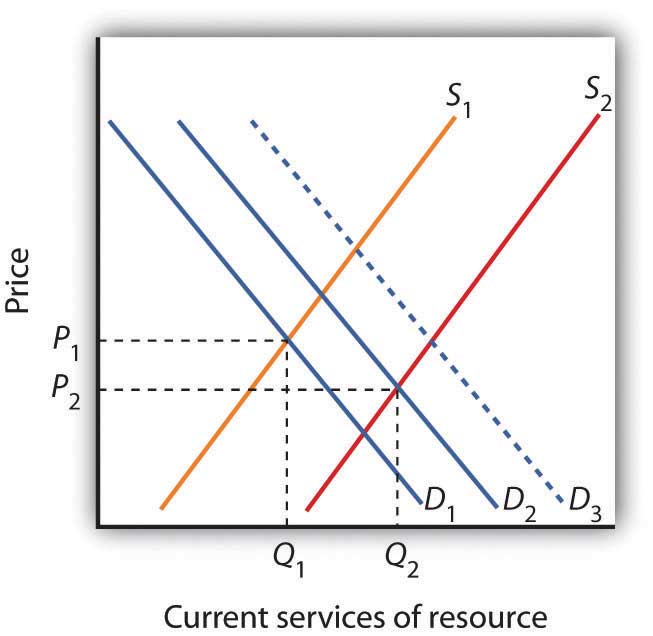
Demand for resources has increased over time from D1 to D2, but this shift in demand is less than it would have been (D3) if technologies for producing goods and services using less resource per unit of output had not been developed. Supply of resources has increased from S1 to S2 as a result of the discovery of deposits of natural resources and/or development of new technologies for extracting and refining resources. As a result, the prices of many natural resources have fallen.
Will we ever run out of exhaustible natural resources? Past experience suggests that we will not. If no new technologies or discoveries that reduce demand or increase supply occur, then resource prices will rise. As they rise, consumers of these resources will demand lower quantities of these resources. Eventually, the price of a particular resource could rise so high that the quantity demanded would fall to zero. At that point, no more of the resource would be used. There would still be some of the resource in the earth—it simply would not be practical to use more of it. The market simply will not allow us to “run out” of exhaustible natural resources.
Renewable Natural Resources
As is the case with exhaustible natural resources, our consumption of the services of renewable natural resources can affect future generations. Unlike exhaustible resources, however, renewable resources can be consumed in a way that does not diminish their stocks.
Carrying Capacity and Future Generations
The quantity of a renewable natural resource that can be consumed in any period without reducing the stock of the resource available in the next period is its carrying capacityThe quantity of a renewable natural resource that can be consumed in any period without reducing the stock of the resource available in the next period.. Suppose, for example, that a school of 10 million fish increases by 1 million fish each year. The carrying capacity of the school is therefore 1 million fish per year—the harvest of 1 million fish each year will leave the size of the population unchanged. Harvests that exceed a resource’s carrying capacity reduce the stock of the resource; harvests that fall short of it increase that stock.
As is the case with exhaustible natural resources, future generations have a stake in current consumption of a renewable resource. Figure 13.8 "Future Generations and Renewable Resources" shows the efficient level of consumption of such a resource. Suppose Qcap is the carrying capacity of a particular resource and S1 is the supply curve that reflects the current marginal cost of utilizing the resource, including costs for the labor and capital required to make its services available, given the interest rate and expected future demand. The efficient level of consumption in the current period is found at point E, at the intersection of the current period’s demand and supply curves. Notice that in the case shown, current consumption at Q1 is less than the carrying capacity of the resource. A larger stock of this resource will be available in subsequent periods than is available now.
Figure 13.8 Future Generations and Renewable Resources
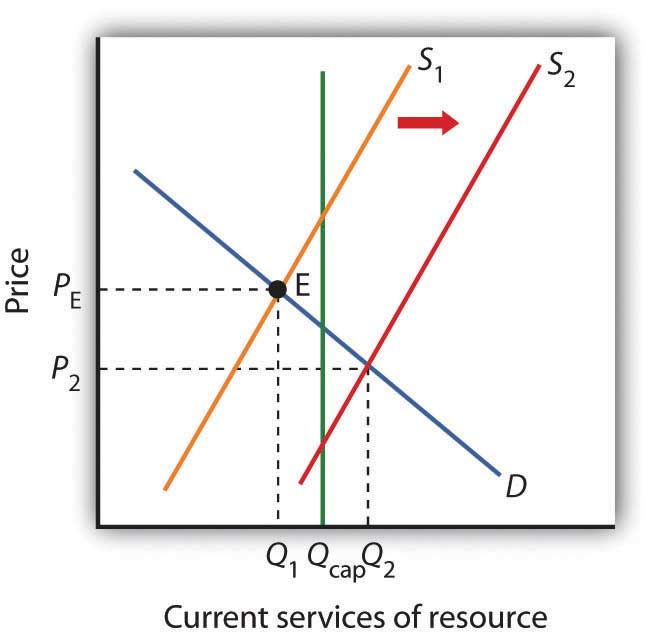
The efficient quantity of services to consume is determined by the intersection S1 and the demand curve D. This intersection occurs at point E at a quantity of Q1. This lies below the carrying capacity Qcap. An increase in interest rates, however, shifts the supply curve to S2. The efficient level of current consumption rises to Q2, which now exceeds the carrying capacity of the resource.
Now suppose interest rates increase. As with nonrenewable resources, higher interest rates shift the supply curve to the right, as shown by S2. The result is an increase in current consumption to Q2. Now consumption exceeds the carrying capacity, and the stock of the resource available to future generations will be reduced. While this solution may be efficient, the resource will not be sustained over time at current levels.
If society is concerned about a reduction in the amount of the resource available in the future, further steps may be required to preserve it. For example, if trees are being cut down faster than they are being replenished in a particular location, such as the Amazon in Brazil, a desire to maintain biological diversity might lead to conservation efforts.
Economic Rent and The Market for Land
We turn finally to the case of land that is used solely for the space it affords for other activities—parks, buildings, golf courses, and so forth. We shall assume that the carrying capacity of such land equals its quantity.
Figure 13.9 The Market for Land
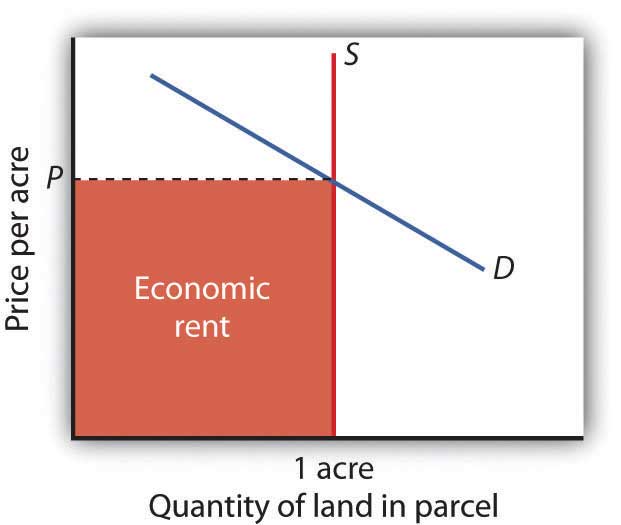
The price of a one-acre parcel of land is determined by the intersection of a vertical supply curve and the demand curve for the parcel. The sum paid for the parcel, shown by the shaded area, is economic rent.
The supply of land is a vertical line. The quantity of land in a particular location is fixed. Suppose, for example, that the price of a one-acre parcel of land is zero. At a price of zero, there is still one acre of land; quantity is unaffected by price. If the price were to rise, there would still be only one acre in the parcel. That means that the price of the parcel exceeds the minimum price—zero—at which the land would be available. The amount by which any price exceeds the minimum price necessary to make a resource available is called economic rentThe amount by which any price exceeds the minimum price necessary to make a resource available..
The concept of economic rent can be applied to any factor of production that is in fixed supply above a certain price. In this sense, much of the salary received by Judge Judy constitutes economic rent. At a low enough salary, she might choose to leave the television industry. How low would depend on what she could earn in a best alternative occupation. If she earns $45 million per year now but could earn $200,000 in a best alternative occupation, then $44.8 million of her salary is economic rent. Most of her current earnings are in the form of economic rent, because her salary substantially exceeds the minimum price necessary to keep her supplying her resources to current purposes.
Key Takeaways
- Natural resources are either exhaustible or renewable.
- The demand for the services of a natural resource in any period is given by the marginal revenue product of those services.
- Owners of natural resources have an incentive to take into account the current price, the expected future demand for them, and the interest rate when making choices about resource supply.
- The services of a renewable natural resource may be consumed at levels that are below or greater than the carrying capacity of the resource.
- The payment for a resource above the minimum price necessary to make the resource available is economic rent.
Try It!
You have just been given an oil well in Texas by Aunt Carmen. The current price of oil is $45 per barrel, and it is estimated that your oil deposit contains about 10,000 barrels of oil. For simplicity, assume that it does not cost anything to extract the oil and get it to market and that you must decide whether to empty the well now or wait until next year. Suppose the interest rate is 10% and that you expect that the price of oil next year will rise to $54 per barrel. What should you do? Would your decision change if the choice were to empty the well now or in two years?
Case in Point: Betting on Natural Resource Prices

© Thinkstock
Back in 1981, Julian Simon, an economist at the Cato Institute, issued a challenge to those who argued that rising prices signaled that the earth was likely to run out of natural resources. He and many other economists argued that rising prices would lead firms to make substitutions and to seek new discoveries and new technologies that would bring prices back down. He told doubters to pick any five exhaustible natural resources. If their average price, adjusted for inflation, rose over the next decade, Simon would pay $1,000. If their price fell, however, he would get the $1,000. Paul Ehrlich, an ecologist, took Mr. Simon up on his offer. Mr. Ehrlich is the author of the 1968 book, The Population Bomb, that argued resource scarcity would lead to the starvation of hundreds of millions of people by 1990. Mr. Ehrlich picked chromium, copper, nickel, tin, and tungsten. Since their prices fell over the decade, Mr. Ehrlich paid Mr. Simon $1,000.
In 1990, Mr. Simon offered a “double-or-quits” rematch for any future date. Mr. Simon died in 1998 and Mr. Ehrlich did not agree to take him on again. But, if the original bet were recalculated today, Mr. Ehrlich would have won. The index of the average price of the five resources went from 100 in 1980 down between 40 and 60 for much of the 1990s and is now back to about 100.
Those in the Simon camp, who have been dubbed the Cornucopians, might argue that the recent price rise is due to increased demand from developing countries and that new supplies, technologies, or substitutes will be found that will bring prices back down. Those in the Ehrlich camp, who have been dubbed the Malthusians after Thomas Malthus, the late eighteenth-century economist who argued that population growth would exceed the growth of food supplies, might respond that scarcity is finally taking over.
Which way would you bet?
Source: “The Revenge of Malthus: A Famous Bet Recalculated,” Economist, August 6, 2011, online at http://www.economist.com/node/21525472.
Answer to Try It! Problem
Since you expect oil prices to rise ($54 − 45)/$45 = 20% and the interest rate is only 10%, you would be better off waiting a year before emptying the well. Another way of seeing this is to compute the present value of the oil a year from now:
Po = ($54 * 10,000)/(1 + 0.10)1 = $490,909.09Since $490,909 is greater than the $45*10,000 = $450,000 you could earn by emptying the well now, the present value calculation shows the rewards of waiting a year.
If the choice is to empty the well now or in 2 years, however, you would be better off emptying it now, since the present value is only $446,280.99:
Po = ($54 * 10,000)/(1 + 0.10)2 = $446,280.99