This is “Investment and the Economy”, section 14.3 from the book Macroeconomics Principles (v. 1.1). For details on it (including licensing), click here.
For more information on the source of this book, or why it is available for free, please see the project's home page. You can browse or download additional books there. To download a .zip file containing this book to use offline, simply click here.
14.3 Investment and the Economy
Learning Objectives
- Explain how investment affects aggregate demand.
- Explain how investment affects economic growth.
We shall examine the impact of investment on the economy in the context of the model of aggregate demand and aggregate supply. Investment is a component of aggregate demand; changes in investment shift the aggregate demand curve by the amount of the initial change times the multiplier. Investment changes the capital stock; changes in the capital stock shift the production possibilities curve and the economy’s aggregate production function and thus shift the long- and short-run aggregate supply curves to the right or to the left.
Investment and Aggregate Demand
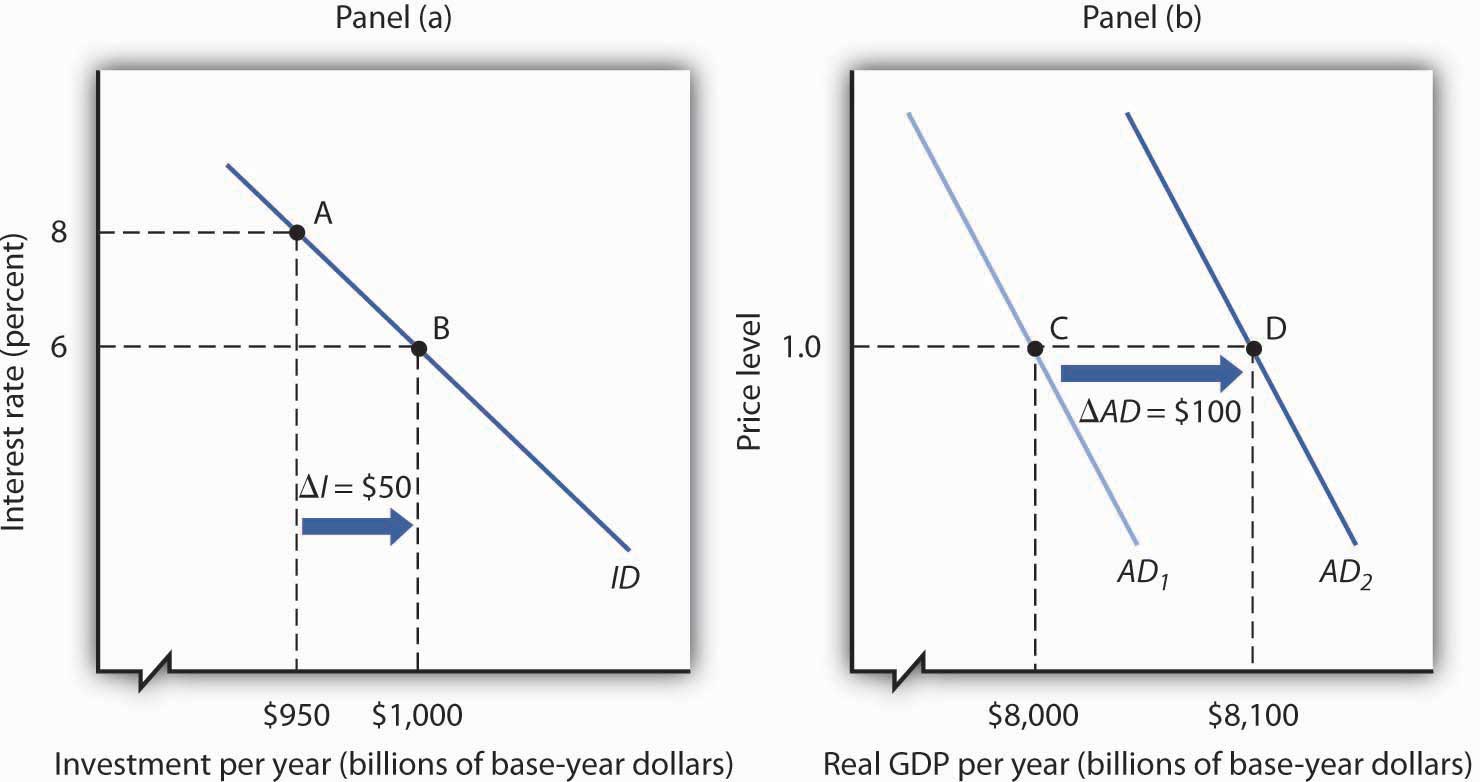
In the short run, changes in investment cause aggregate demand to change. Consider, for example, the impact of a reduction in the interest rate, given the investment demand curve (ID). In Figure 14.10 "A Change in Investment and Aggregate Demand", Panel (a), which uses the investment demand curve introduced in Figure 14.7 "The Investment Demand Curve", a reduction in the interest rate from 8% to 6% increases investment by $50 billion per year. Assume that the multiplier is 2. With an increase in investment of $50 billion per year and a multiplier of 2, the aggregate demand curve shifts to the right by $100 billion to AD2 in Panel (b). The quantity of real GDP demanded at each price level thus increases. At a price level of 1.0, for example, the quantity of real GDP demanded rises from $8,000 billion to $8,100 billion per year.
Figure 14.10 A Change in Investment and Aggregate Demand

A reduction in the interest rate from 8% to 6% increases the level of investment by $50 billion per year in Panel (a). With a multiplier of 2, the aggregate demand curve shifts to the right by $100 billion in Panel (b). The total quantity of real GDP demanded increases at each price level. Here, for example, the quantity of real GDP demanded at a price level of 1.0 rises from $8,000 billion per year at point C to $8,100 billion per year at point D.
A reduction in investment would shift the aggregate demand curve to the left by an amount equal to the multiplier times the change in investment.
The relationship between investment and interest rates is one key to the effectiveness of monetary policy to the economy. When the Fed seeks to increase aggregate demand, it purchases bonds. That raises bond prices, reduces interest rates, and stimulates investment and aggregate demand as illustrated in Figure 14.10 "A Change in Investment and Aggregate Demand". When the Fed seeks to decrease aggregate demand, it sells bonds. That lowers bond prices, raises interest rates, and reduces investment and aggregate demand. The extent to which investment responds to a change in interest rates is a crucial factor in how effective monetary policy is.
Investment and Economic Growth
Investment adds to the stock of capital, and the quantity of capital available to an economy is a crucial determinant of its productivity. Investment thus contributes to economic growth. We saw in Figure 14.4 "The Choice between Consumption and Investment" that an increase in an economy’s stock of capital shifts its production possibilities curve outward. (Recall from the chapter on economic growth that it also shifts the economy’s aggregate production function upward.) That also shifts its long-run aggregate supply curve to the right. At the same time, of course, an increase in investment affects aggregate demand, as we saw in Figure 14.10 "A Change in Investment and Aggregate Demand".
Key Takeaways
- Changes in investment shift the aggregate demand curve to the right or left by an amount equal to the initial change in investment times the multiplier.
- Investment adds to the capital stock; it therefore contributes to economic growth
Try It!
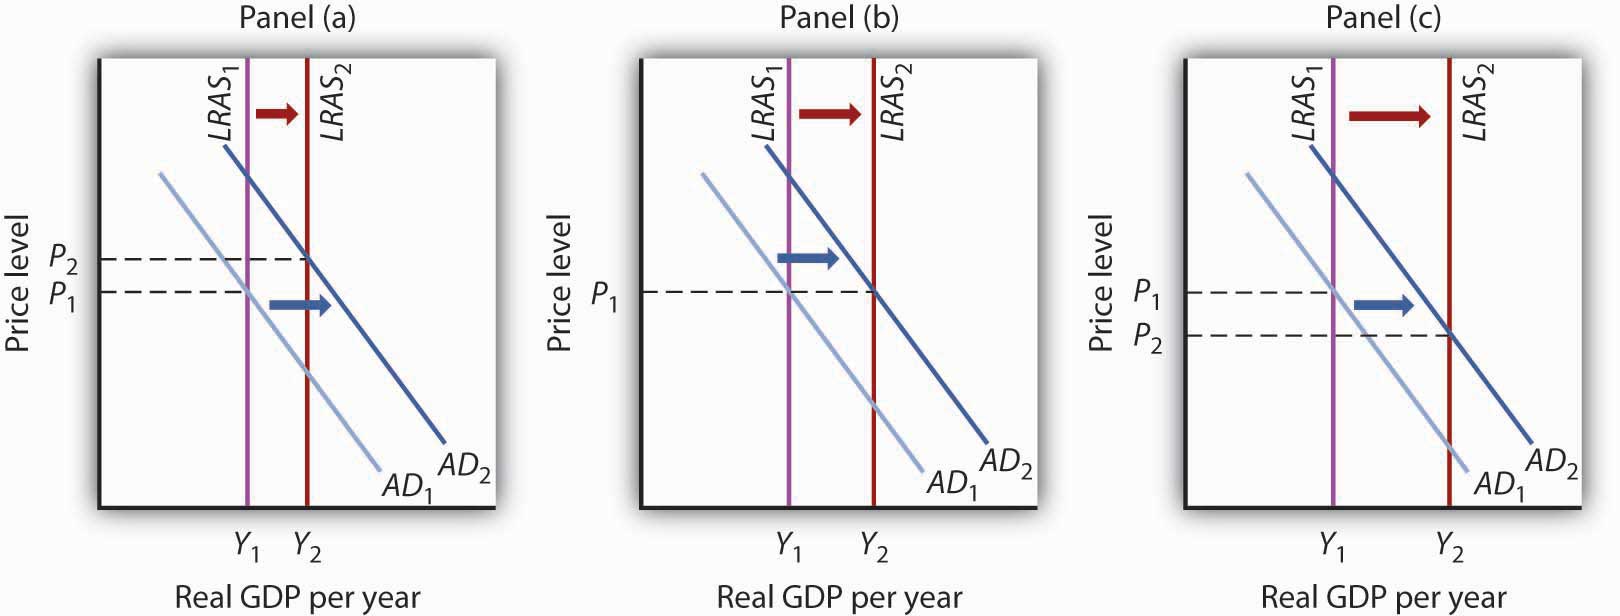
The text notes that rising investment shifts the aggregate demand curve to the right and at the same time shifts the long-run aggregate supply curve to the right by increasing the nation’s stock of physical and human capital. Show this simultaneous shifting in the two curves with three graphs. One graph should show growth in which the price level rises, one graph should show growth in which the price level remains unchanged, and another should show growth with the price level falling.
Case in Point: Investment by Businesses Saves the Australian Expansion
Figure 14.11

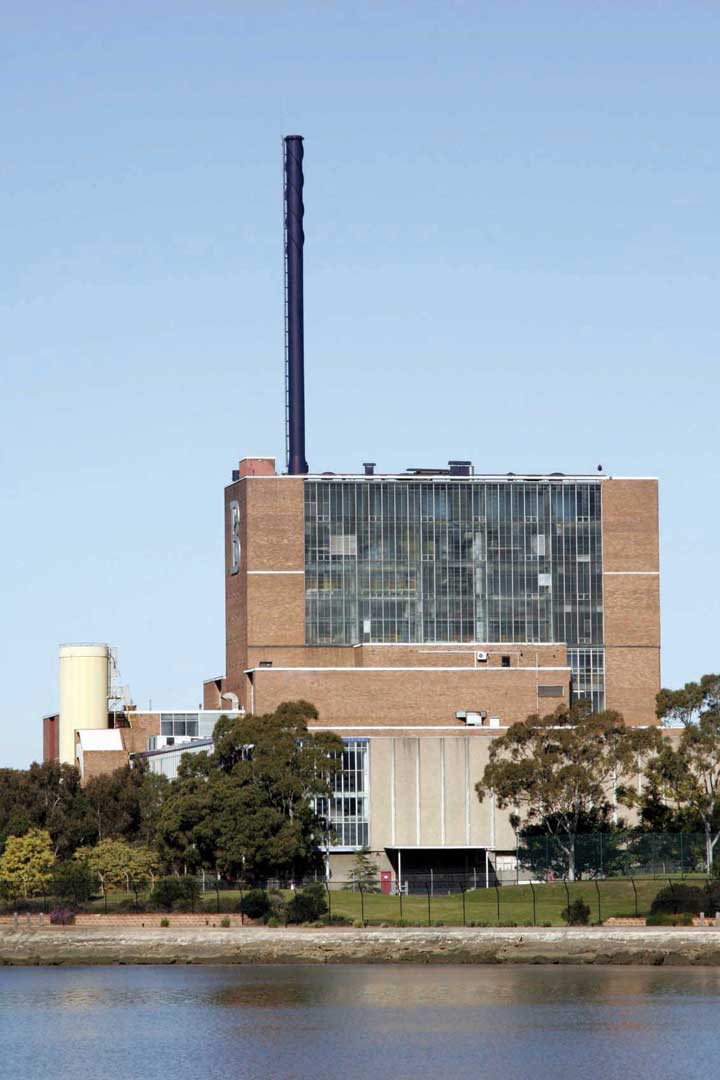
With consumer and export spending faltering in 2005, increased business investment spending seemed to be keeping the Australian economy afloat. “Corporate Australia is solidly behind the steering wheel of the Australian economy,” said Craig James, an economist for Commonwealth Securities, an Australian Internet securities brokerage firm. “The clear message from the latest investment survey is that corporate Australia is flush with cash and ready to spend,” he continued.
The data supported his conclusions. The level of investment spending in Australia on new buildings, plant, and equipment was 17% higher in 2005 than in 2004. Within the investment category, mining investment, spurred on by high prices for natural resources, was particularly strong.
Source: Scott Murdoch, “Equipment Investment Gives Boost to Economy,” Courier Mail (Queensland, Australia), September 2, 2005, Finance section, p. 35.
Answer to Try It! Problem
Panel (a) shows AD shifting by more than LRAS; the price level will rise in the long run.
Panel (b) shows AD and LRAS shifting by equal amounts; the price level will remain unchanged in the long run.
Panel (c) shows LRAS shifting by more than AD; the price level falls in the long run.
Figure 14.12


