This is “GIS Project Management”, chapter 10 from the book Geographic Information System Basics (v. 1.0). For details on it (including licensing), click here.
For more information on the source of this book, or why it is available for free, please see the project's home page. You can browse or download additional books there. To download a .zip file containing this book to use offline, simply click here.


Chapter 10 GIS Project Management
As Chapter 9 "Cartographic Principles" moved past the technical aspects of a geographic information system (GIS) and into the artistic skills needed by mapmakers, this chapter continues in that vein by introducing effective GIS project management solutions that commonly arise in the modern workplace. GIS users typically start their careers performing low-end tasks such as digitizing vast analogue datasets or error checking voluminous metadata files. However, adept cartographers will soon find themselves promoted through the ranks and possibly into management positions. Here, they will be tasked with an assortment of business-related activities such as overseeing work groups, interfacing with clients, creating budgets, and managing workflows. As GISs become increasingly common in today’s business world, so too must cartographers become adept at managing GIS projects to maximize effective work strategies and minimize waste. Similarly, as GIS projects begin to take on more complex and ambitious goals, GIS project managers will only become more important and integral to address the upcoming challenges of the job at hand.
10.1 Project Management Basics
Learning Objective
- The objective of this section is to achieve a basic understanding of the role of a project manager in the lifecycle of a GIS project.
Project management is a fairly recent professional endeavor that is growing rapidly to keep pace with the increasingly complex job market. Some readers may equate management with the posting of clichéd artwork that lines the walls of corporate headquarters across the nation (Figure 10.1). These posters often depict a multitude of parachuters falling arm-in-arm while forming some odd geometric shape, under which the poster is titled “Teamwork.” Another is a beautiful photo of a landscape titled, “Motivation.” Clearly, any job that is easy enough that its workers can be motivated by a pretty picture is a job that will either soon be done by computers or shipped overseas. In reality, proper project management is a complex task that requires a broad knowledge base and a variety of skills.
Figure 10.1

Management is more than posting vapid, buzzword-laden artwork such as this in the office place.
The Project Management Institute (PMI) Standards Committee describes project management as “the application of knowledge, skills, tools, and techniques to project activities in order to meet or exceed stakeholder needs and expectations.” To assist in the understanding and implementation of project management, PMI has written a book devoted to this subject titled, “A Guide to the Project Management Body of Knowledge,” also known as the PMBOK Guide (PMI 2008). This section guides the reader through the basic tenets of this text.
The primary stakeholders in a given projectA temporary endeavor undertaken to create a unique product or service as a means of achieving an organizational goal. include the project managerAn employee with the responsibility of planning, executing, and closing a given project., project team, sponsor/clientThe sponsor/client hires the project manager and his or her project team to provide some services and/or products., and customer/end-userThe customer/end-user, which may or may not be the sponsor/client, is the person or people who will use the service or product.. As project manager, you will be required to identify and solve potential problems, issues, and questions as they arise. Although much of this section is applicable to the majority of information technology (IT) projects, GIS projects are particularly challenging due to the large storage, integration, and performance requirements associated with this particular field. GIS projects, therefore, tend to have elevated levels of risk compared to standard IT projects.
Project management is an integrative effort whereby all of the project’s pieces must be aligned properly for timely completion of the work. Failure anywhere along the project timeline will result in delay, or outright failure, of the project goals. To accomplish this daunting task, five process groupsProcess groups outline and organize a multitude of individual activities and actions that project managers must employ to achieve the overall goals of the project. and nine project management knowledge areasProject management knowledge areas represent those subject areas that managers must be cognizant of to ensure that all the goals of the project will be met. have been developed to meet project objectives. These process groups and knowledge areas are described in this section.
PMBOK Process Groups
The five project management process groups presented here are described separately, but realize that there is typically a large degree of overlap among each of them.
Initiation, the first process group, defines and authorizes a particular project or project phase. This is the point at which the scope, available resources, deliverables, schedule, and goals are decided. Initiation is typically out of the hands of the project management team and, as such, requires a high-level sponsor/client to approve a given course of action. This approval comes to the project manager in the form of a project charter that provides the authority to utilize organizational resources to address the issues at hand.
The planning process group determines how a newly initiated project phase will be carried out. It focuses on defining the project scope, gathering information, reviewing available resources, identifying and analyzing potential risks, developing a management plan, and estimating timetables and costs. As such, all stakeholders should be involved in the planning process group to ensure comprehensive feedback. The planning process is also iterative, meaning that each planning step may positively or negatively affect previous decisions. If changes need to be made during these iterations, the project manager must revisit the plan components and update those now-obsolete activities. This iterative methodology is referred to as “rolling wave planning.”
The executing process group describes those processes employed to complete the work outlined in the planning process group. Common activities performed during this process group include directing project execution, acquiring and developing the project team, performing quality assurance, and distributing information to the stakeholders. The executing process group, like the planning process group, is often iterative due to fluctuations in project specifics (e.g., timelines, productivity, unanticipated risk) and therefore may require reevaluation throughout the lifecycle of the project.
The monitoring and controlling process group is used to observe the project, identify potential problems, and correct those problems. These processes run concurrently with all of the other process groups and therefore span the entire project lifecycle. This process group examines all proposed changes to the project and approves only those that do not alter the overall, stated goals of the project. Some of the specific activities and actions monitored and controlled by this process group include the project scope, schedule, cost, output quality, reports, risk, and stakeholder interactions.
Finally, the closing process group essentially terminates all of the actions and activities undertaken during the four previous process groups. This process group includes handing off all pertinent deliverables to the proper recipients and the formal completion of all contracts with the sponsor/client. This process group is also important to signal the sponsor/client that no more charges will be made, and they can now reassign the project staff and organizational resources as needed.
PMBOK Project Management Knowledge Areas
Each of the five aforementioned process groups is available for use with nine different knowledge areas. These knowledge areas comprise those subjects that project managers must be familiar with to successfully complete a given project. A brief description of each of these nine knowledge areas is provided here.
- Project integration management describes the ability of the project manager to “identify, define, combine, unify, and coordinate” the various project activities into a coherent whole (PMBOK 2008). It is understood by senior project managers that there is no single way to successfully complete this task. In reality, each manager must apply their specific skills, techniques, and knowledge to the job at hand. This knowledge area incorporates all five of the PMBOK process groups.
- Project scope management entails an understanding of not only what work is required to complete the project but also what extraneous work should be excluded from project. Defining the scope of a project is usually done via the creation of a scope plan document that is distributed among team members. This knowledge area incorporates the planning, as well as the monitoring and controlling process groups.
- Project time management takes into account the fact that all projects are subject to certain time constraints. These time constraints must be analyzed and an overall project schedule must be developed based on inputs from all project stakeholders (see Section 10.2.1 "Scheduling" for more on scheduling). This knowledge area incorporates the planning, as well as the monitoring and controlling process groups.
- Project cost management is focused not only with determining a reasonable budget for each project task but also with staying within the defined budget. Project cost management is often either very simple or very complex. Particular care needs to be taken to work with the sponsor/client as they will be funding this effort. Therefore, any changes or augments to the project costs must be vetted through the sponsor/client prior to initiating those changes. This knowledge area incorporates the planning, as well as the monitoring and controlling process groups.
- Project quality management identifies the quality standards of the project and determines how best to satisfy those standards. It incorporates responsibilities such as quality planning, quality assurance, and quality control. To ensure adequate quality management, the project manager must evaluate the expectations of the other stakeholders and continually monitor the output of the various project tasks. This knowledge area incorporates the planning, executing, and monitoring and controlling process groups.
- Project human resource management involves the acquisition, development, organization, and oversight of all team members. Managers should attempt to include team members in as many aspects of the task as possible so they feel loyal to the work and invested in creating the best output possible. This knowledge area incorporates the planning, executing, and monitoring and controlling process groups.
- Project communication management describes those processes required to maintain open lines of communication with the project stakeholders. Included in this knowledge area is the determination of who needs to communicate with whom, how communication will be maintained (e-mail, letter reports, phone, etc.), how frequently contacts will be made, what barriers will limit communication, and how past communications will be tracked and archived. This knowledge area incorporates the planning, executing, and monitoring and controlling process groups.
- Project risk management identifies and mitigates risk to the project. It is concerned with analyzing the severity of risk, planning responses, and monitoring those identified risks. Risk analysis has become a complex undertaking as experienced project managers understand that “an ounce of prevention is worth a pound of cure.” Risk management involves working with all team members to evaluate each individual task and to minimize the potential for that risk to manifest itself in the project or deliverable. This knowledge area incorporates the planning, as well as the monitoring and controlling process groups.
- Project procurement management, the final knowledge area, outlines the process by which products, services, and/or results are acquired from outside the project team. This includes selecting business partners, managing contracts, and closing contracts. These contracts are legal documents supported by the force of law. Therefore, the fine print must be read and understood to ensure that no confusion arises between the two parties entering into the agreement. This knowledge area incorporates the planning, executing, monitoring and controlling, and closing process groups.
Project Failure
Murphy’s Law of Project Management states that no major project is completed on time, within budget, and with the same staff that started it—do not expect yours to be the first. It has been estimated that only 16 percent of fully implemented information technology projects are completed on time and within budget (The Standish Group International 2000).The Standish Group International. 2000. “Our Blog.” http://www.pm2go.com. These failed projects result in an estimated loss of over $81 billion every year! David Hamil discusses the reasons for these failures in his web feature titled, “Your Mission, Should You Choose to Accept It: Project Management Excellence” (http://spatialnews.geocomm.com/features/mesa1).
The first noted cause for project failure is poor planning. Every project must undergo some type of planning-level feasibility study to determine the purpose of the project and the methodologies employed to complete it. A feasibility study is basically used to determine whether or not a project should be given the “green light.” It outlines the project mission, goals, objectives, scope, and constraints. A project may be deemed unfeasible for a variety of reasons including an unacceptable level of risk, unclear project requirements, disagreement among clients regarding project objectives, missing key stakeholders, and unresolved political issues.
A second cause for project failure is lack of corporate management support. Inadequate staffing and funding, as well as weak executive sponsorship on the part of the client, will typically result in a project with little chance of success. One of the most important steps in managing a project will be to determine which member of the client’s team is championing your project. This individual, or group of individuals, must be kept abreast of all major decisions related to the project. If the client’s project champion loses interest in or contact with the effort, failure is not far afield.
A third common cause of project failure is poor project management. A high-level project manager should have ample experience, education, and leadership abilities, in addition to being a skilled negotiator, communicator, problem solver, planner, and organizer. Despite the fact that managers with this wide-ranging expertise are both uncommon and expensive to maintain, it only takes a failed project or two for a client to learn the importance of securing the proper person for the job at hand.
The final cause of project failure is a lack of client focus and the lack of the end-user participation. The client must be involved in all stages of the lifecycle of the project. More than one GIS project has been completed and delivered to the client, only to discover that the final product was neither what the client envisioned nor what the client wanted. Likewise, the end-user, which may or may not be the client, is the most important participant in the long-term survival of the project. The end-user must participate in all stages of project development. The creation of a wonderful GIS tool will most likely go unused if the end-user can find a better and/or more cost-efficient solution to their needs elsewhere.
Key Takeaways
- Project managers must employ a wide range of activities and actions to achieve the overall goals of the project. These actions are broken down into five process groups: initiation, planning, executing, monitoring and controlling, and closing.
- The activities and actions described in this section are applied to nine management knowledge areas that managers must be cognizant of to ensure that all the goals of the project will be met: integration management, scope management, time management, cost management, quality management, human resource management, communication management, risk management, and procurement management.
- Projects can fail for a variety of reasons. Successful managers will be aware of these potential pitfalls and will work to overcome them.
Exercise
- As a student, you are constantly tasked with completing assignments for your classes. Think of one of your recent assignments as a project that you, as a project (assignment) manager, completed. Describe how you utilized a sampling of the project management process groups and knowledge areas to complete that assigned task.
10.2 GIS Project Management Tools and Techniques
Learning Objective
- The objective of this section is to review a sampling of the common tools and techniques available to complete GIS project management tasks.
As a project manager, you will find that there are many tools and techniques that will assist your efforts. While some of these are packaged in a geographic information system (GIS), many are not. Others are mere concepts that managers must be mindful of when overseeing large projects with a multitude of tasks, team members, clients, and end-users. This section outlines a sampling of these tools and techniques, although their implementation is dependent on the individual project, scope, and requirements that arise therein. Although these topics could be sprinkled throughout the preceding chapters, they are not concepts whose mastery is typically required of entry-level GIS analysts or technicians. Rather, they constitute a suite of skills and techniques that are often applied to a project after the basic GIS work has been completed. In this sense, this section is used as a platform on which to present novice GIS users with a sense of future pathways they may be led down, as well as providing hints to other potential areas of study that will complement their nascent GIS knowledge base.
Scheduling
One of the most difficult and dread-inducing components of project management for many is the need to oversee a large and diverse group of team members. While this text does not cover tips for getting along with others (for this, you may want to peruse Flat World Knowledge’s selection of psychology/sociology texts), ensuring that each project member is on task and up to date is an excellent way to reduce potential problems associated with a complex project. To achieve this, there are several tools available to track project schedules and goal completions.
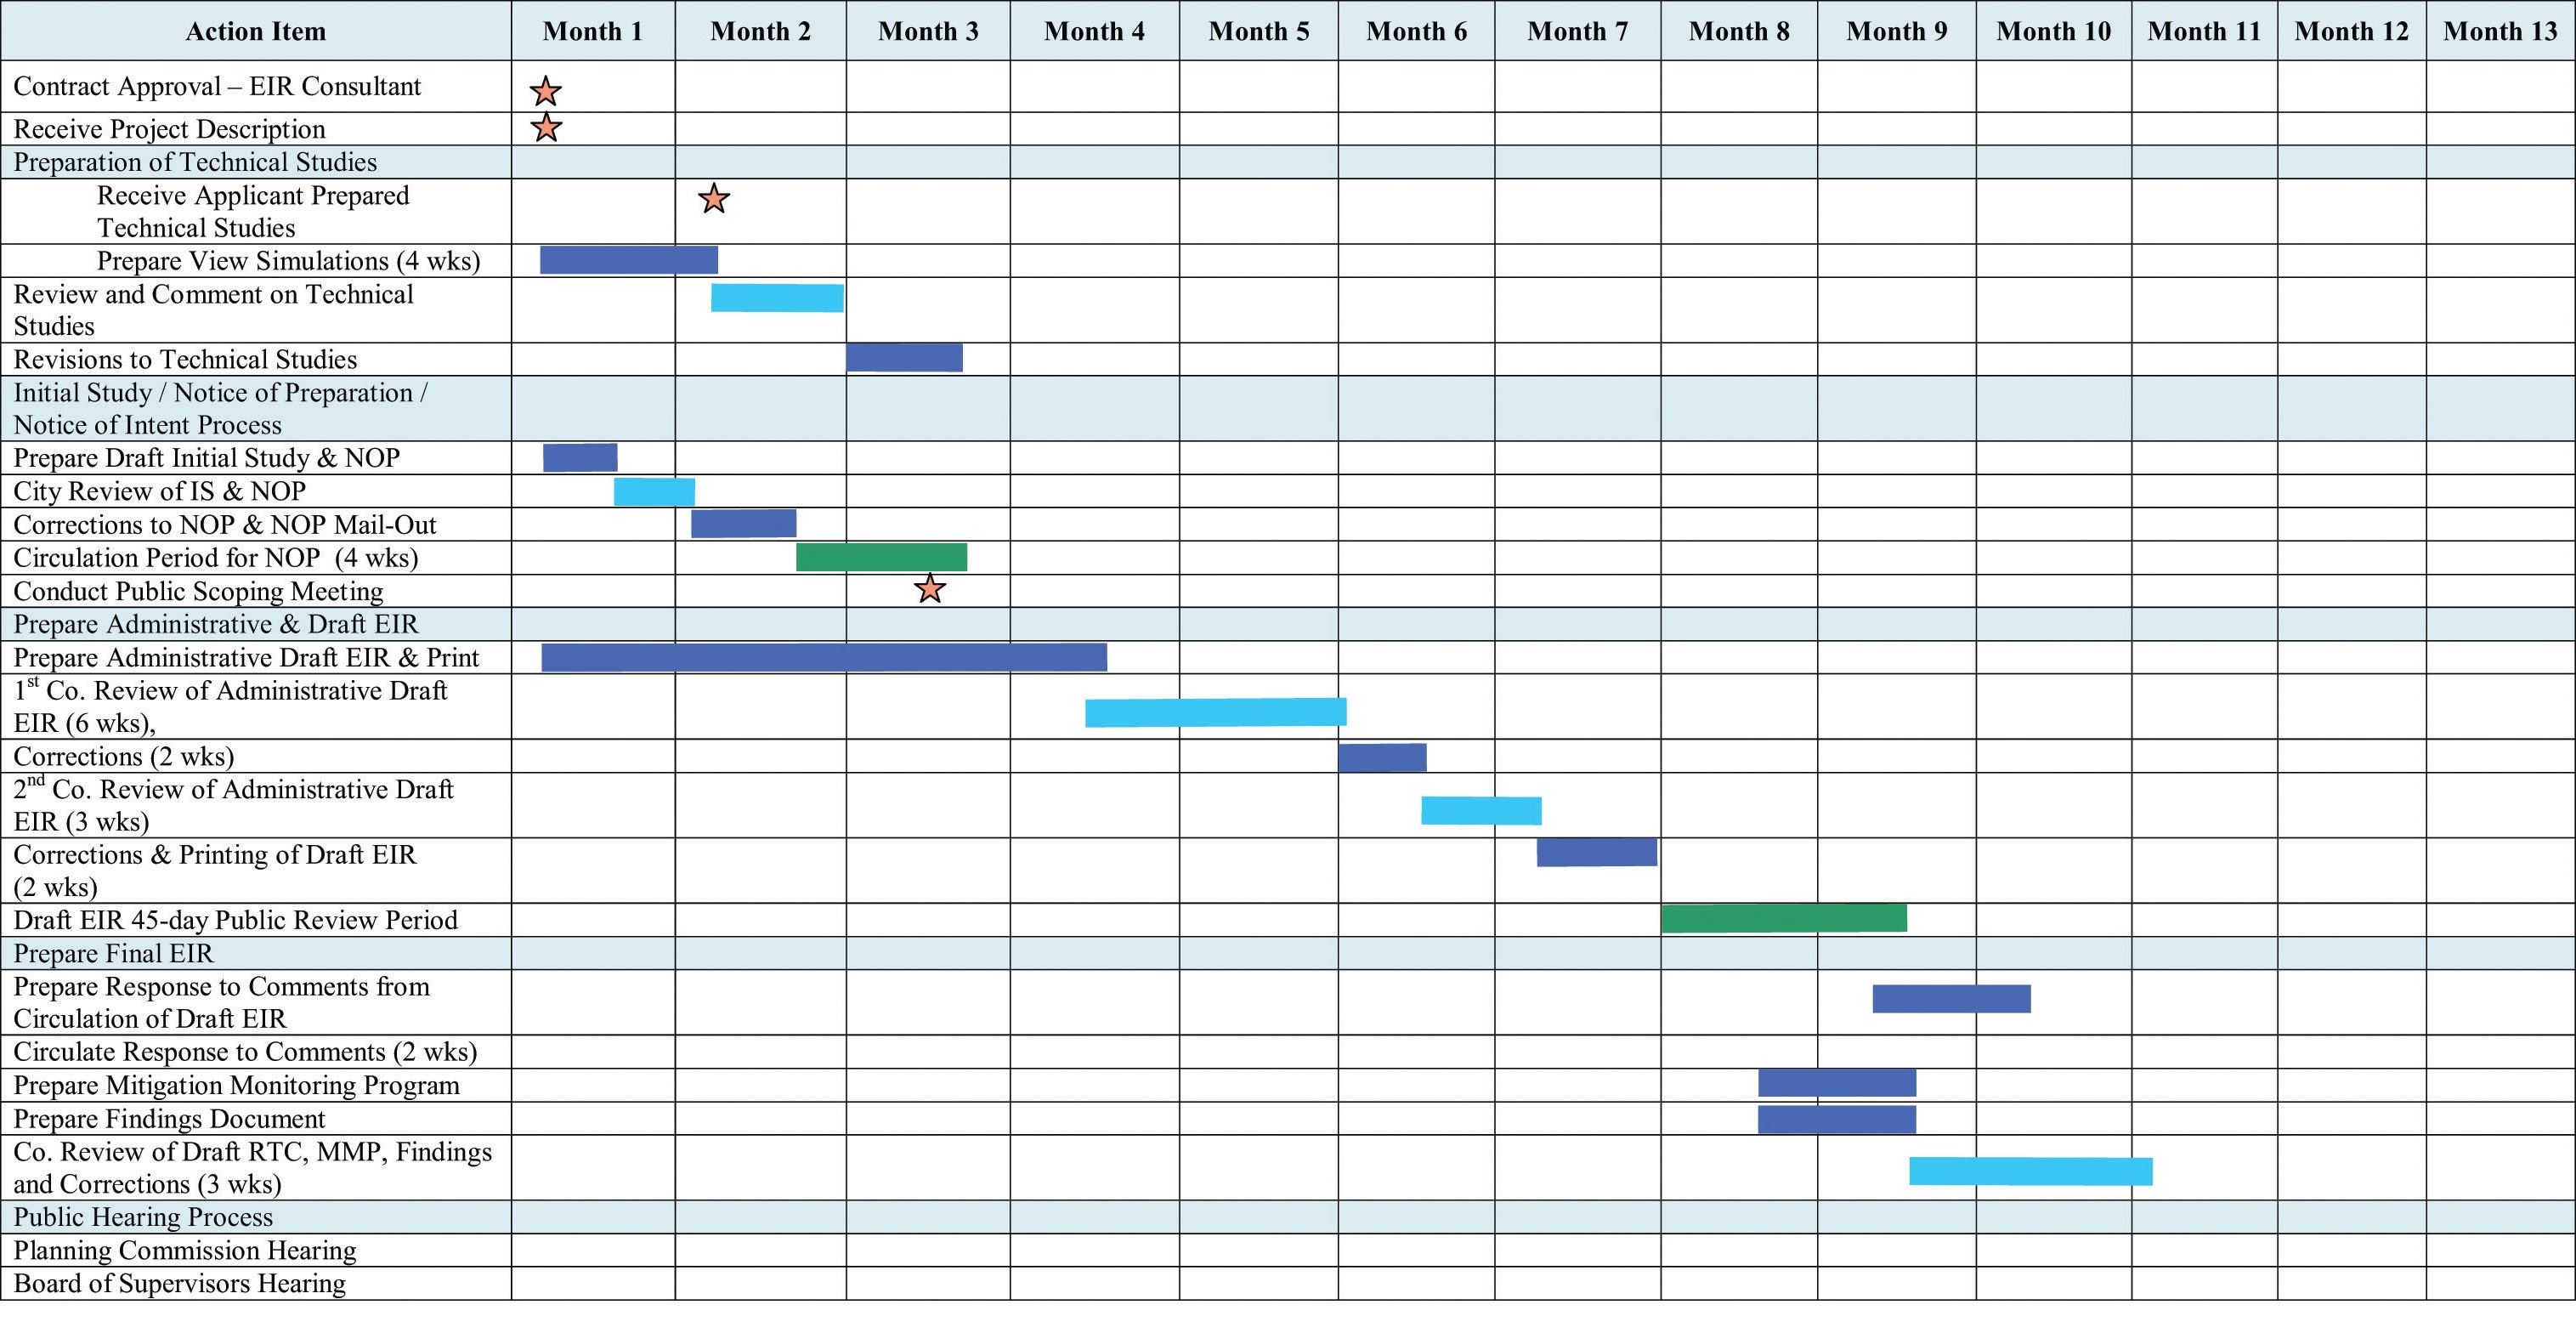
The Gantt chart (named after its creator, Henry Gantt) is a bar chart that is used specifically for tracking tasks throughout the project lifecycle. Additionally, Gantt charts show the dependencies of interrelated tasks and focus on the start and completion dates for each specific task. Gantt charts will typically represent the estimated task completion time in one color and the actual time to completion in a second color (Figure 10.2 "Gantt Chart"). This color coding allows project members to rapidly assess the project progress and identify areas of concern in a timely fashion.
Figure 10.2 Gantt Chart
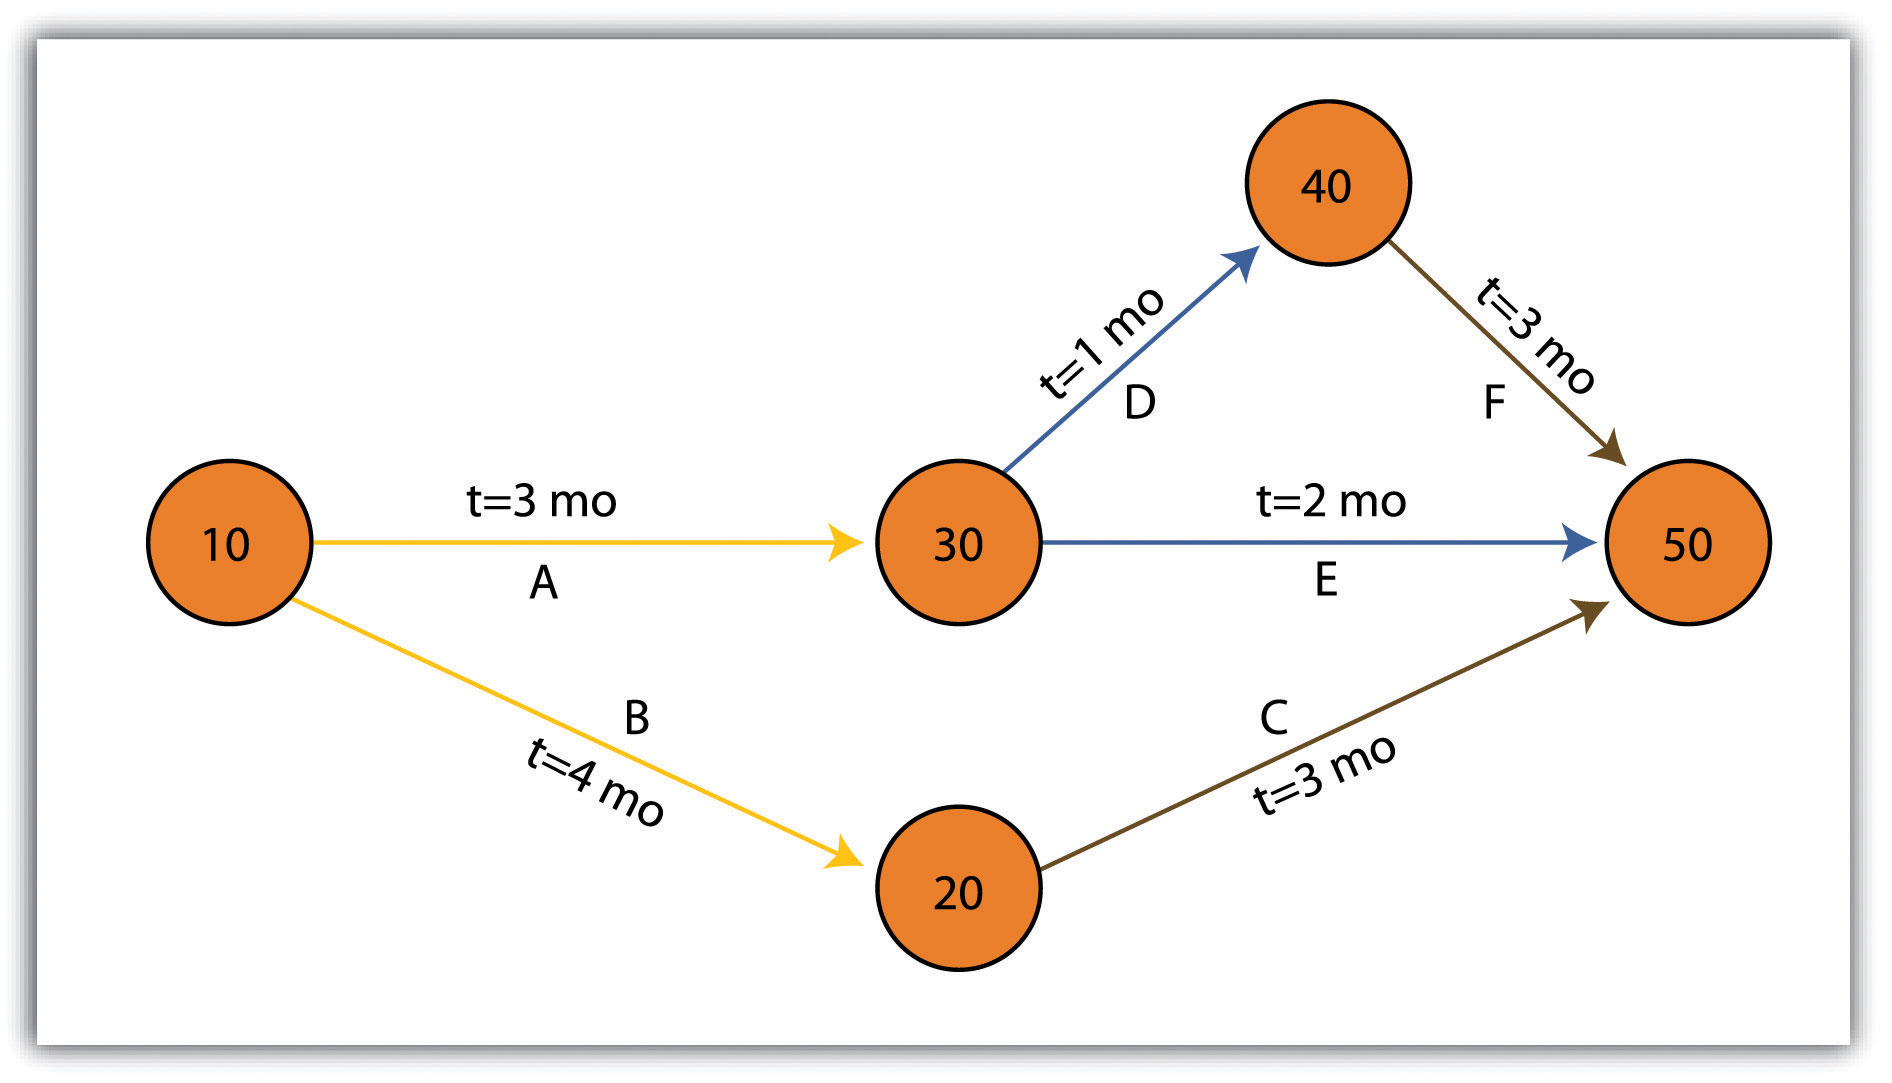
PERT (Program Evaluation and Review Technique) charts are similar to Gantt charts in that they are both used to coordinate task completion for a given project (Figure 10.3 "PERT Chart"). PERT charts focus more on the events of a project than on the start and completion dates as seen with the Gantt charts. This methodology is more often used with very large projects where adherence to strict time guidelines is more important than monetary considerations. PERT charts include the identification of the project’s critical path. After estimating the best- and worst-case scenario regarding the time to finish all tasks, the critical path outlines the sequence of events that results in the longest potential duration for the project. Delays to any of the critical path tasks will result in a net delay to project completion and therefore must be closely monitored by the project manager.
Figure 10.3 PERT Chart
There are some advantages and disadvantages to both the Gantt and PERT chart types. Gantt charts are preferred when working with small, linear projects (with less than thirty or so tasks, each of which occurs sequentially). Larger projects (1) will not fit onto a single Gantt display, making them more difficult to visualize, and (2) quickly become too complex for the information therein to be related effectively. Gantt charts can also be problematic because they require a strong sense of the entire project’s timing before the first task has even been committed to the page. Also, Gantt charts don’t take correlations between separate tasks into account. Finally, any change to the scheduling of the tasks in a Gantt chart results in having to recreate the entire schedule, which can be a time-consuming and mind-numbing experience.
PERT charts also suffer from some drawbacks. For example, the time to completion for each individual task is not as clear as it is with the Gantt chart. Also, large project can become very complex and span multiple pages. Because neither method is perfect, project managers will often use Gantt and PERT charts simultaneously to incorporate the benefits of each methodology into their project.
Working with CAD Data
While a GIS commands a large swath of the computer-generated mapping market share, it is not the only cartographic player in town. GIS, as you now hopefully understand, is primarily a database-driven mapping solution. Computer-aided design (CAD), on the other hand, is a graphics-based mapping solution adopted by many cartographers; engineers in particular. Historically speaking, points, lines, and polygons in a CAD system do not link to attributes but are mere drawings representing some reality. CAD software, however, has recently begun to incorporate “smart” features whereby attribute information is explicitly linked to the spatial representations.
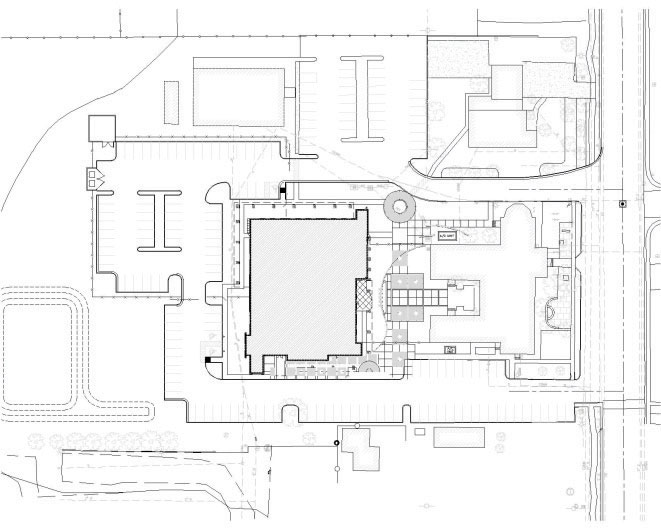
CAD is typically used on many projects related to surveying and civil engineering work. For example, creating a cadastral mapA cadastral map shows the boundaries and ownership of land parcel. for a housing development is a complex matter with a fine scale of exactitude required to ensure, for example, that all electrical, sewer, transportation, and gas lines meet at precise locales (Figure 10.4 "CAD Drawing of a Conceptual Land Development Project"). An error of inches, in either the vertical or horizontal dimension, could result in a need for a major plan redesign that may cost the client an inordinate amount of time and money. Too many of these types of errors, and you and your engineer may soon be looking for a new job.
Figure 10.4 CAD Drawing of a Conceptual Land Development Project
Regardless, the CAD drawing used to create these development plans is usually only concerned with the local information in and around the project site that directly affects the construction of the housing units, such as local elevation, soil/substrates, land-use/land-cover types, surface water flows, and groundwater resources. Therefore, local coordinate systems are typically employed by the civil engineer whereby the origin coordinate (the 0, 0 point) is based off of some nearby landmark such as a manhole, fire hydrant, stake, or some other survey control point. While this is acceptable for engineers, the GIS user typically is concerned not only with local phenomena but also with tying the project into a larger world.
For example, if a development project impacts a natural watercourse in the state of California, agencies such as the US Army Corps of Engineers (a nationwide government agency), California Department of Fish and Game (a statewide government agency), and the Regional Water Quality Control Board (a local government agency) will each exert some regulatory requirements over the developer. These agencies will want to know where the watercourse originates, where it flows to, where within the length of the watercourse the development project occurs, and what percentage of the watercourse will be impacted. These concerns can only be addressed by looking at the project in the larger context of the surrounding watershed(s) within which the project occurs. To accomplish this, external, standardized GIS datasets must be brought to bear on the project (e.g., national river reaches, stream flow and rain gauges, habitat maps, national soil surveys, and regional land-use/land-cover maps). These datasets will normally be georeferenced to some global standard and therefore will not automatically overlay with the engineer’s local CAD data.
As project manager, it will be your team’s duty to import the CAD data (typically DWG, DGN, or DXF file format) and align it exactly with the other, georeferenced GIS data layers. While this has not been an easy task historically, sophisticated tools are being developed by both CAD and GIS software packages to ensure that they “play nicely” with each other. For example, ESRI’s ArcGIS software package contains a “Georeferencing” toolbar that allows users to shift, pan, resize, rotate, and add control points to assist in the realignment of CAD data.
Application Development
As project manager, you may discover that the GIS software package employed by your workgroup is missing some basic functionality that would greatly enhance the productivity of your team. In these cases, it may be worthwhile to create your own GIS application(s). GIS applications are either stand-alone GIS software packages or customizations of a preexisting GIS software package that are made to meet some specific project need. These applications can range from simple (e.g., apply a standard symbol/color set and text guidelines to mapped features) to complex (e.g., sort layers, select features based on a predefined set of rules, perform a spatial analysis, and output a hard-copy map).
Some of the more simple applications can be created by using the canned tool sets and functionality provided in the GIS software. For example, ESRI’s ArcGIS software package includes a macro language called Model Builder that allows users with no knowledge of programming languages create a series of automated tasks, also called workflows, which can be chained together and executed multiple times to reduce the redundancy associated with many types of GIS analyses. The more complex applications will most likely require the use of the GIS software’s native macro language or to write original code using some compatible programming language. To return to the example of ESRI products, ArcGIS provides the ability to develop and incorporate user-written programs, called scripts, into to standard platform. These scripts can be written in the Python, VBScript, JScript, and Perl programming languages.
While you may want to create a GIS application from the ground up to meet your project needs, there are many that have already been developed. These pre-written applications, many of which are open source, may be employed by your project team to reduce the time, money, and headache associated with such an effort. A sampling of the open-source GIS applications written for the C-family of programming languages are as follows (Ramsey 2007):Ramsey, P. 2007. “The State of Open Source GIS.” Refractions Research. http://www.refractions.net/expertise/whitepapers/opensourcesurvey/survey-open-source-2007-12.pdf.
- MapGuide Open Source (http://mapguide.osgeo.org)—A web-based application developed to provide a full suite of analysis and viewing tools across platforms
- OSSIM (http://www.ossim.org)—“Open Source Software Image Map” is an application developed to efficiently process very large raster images
- GRASS (http://grass.itc.it)—The oldest open-source GIS product, GRASS was developed by the US Army for complex data analysis and modeling
- MapServer (http://mapserver.gis.umn.edu)—A popular Internet map server that renders GIS data into cartographic map products
- QGIS (http://www.qgis.org)—A GIS viewing environment for the Linux operating system
- PostGIS (http://postgis.refractions.net)—An application that adds spatial data analysis and manipulation functionality to the PostgreSQL database program
- GMT (http://gmt.soest.hawaii.edu)—“Generic Mapping Tools” provides a suite of data manipulation and graphic generation tools that can be chained together to create complex data analysis flows
GIS applications, however, are not always created from scratch. Many of them incorporate open-source shared libraries that perform functions such as format support, geoprocessing, and reprojection of coordinate systems. A sampling of these libraries is as follows:
- GDAL/OGR (http://www.gdal.org)—“Geospatial Data Abstraction Library/OpenGIS Simple Features Reference Implementation” is a compilation of translators for raster and vector geospatial data formats
- Proj4 (http://proj.maptools.org)—A compilation of projection tools capable of transforming different cartographic projection systems, spheroids, and data points.
- GEOS (http://geos.refractions.net)—“Geometry Engine, Open Source” is a compilation of functions for processing 2-D linear geometry
- Mapnik (http://www.mapnik.org)—A tool kit for developing visually appealing maps from preexisting file types (e.g., shapefiles, TIFF, OGR/GDAL)
- FDO (http://fdo.osgeo.org)—“Feature Data Objects” is similar to, although more complex than, GDAL/OGR in that it provides tools for manipulating, defining, translating, and analyzing geospatial datasets
While the C-based applications and libraries noted earlier are common due to their extensive time in development, newer language families are supported as well. For example, Java has been used to develop unique applications (e.g., gvSIG, OpenMap, uDig, Geoserver, JUMP, and DeeGree) from its libraries (GeoAPI, WKB4J, GeoTools, and JTS Topology Suite), while .Net applications (e.g., MapWindow, WorldWind, SharpMap) are a new but powerful application option that support their own libraries (Proj.Net, NTS) as well as the C-based libraries.
Map Series
A project manager will often be required to produce paper and/or digital maps of the project site. These maps will typically include standard information such as a title, north arrow, scale bar, corporate contact information, data source, and so forth. This is simple if the site is small enough that the pertinent mapped features can be resolved on a single map. However, problems arise if the site is exceedingly large, follows a linear pathway (e.g., highway improvement projects), or is composed of distant, noncontiguous site locales. In these cases, the manager will need to create a series of easily referenced and reproduced maps that are at the exact same scale, have minimal overlap, and maintain consistent collar material throughout.
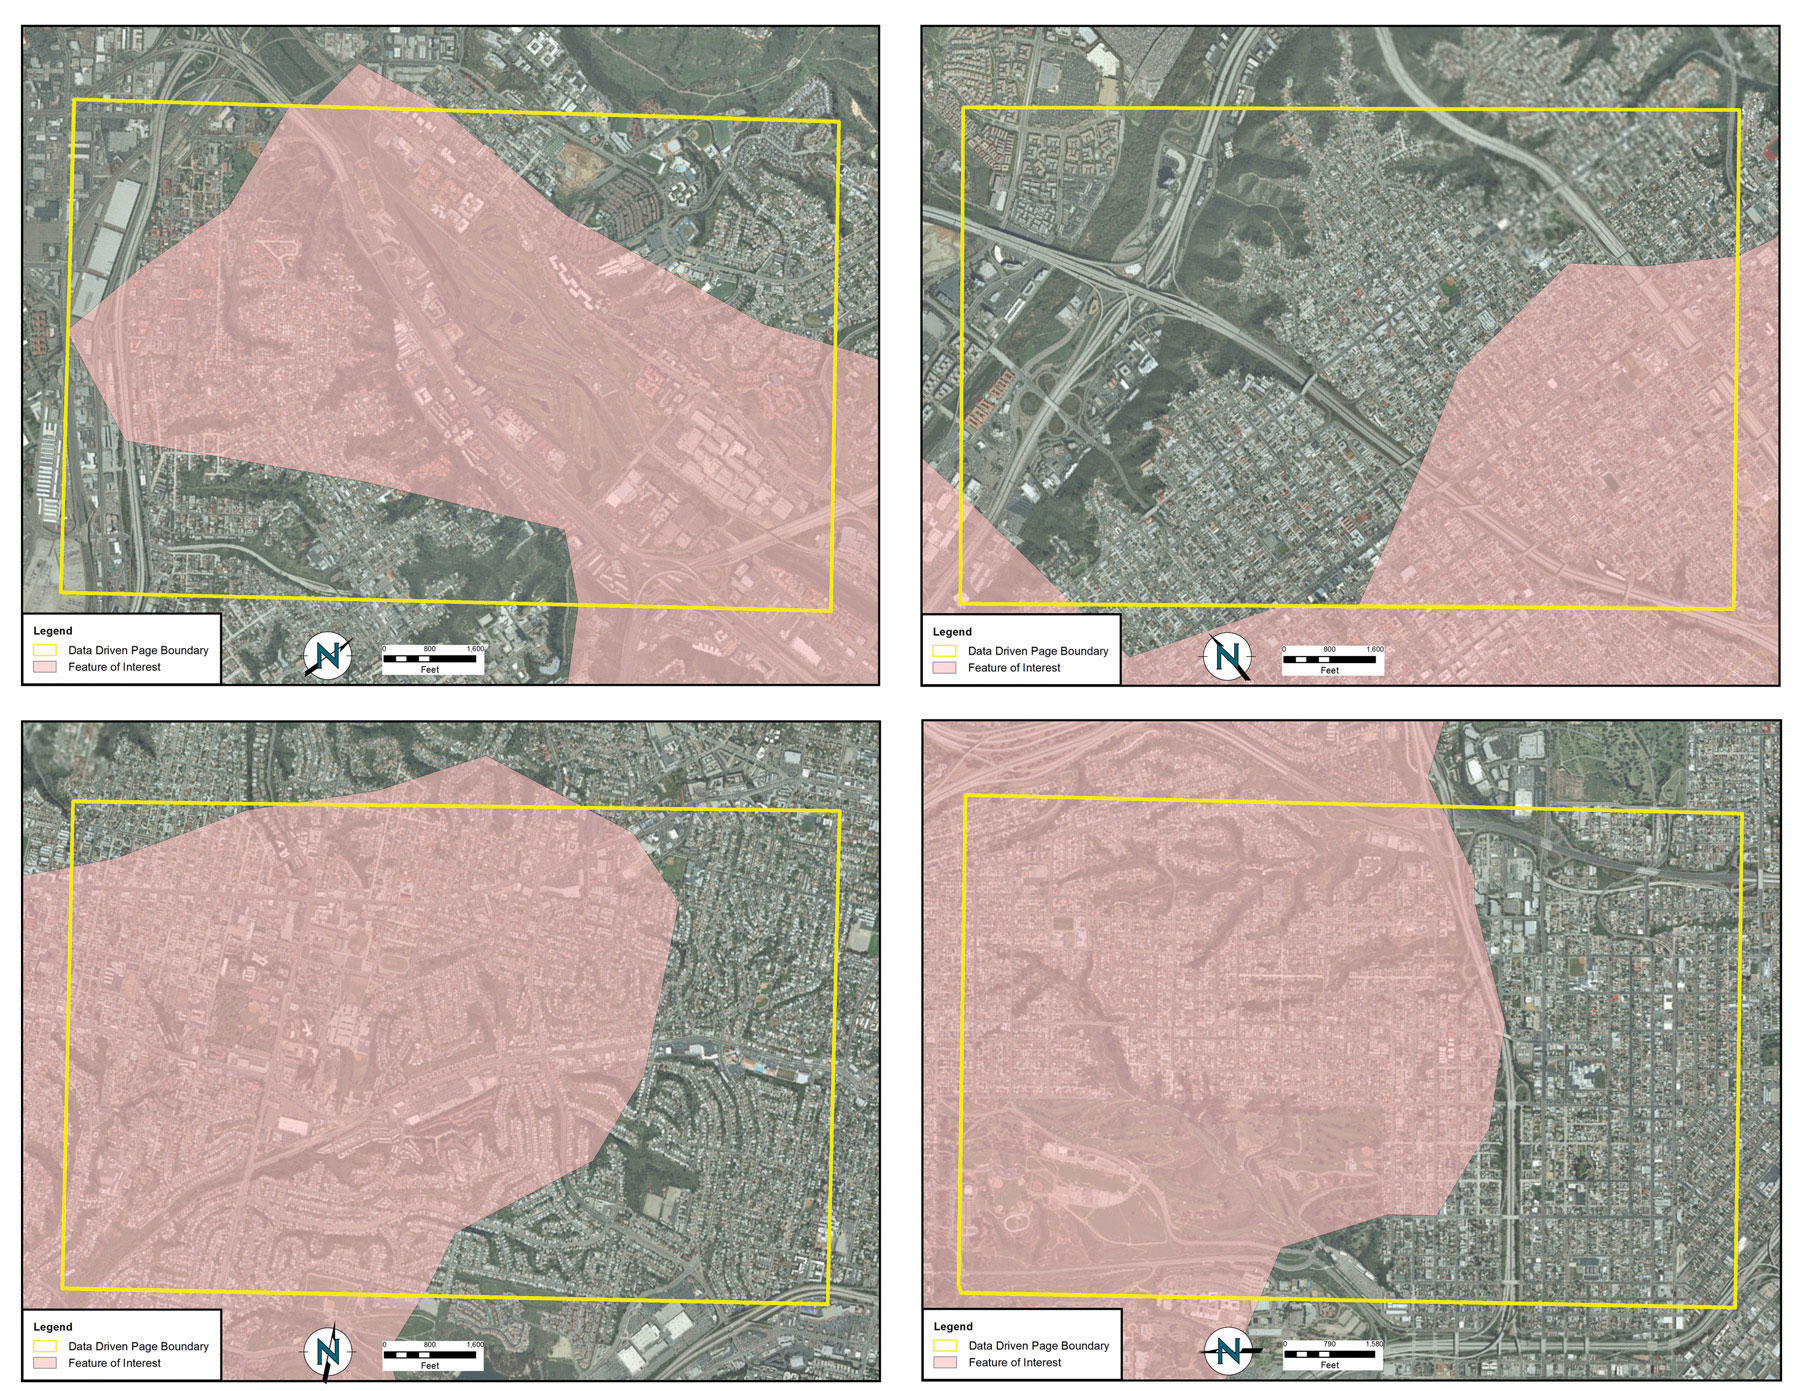
To accomplish this task, a map series can be employed to create standardized maps from the GIS (e.g., “DS Map Book” for ArcGIS 9; “Data Driven Pages” for ArcGIS 10). A map series is essentially a multipage document created by dividing the overall data frame into unique tiles based on a user-defined index gridA polygon outline showing the location and extent of each map in the series.. Figure 10.5 "Project Site Tiled into an Output Series" shows an example of a map series that divides a project site into a grid of similar tiles. Figure 10.6 "Output from a Map Series" shows the standardized maps produced when that series is printed. While these maps can certainly be created without the use of a map series generator, this functionality greatly assists in the organization and display of project’s whose extents cannot be represented within a single map.
Figure 10.5 Project Site Tiled into an Output Series
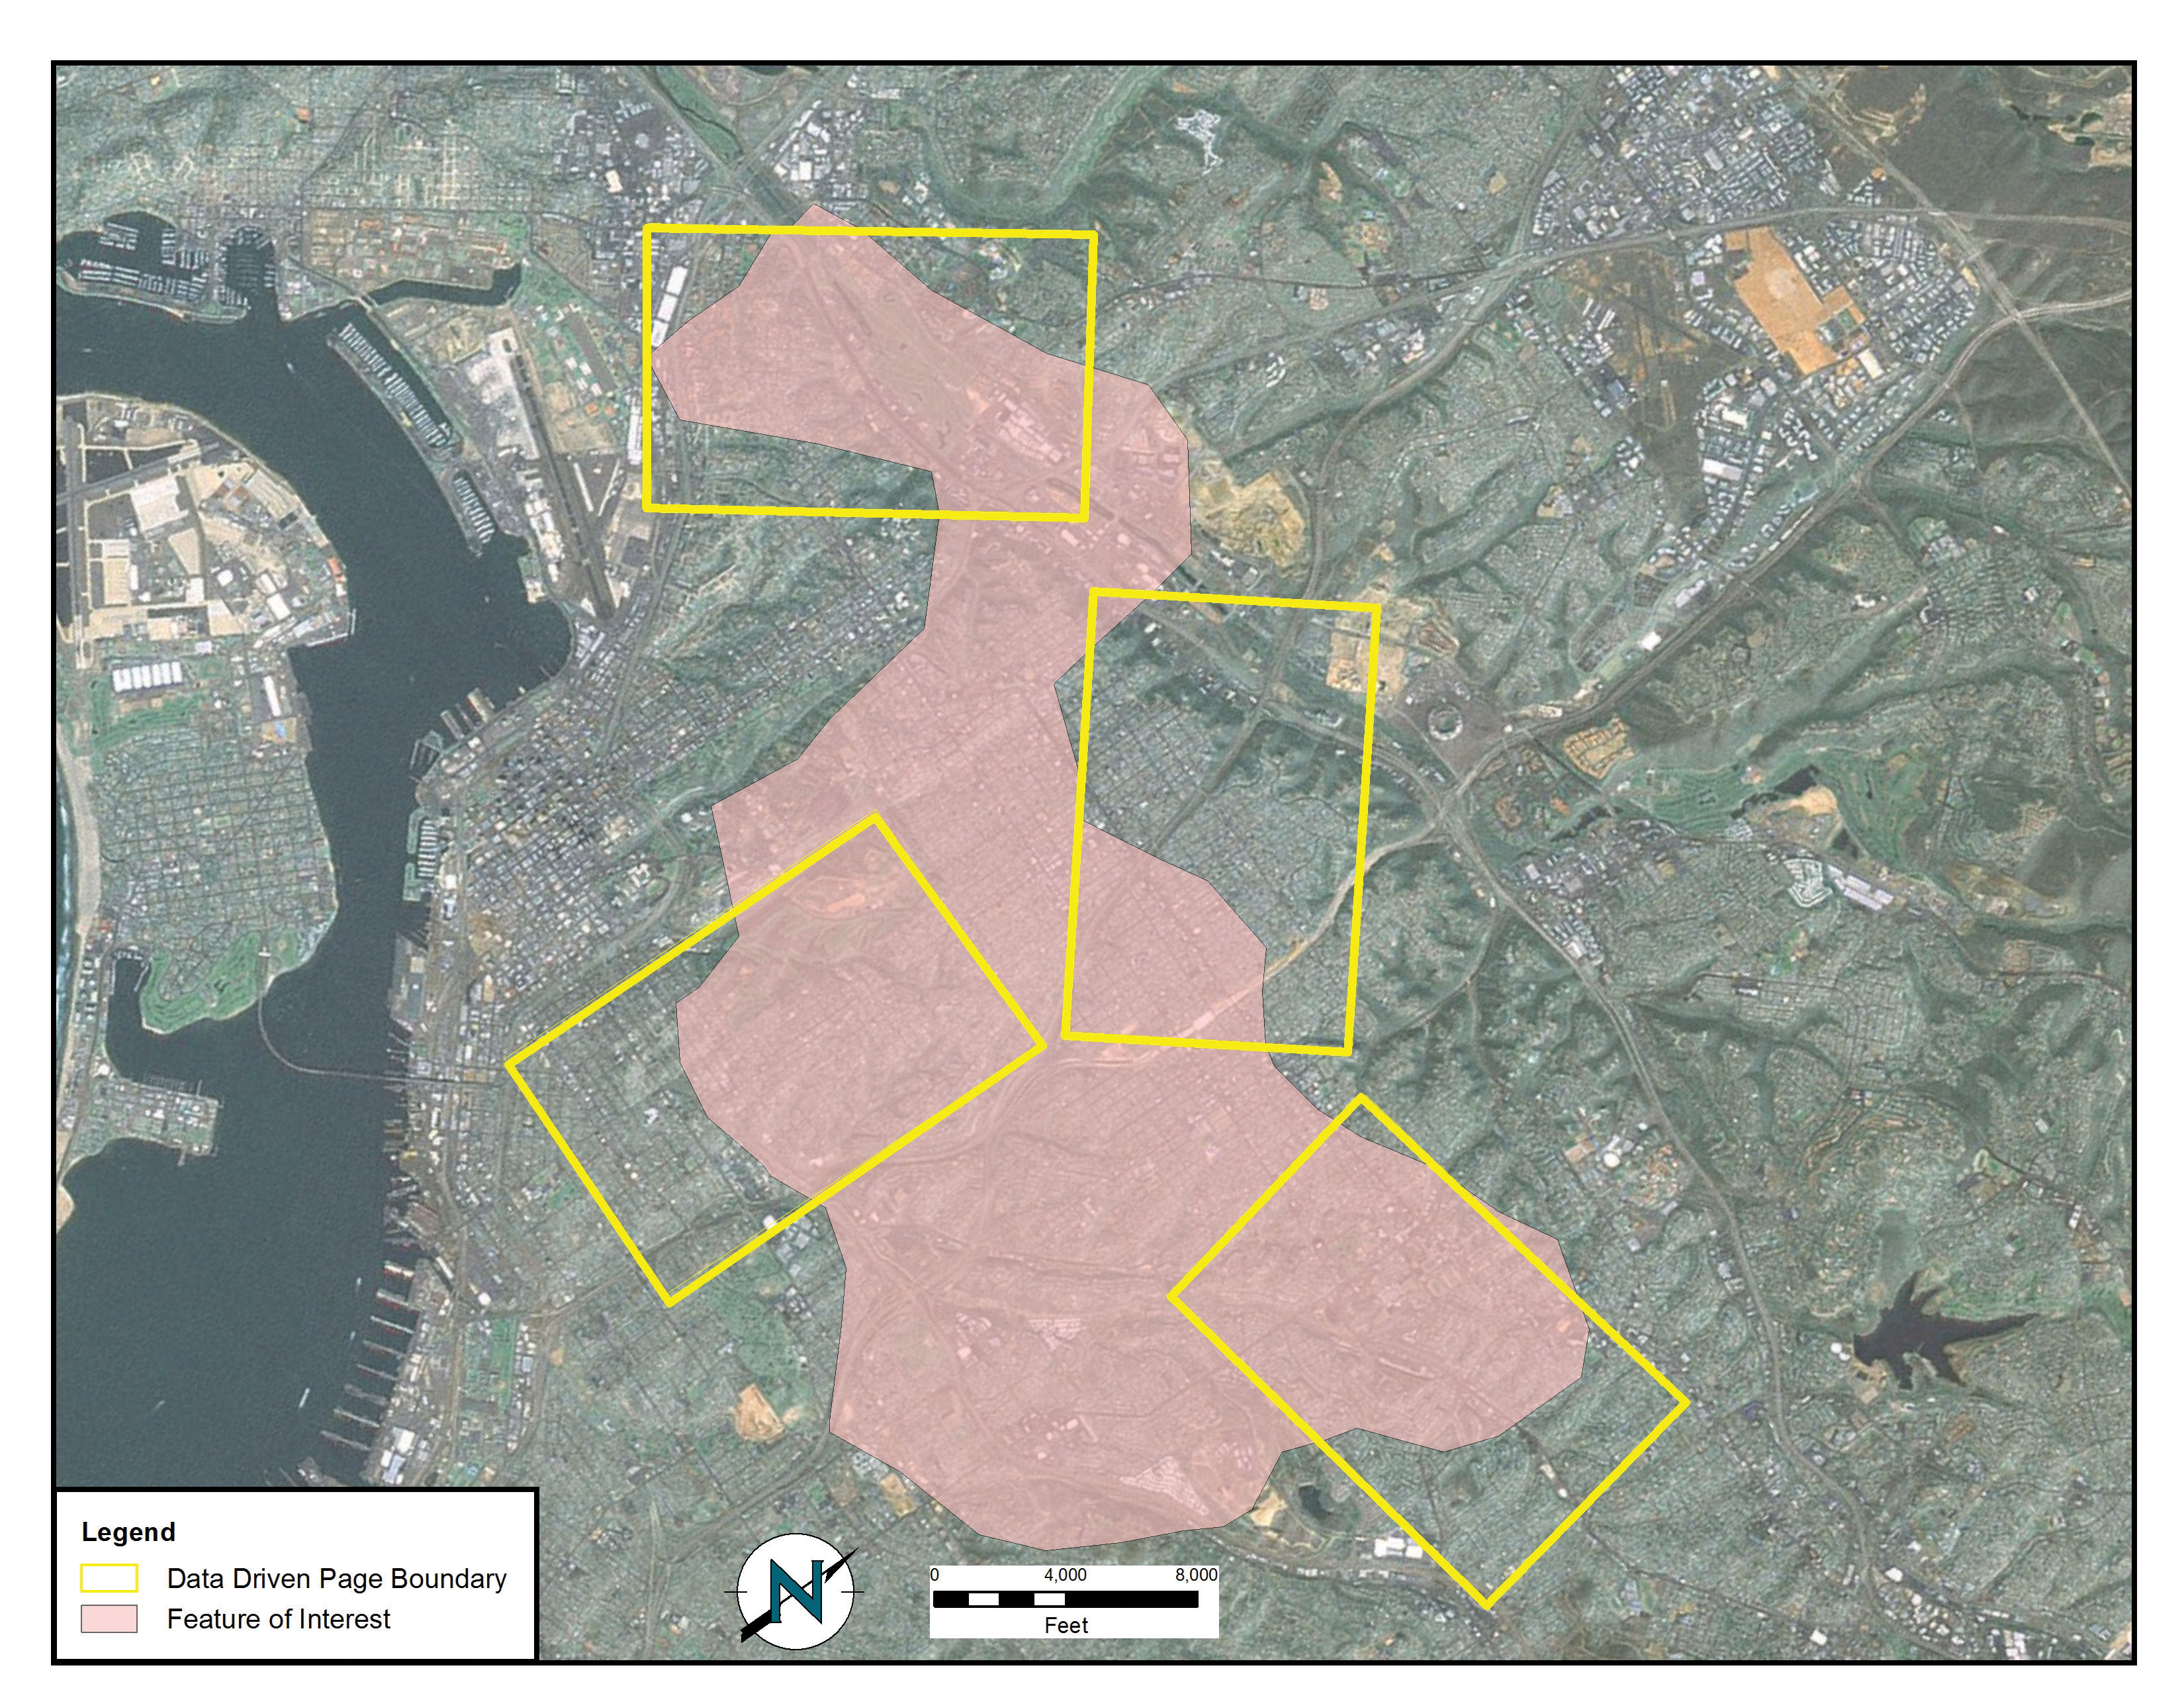
Source: Data available from U.S. Geological Survey, Earth Resources Observation and Science (EROS) Center, Sioux Falls, SD.
Figure 10.6 Output from a Map Series
Source: Data available from U.S. Geological Survey, Earth Resources Observation and Science (EROS) Center, Sioux Falls, SD.
Grid-to-Ground Transformations
Project managers must be mindful of the transition from in-program mapped units to real-world locations. As discussed in Chapter 3 "Data, Information, and Where to Find Them", Section 3.2 "Data about Data", transforming the three-dimensional earth to two dimensions necessarily results in both accuracy and precision errors. While projects that cover a small areal extent may not noticeably suffer from this error, projects that cover a large areal extent could run into substantial problems.
When surveyors measure the angles and distances of features on the earth for input into a GIS, they are taking “ground” measurements. However, spatial datasets in a GIS are based on a predefined coordinate system, referred to as “grid” measurements. In the case of angles, ground measurements are taken relative to some north standard such as true north, grid north, or magnetic north. Grid measurements are always relative to the coordinate system’s grid north. Therefore, grid north and ground north may well need to be rotated in order to align correctly.
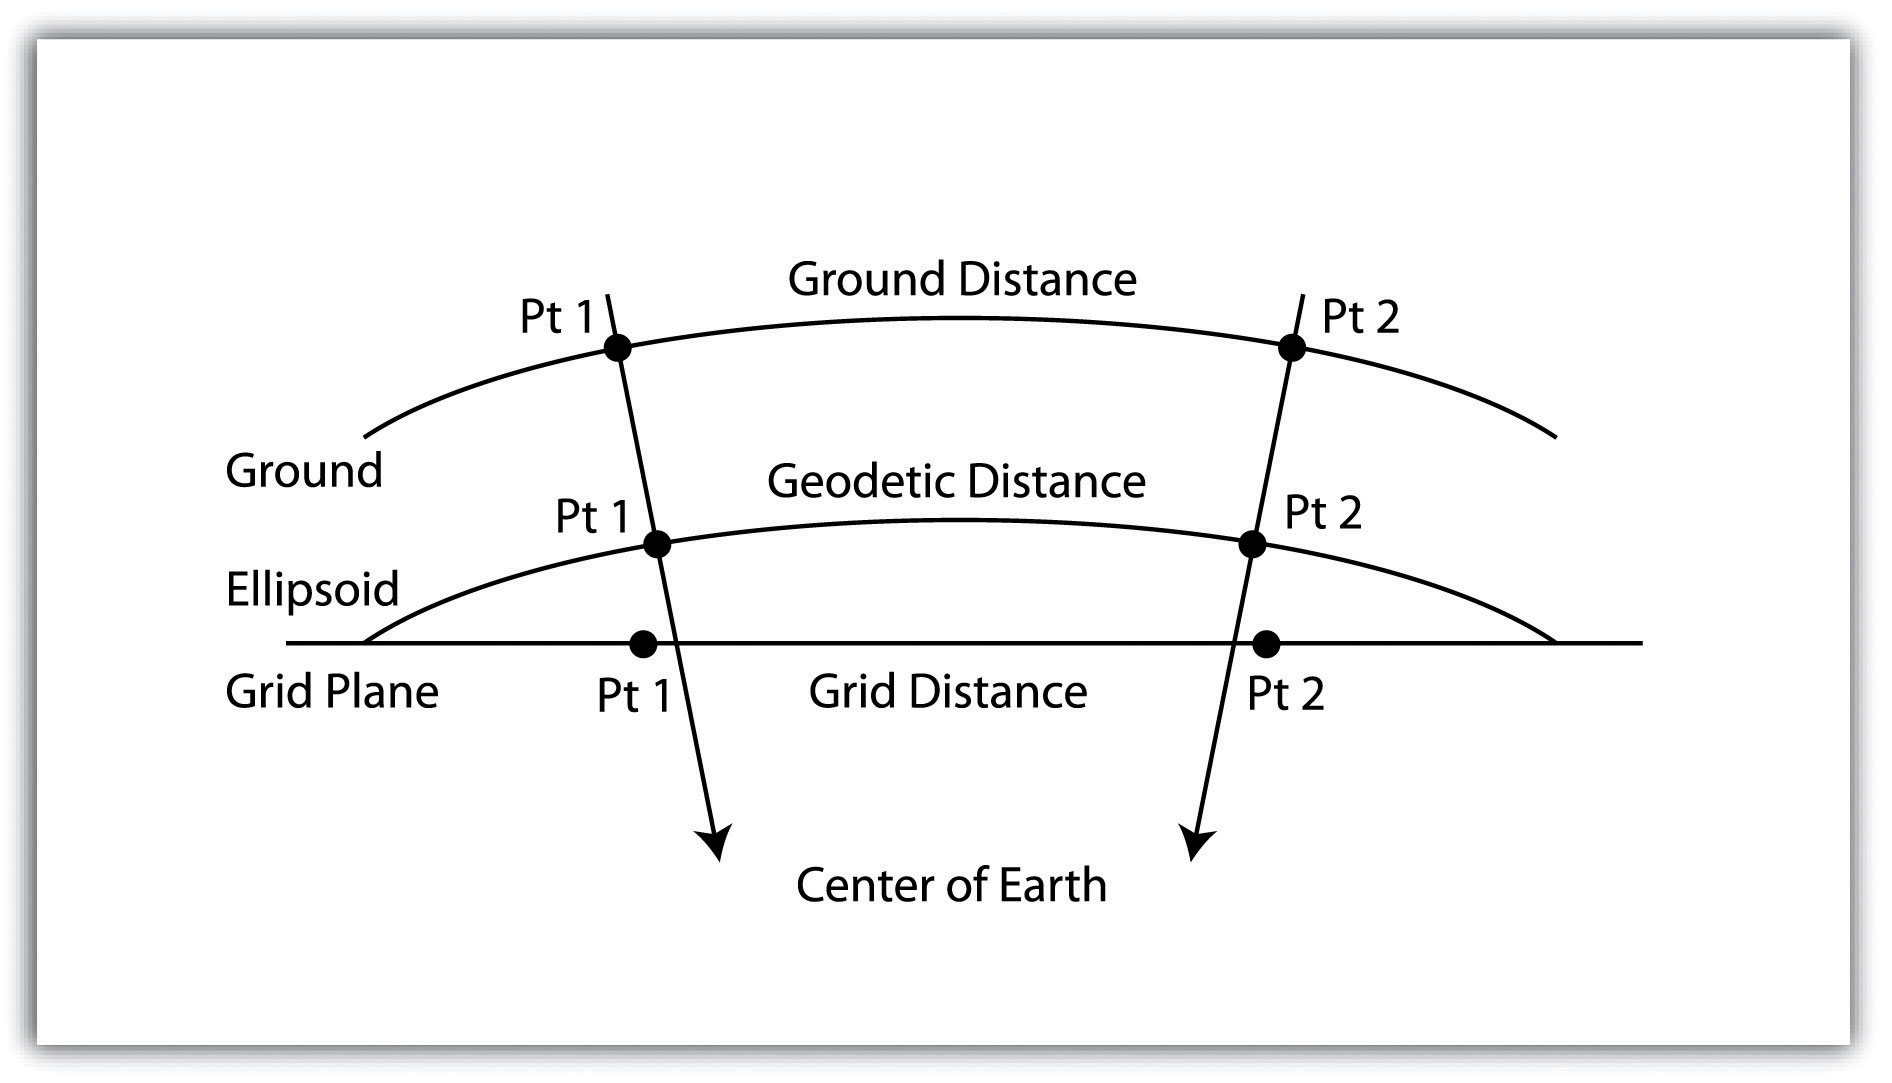
In the case of distances, two sources of error may be present: (1) scale error and (2) elevation error. Scale error refers to the phenomenon whereby points measured on the three-dimensional earth (i.e., ground measurement) must first be translated onto the coordinate system’s ellipsoid (i.e., mean sea level), and then must be translated to the two-dimensional grid plane (Figure 10.7 "Grid-to-Ground Transformation"). Basically, scale error is associated with the move from three to two dimensions and is remedied by applying a scale factor (SF) to any measurements made to the dataset.
Figure 10.7 Grid-to-Ground Transformation
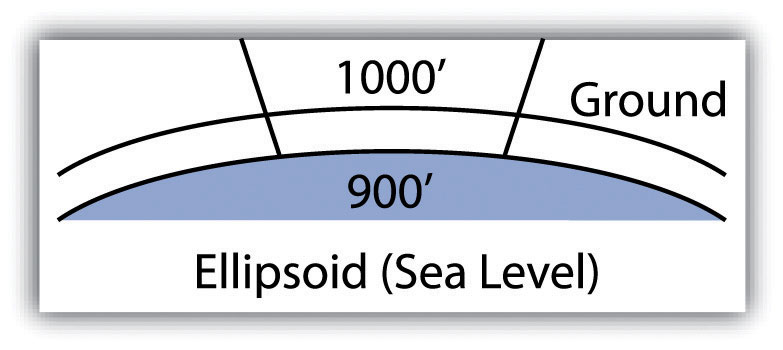
In addition to scale error, elevation error becomes increasingly pronounced as the project site’s elevation begins to rise. Consider Figure 10.8 "Grid versus Ground Measurements", where a line measured as 1,000 feet at altitude must first be scaled down to fit the earth’s ellipsoid measurement, then scaled again to fit the coordinate system’s grid plane. Each such transition requires compensation, referred to as the elevation factor (EF). The SF and EF are often combined into a single combination factor (CF) that is automatically applied to any measurements taken from the GIS.
Figure 10.8 Grid versus Ground Measurements
In addition to EF and SF errors, care must be taken when surveying areas greater than 5 miles in length. At these distances, slight errors will begin to compound and may create noticeable discrepancies. In particular, projects whose length crosses over coordinate systems zones (e.g., Universal Transverse Mercator [UTM] zones or State Plane zones) are likely to suffer from unacceptable grid-to-ground errors.
While the tools and techniques outlined in this section may be considered beyond the scope of an introductory text on GISs, these pages represent some of the concerns that will arise during your tenure as a GIS project manager. Although you will not need a comprehensive understanding of these issues for your first GIS-related jobs, it is important that you understand that becoming a competent GIS user will require a wide-ranging skill set, both technically and interpersonally.
Key Takeaways
- As project manager, you will need to utilize a wide variety of tools and techniques to complete your GIS project.
- The tools and techniques you employ will not necessarily be included as a part of your native GIS software package. In these cases, you will need to apply all project management resources at your disposal.
Exercise
- Consider the following GIS project: You are contacted by the City of Miami to determine the effect of inundation due to sea-level rise on municipal properties over the next hundred years. Assuming that the sea level will rise one meter during that time span, describe in detail the process you would take to respond to this inquiry. Assuming you have two months to complete this task, develop a timeline that shows the steps you would take to respond to the city’s request. In your discussion, include information pertaining to the data layers (both raster and vector), data sources, and data attributes needed to address the problem. Outline some of the geoprocessing steps that would be required to convert your baseline GIS data into project-specific layers that would address this particular problem. Upon completion of the geospatial analysis, how might you employ cartographic principals to most effectively present the data to city officials? Talk about potential problems that may arise during the analysis and discuss how you might go about addressing these issues.