This is “Data Quality”, section 5.4 from the book Geographic Information System Basics (v. 1.0). For details on it (including licensing), click here.
For more information on the source of this book, or why it is available for free, please see the project's home page. You can browse or download additional books there. To download a .zip file containing this book to use offline, simply click here.


5.4 Data Quality
Learning Objective
- The objective of this section is to ascertain the different types of error inherent in geospatial datasets.
Not all geospatial data are created equally. Data quality refers to the ability of a given dataset to satisfy the objective for which it was created. With the voluminous amounts of geospatial data being created and served to the cartographic community, care must be taken by individual geographic information system (GIS) users to ensure that the data employed for their project is suitable for the task at hand.
Two primary attributes characterize data quality. AccuracyHow close a measurement is to its actual value; often expressed as a probability. describes how close a measurement is to its actual value and is often expressed as a probability (e.g., 80 percent of all points are within +/− 5 meters of their true locations). PrecisionThe variance of a value when repeated measurements are taken. refers to the variance of a value when repeated measurements are taken. A watch may be correct to 1/1000th of a second (precise) but may be 30 minutes slow (not accurate). As you can see in Figure 5.12 "Accuracy and Precision", the blue darts are both precise and accurate, while the red darts are precise but inaccurate.
Figure 5.12 Accuracy and Precision

Several types of error can arise when accuracy and/or precision requirements are not met during data capture and creation. Positional accuracyThe probability of a feature being within +/− units of either its true location on earth (absolute positional accuracy) or its location in relation to other mapped features (relative positional accuracy). is the probability of a feature being within +/− units of either its true location on earth (absolute positional accuracy) or its location in relation to other mapped features (relative positional accuracy). For example, it could be said that a particular mapping effort may result in 95 percent of trees being mapped to within +/− 5 feet for their true location (absolute), or 95 percent of trees are mapped to within +/− 5 feet of their location as observed on a digital ortho quarter quadrangle (relative).
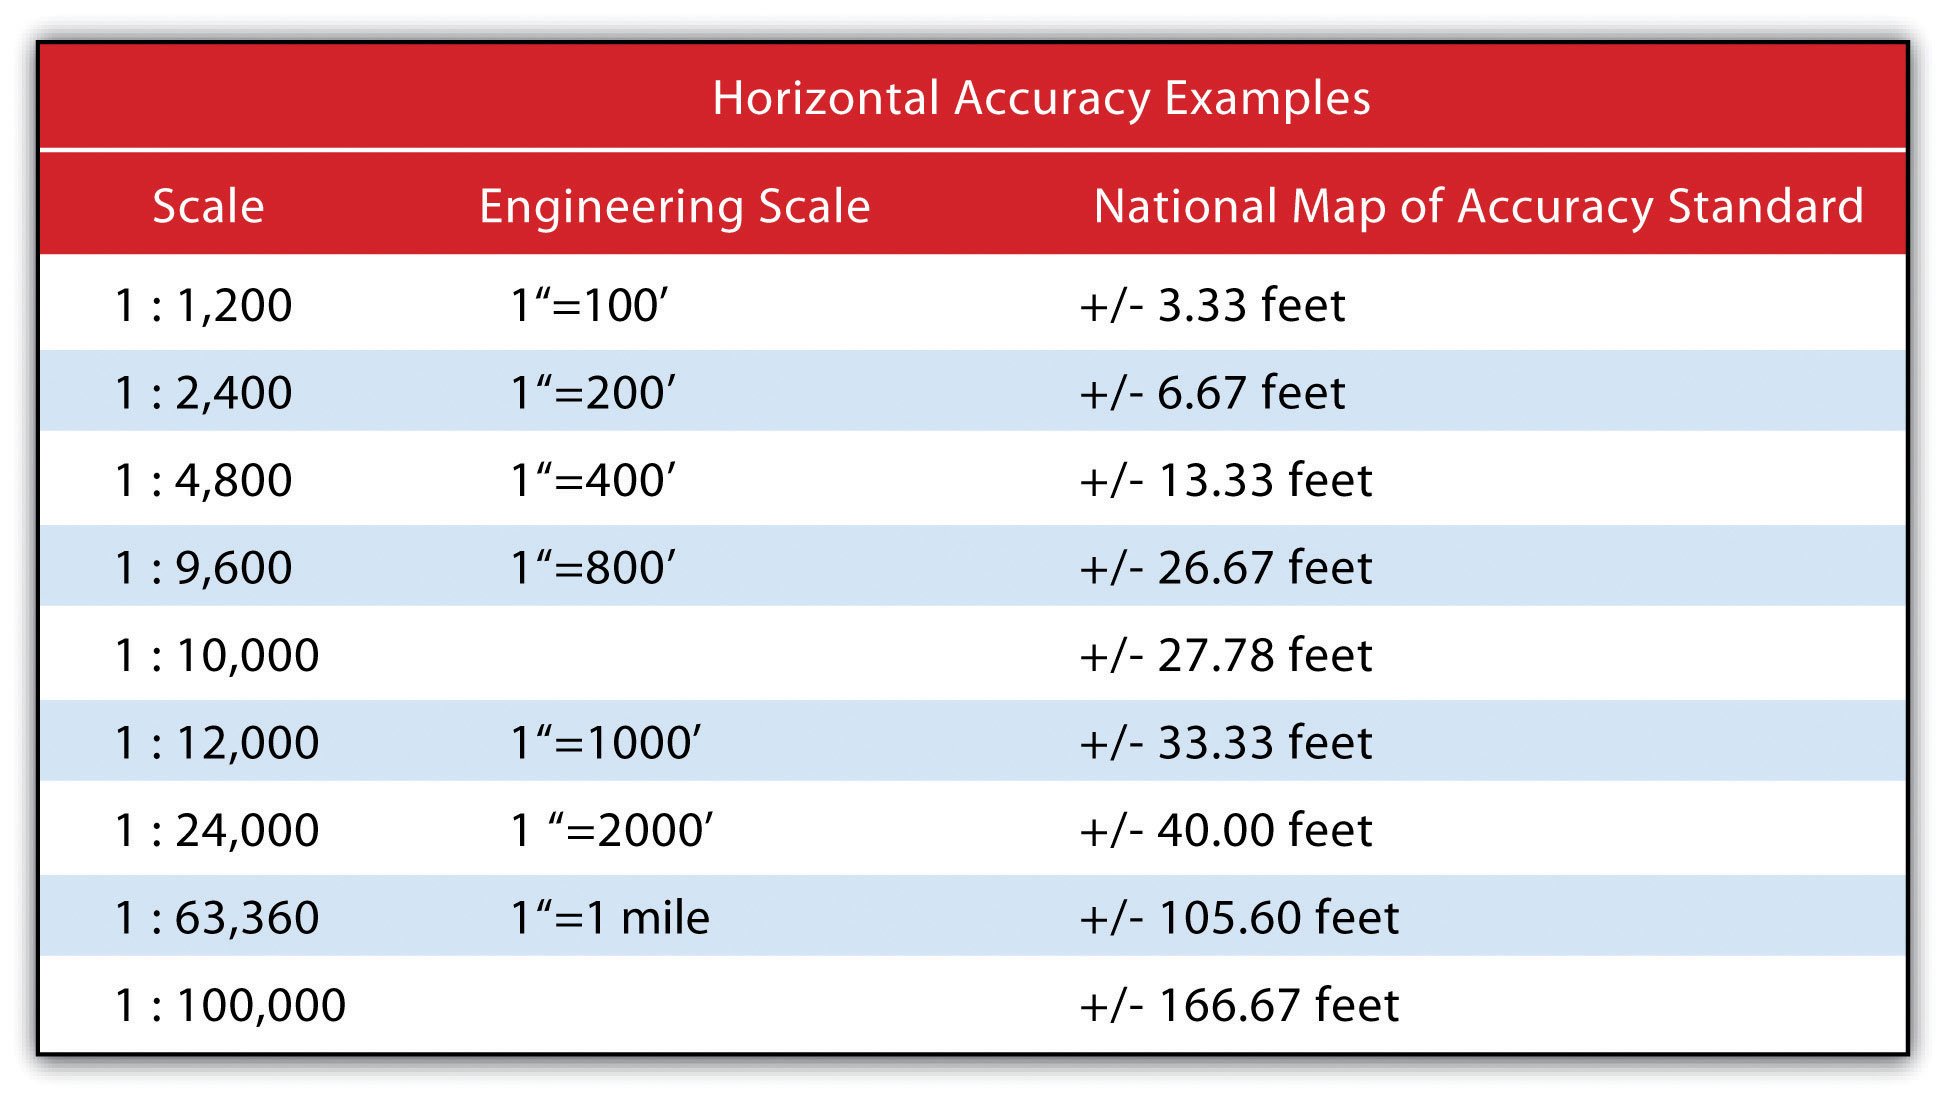
Speaking about absolute positional error does beg the question, however, of what exactly is the true location of an object? As discussed in Chapter 2 "Map Anatomy", differing conceptions of the earth’s shape has led to a plethora of projections, data points, and spheroids, each attempting to clarify positional errors for particular locations on the earth. To begin addressing this unanswerable question, the US National Map Accuracy Standard (or NMAS) suggests that to meet horizontal accuracy requirements, a paper map is expected to have no more than 10 percent of measurable points fall outside the accuracy values range shown in Figure 5.13 "Relation between Positional Error and Scale". Similarly, the vertical accuracy of no more than 10 percent of elevations on a contour map shall be in error of more than one-half the contour interval. Any map that does not meet these horizontal and vertical accuracy standards will be deemed unacceptable for publication.
Figure 5.13 Relation between Positional Error and Scale
Positional errors arise via multiple sources. The process of digitizing paper maps commonly introduces such inaccuracies. Errors can arise while registering the map on the digitizing board. A paper map can shrink, stretch, or tear over time, changing the dimensions of the scene. Input errors created from hastily digitized points are common. Finally, converting between coordinate systems and transforming between data points may also introduce errors to the dataset.
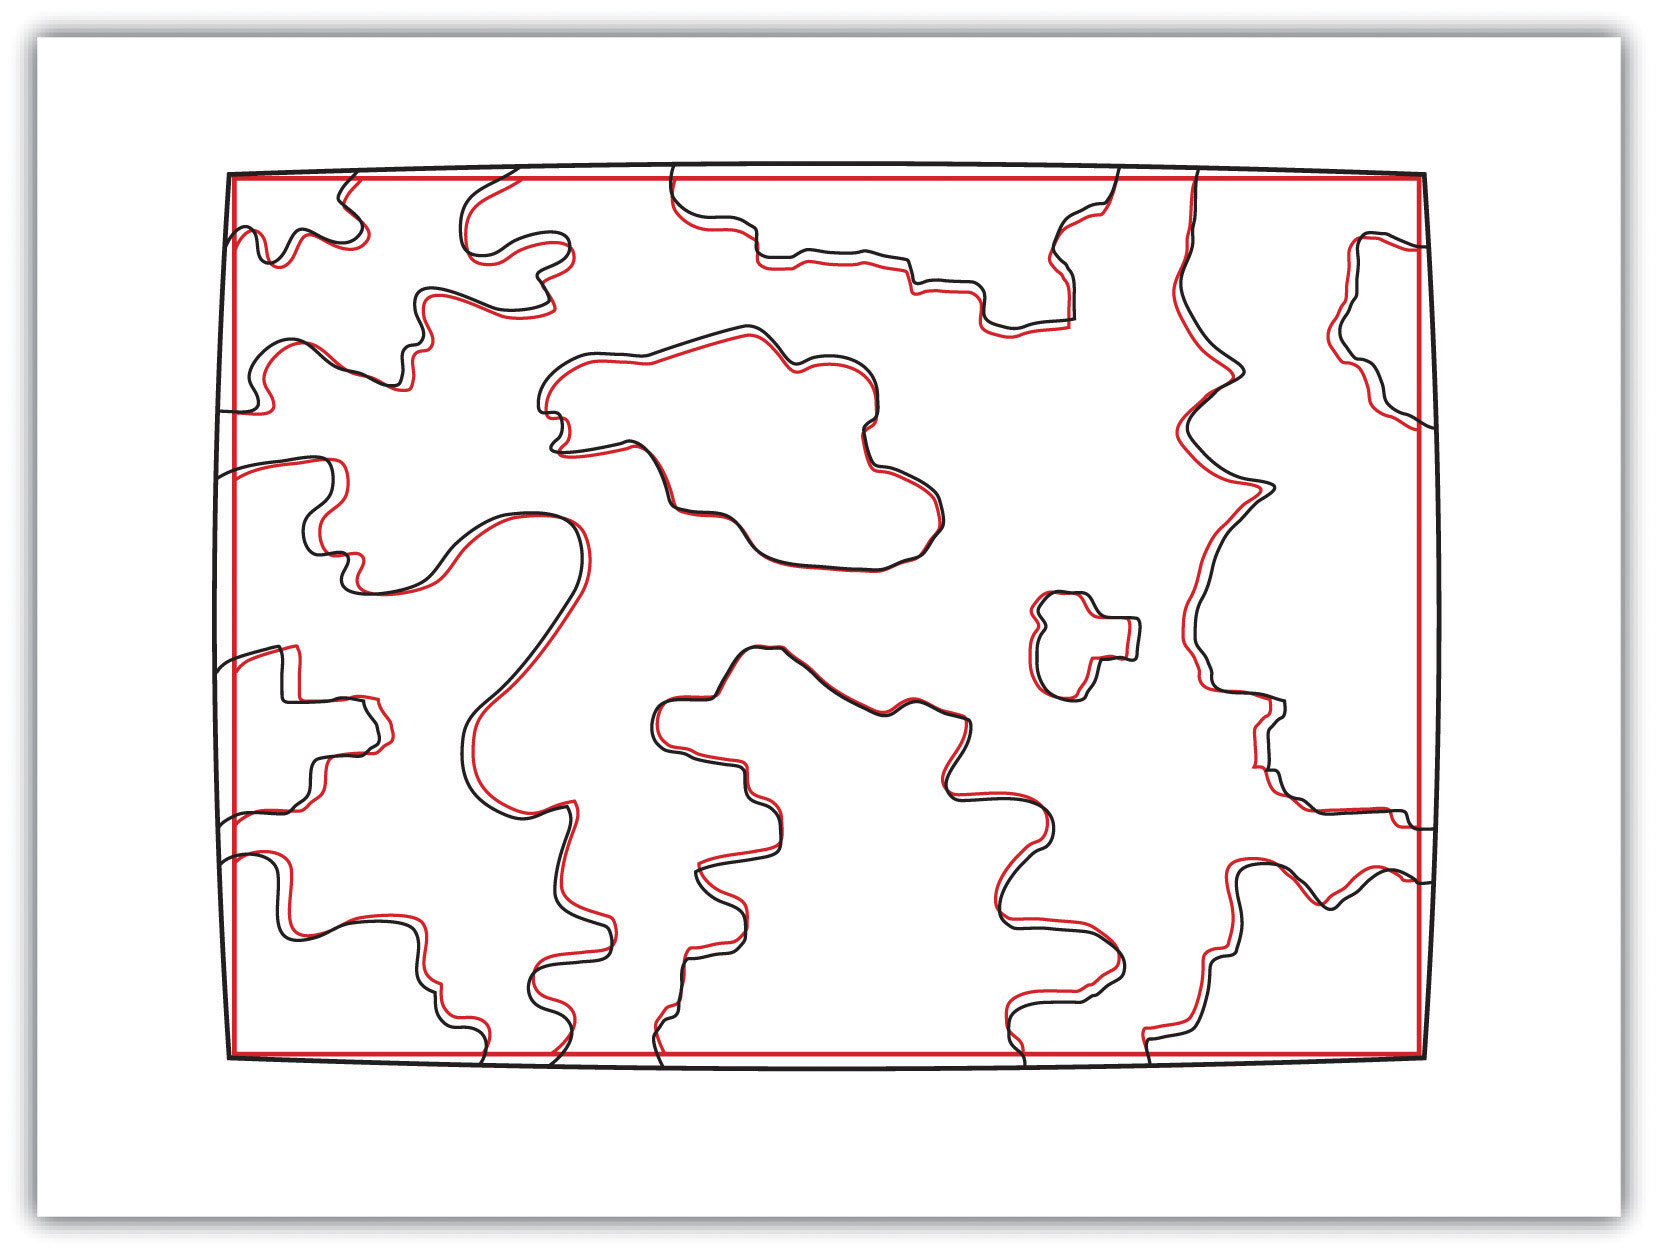
The root-mean square (RMS) error is frequently used to evaluate the degree of inaccuracy in a digitized map. This statistic measures the deviation between the actual (true) and estimated (digitized) locations of the control points. Figure 5.14 "Potential Digitization Error" illustrates the inaccuracies of lines representing soil types that result from input control point location errors. By applying an RMS error calculation to the dataset, one could determine the accuracy of the digitized map and thus determine its suitability for inclusion in a given study.
Figure 5.14 Potential Digitization Error
Positional errors can also arise when features to be mapped are inherently vague. Take the example of a wetland (Figure 5.15 "Defining a Wetland Boundary"). What defines a wetland boundary? Wetlands are determined by a combination of hydrologic, vegetative, and edaphic factors. Although the US Army Corps of Engineers is currently responsible for defining the boundary of wetlands throughout the country, this task is not as simple as it may seem. In particular, regional differences in the characteristics of a wetland make delineating these features particularly troublesome. For example, the definition of a wetland boundary for the riverine wetlands in the eastern United States, where water is abundant, is often useless when delineating similar types of wetlands in the desert southwest United States. Indeed, the complexity and confusion associated with the conception of what a “wetland” is may result in difficulties defining the feature in the field, which subsequently leads to positional accuracy errors in the GIS database.
Figure 5.15 Defining a Wetland Boundary

In addition to positional accuracy, attribute accuracyThe difference between information as recorded in an attribute table and the real-world features they represent. is a common source of error in a GIS. Attribute errors can occur when an incorrect value is recorded within the attribute field or when a field is missing a value. Misspelled words and other typographical errors are common as well. Similarly, a common inaccuracy occurs when developers enter “0” in an attribute field when the value is actually “null.” This is common in count data where “0” would represent zero findings, while a “null” would represent a locale where no data collection effort was undertaken. In the case of categorical values, inaccuracies occasionally occur when attributes are mislabeled. For example, a land-use/land-cover map may list a polygon as “agricultural” when it is, in fact, “residential.” This is particularly true if the dataset is out of date, which leads us to our next source of error.
Temporal accuracyThe potential error related to the age or timeliness of a dataset. addresses the age or timeliness of a dataset. No dataset is ever completely current. In the time it takes to create the dataset, it has already become outdated. Regardless, there are several dates to be aware of while using a dataset. These dates should be found within the metadata. The publication date will tell you when the dataset was created and/or released. The field date relates the date and time the data was collected. If the dataset contains any future prediction, there should also be a forecast period and/or date. To address temporal accuracy, many datasets undergo a regular data update regimen. For example, the California Department of Fish and Game updates its sensitive species databases on a near monthly basis as new findings are continually being made. It is important to ensure that, as an end-user, you are constantly using the most up-to-date data for your GIS application.
The fourth type of accuracy in a GIS is logical consistencyA trait exhibited by data that is topologically correct.. Logical consistency requires that the data are topologically correct. For example, does a stream segment of a line shapefile fall within the floodplain of the corresponding polygon shapefile? Do roadways connect at nodes? Do all the connections and flows point in the correct direction in a network? In regards to the last question, the author was recently using an unnamed smartphone application to navigate a busy city roadway and was twice told to turn the wrong direction down one-way streets. So beware, errors in logical consistency may lead to traffic violations, or worse!
The final type of accuracy is data completenessThe trait of a dataset comprehensively including all features required to ensure accurate mapping results.. Comprehensive inclusion of all features within the GIS database is required to ensure accurate mapping results. Simply put, all the data must be present for a dataset to be accurate. Are all of the counties in the state represented? Are all of the stream segments included in the river network? Is every convenience store listed in the database? Are only certain types of convenience stores listed within the database? Indeed, incomplete data will inevitably lead to incomplete or insufficient analysis.
Key Takeaways
- All geospatial data contains error.
- Accuracy represents how close a measurement is to its actual value, while precision refers to the variance of a value when repeated measurements are taken.
- The five types of error in a geospatial dataset are related to positional accuracy, attribute accuracy, temporal accuracy, logical consistency, and data completeness.
Exercises
- What are the five types of accuracy/precision errors associated geographic information? Provide an example of each type of error.
- Per the description of the positional accuracy of wetland boundaries, discuss a map feature whose boundaries are inherently vague and difficult to map.