This is “Interest-Rate Determinants I: The Risk Structure”, section 6.1 from the book Finance, Banking, and Money (v. 2.0). For details on it (including licensing), click here.
For more information on the source of this book, or why it is available for free, please see the project's home page. You can browse or download additional books there. To download a .zip file containing this book to use offline, simply click here.


6.1 Interest-Rate Determinants I: The Risk Structure
Learning Objective
- What is the risk structure of interest rates and flight to quality, and what do they explain?
In this chapter, we’re going to figure out, as best we can, why yields on different types of bonds differ. The analysis will help us to understand a couple of stylized facts derived from the history of interest rates and Figure 6.1 "The risk structure of interest rates in the United States, 1919–2010" and Figure 6.2 "The term structure of interest rates in the United States, 1960–2010":
Figure 6.1 The risk structure of interest rates in the United States, 1919–2010
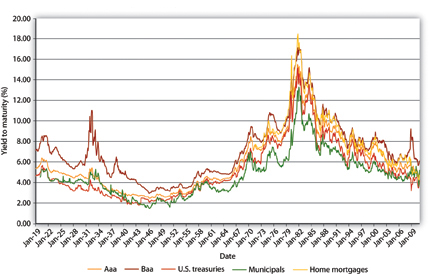
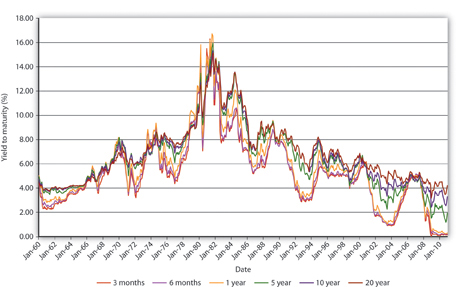
Figure 6.2 The term structure of interest rates in the United States, 1960–2010
- Why the yields on Baa corporate bonds are always higher than the yields on Aaa corporate bonds, which in turn are higher than those on Treasury bonds (issued by the federal government), which for a long time have been higher still than those on munis (bonds issued by municipalities, like state and local governments)
- Why the yields on corporate Baa bonds bucked the trend of lower rates in the early 1930s and why, at one time, municipal bonds yielded more than Treasuries
- Why bonds issued by the same economic entity (the U.S. government) with different maturities generally, but not always, have different yields and why the rank ordering changes over time
Figure 6.1 "The risk structure of interest rates in the United States, 1919–2010", which holds maturity constant, is the easiest to understand because we’ve already discussed the major concepts. We’ll tackle it, and what economists call the risk structure of interest rates, first. Investors care mostly about three things: risk, return, and liquidity. Because the bonds in Figure 6.1 "The risk structure of interest rates in the United States, 1919–2010" are all long-term bonds, their expected relative returns might appear at first glance to be identical. Investors know, however, that bonds issued by different economic entities have very different probabilities of defaulting. Specifically, they know the following:
- The U.S. government has never defaulted on its bonds and is extremely unlikely to do so because even if its much-vaunted political stability were to be shattered and its efficient tax administration (that wonderful institution, the Internal Revenue Service [IRS]) were to stumble, it could always meet its nominal obligations by creating money. (That might create inflation, as it has at times in the past. Nevertheless, except for a special type of bond called TIPS, the government and other bond issuers promise to pay a nominal value, not a real [inflation-adjusted] sum, so the government does not technically default when it pays its obligations by printing money.)
- Municipalities have defaulted on their bonds in the past and could do so again in the future because, although they have the power to tax, they do not have the power to create money at will. (Although in the past, most recently during the Great Depression, some issued money-like—let’s call them extralegal—bills of credit, or chits.) Nevertheless, the risk of default on municipal bonds (aka munis) is often quite low, especially for revenue bonds, upon which specific taxes and fees are pledged for interest payments.
- Interest earned on munis is exempt from most forms of income taxation, while interest earned on Treasuries and corporate bonds is fully taxable.
- Corporations are more likely to default on their bonds than governments are because they must rely on business conditions and management acumen. They have no power to tax and only a limited ability to create the less-liquid forms of money, a power that decreases in proportion to their need! (I’m thinking of gift cards, declining balance debit cards, trade credit, and so forth.) Some corporations are more likely to default on their bonds than others. Several credit-rating agencies, including Moody’s and Standard and Poor’s, assess the probability of default and assign grades to each bond. There is quite a bit of grade inflation built in (the highest grade being not A or even A+ but Aaa), the agencies are rife with conflicts of interest, and the market usually senses problems before the agencies do. Nevertheless, bond ratings are a standard proxy for default risk because, as Figure 6.3 "Default rates on bonds rated by Moody’s from 1983 to 1999" shows, lower-rated bonds are indeed more likely to default than higher-rated ones. Like Treasuries, corporate bonds are fully taxable.
- The most liquid bond markets are usually those for Treasuries. The liquidity of corporate and municipal bonds is usually a function of the size of the issuer and the amount of bonds outstanding. So the bonds of the state of New Jersey might be more liquid than those of a small corporation, but less liquid than the bonds of, say, General Electric.
Figure 6.3 Default rates on bonds rated by Moody’s from 1983 to 1999
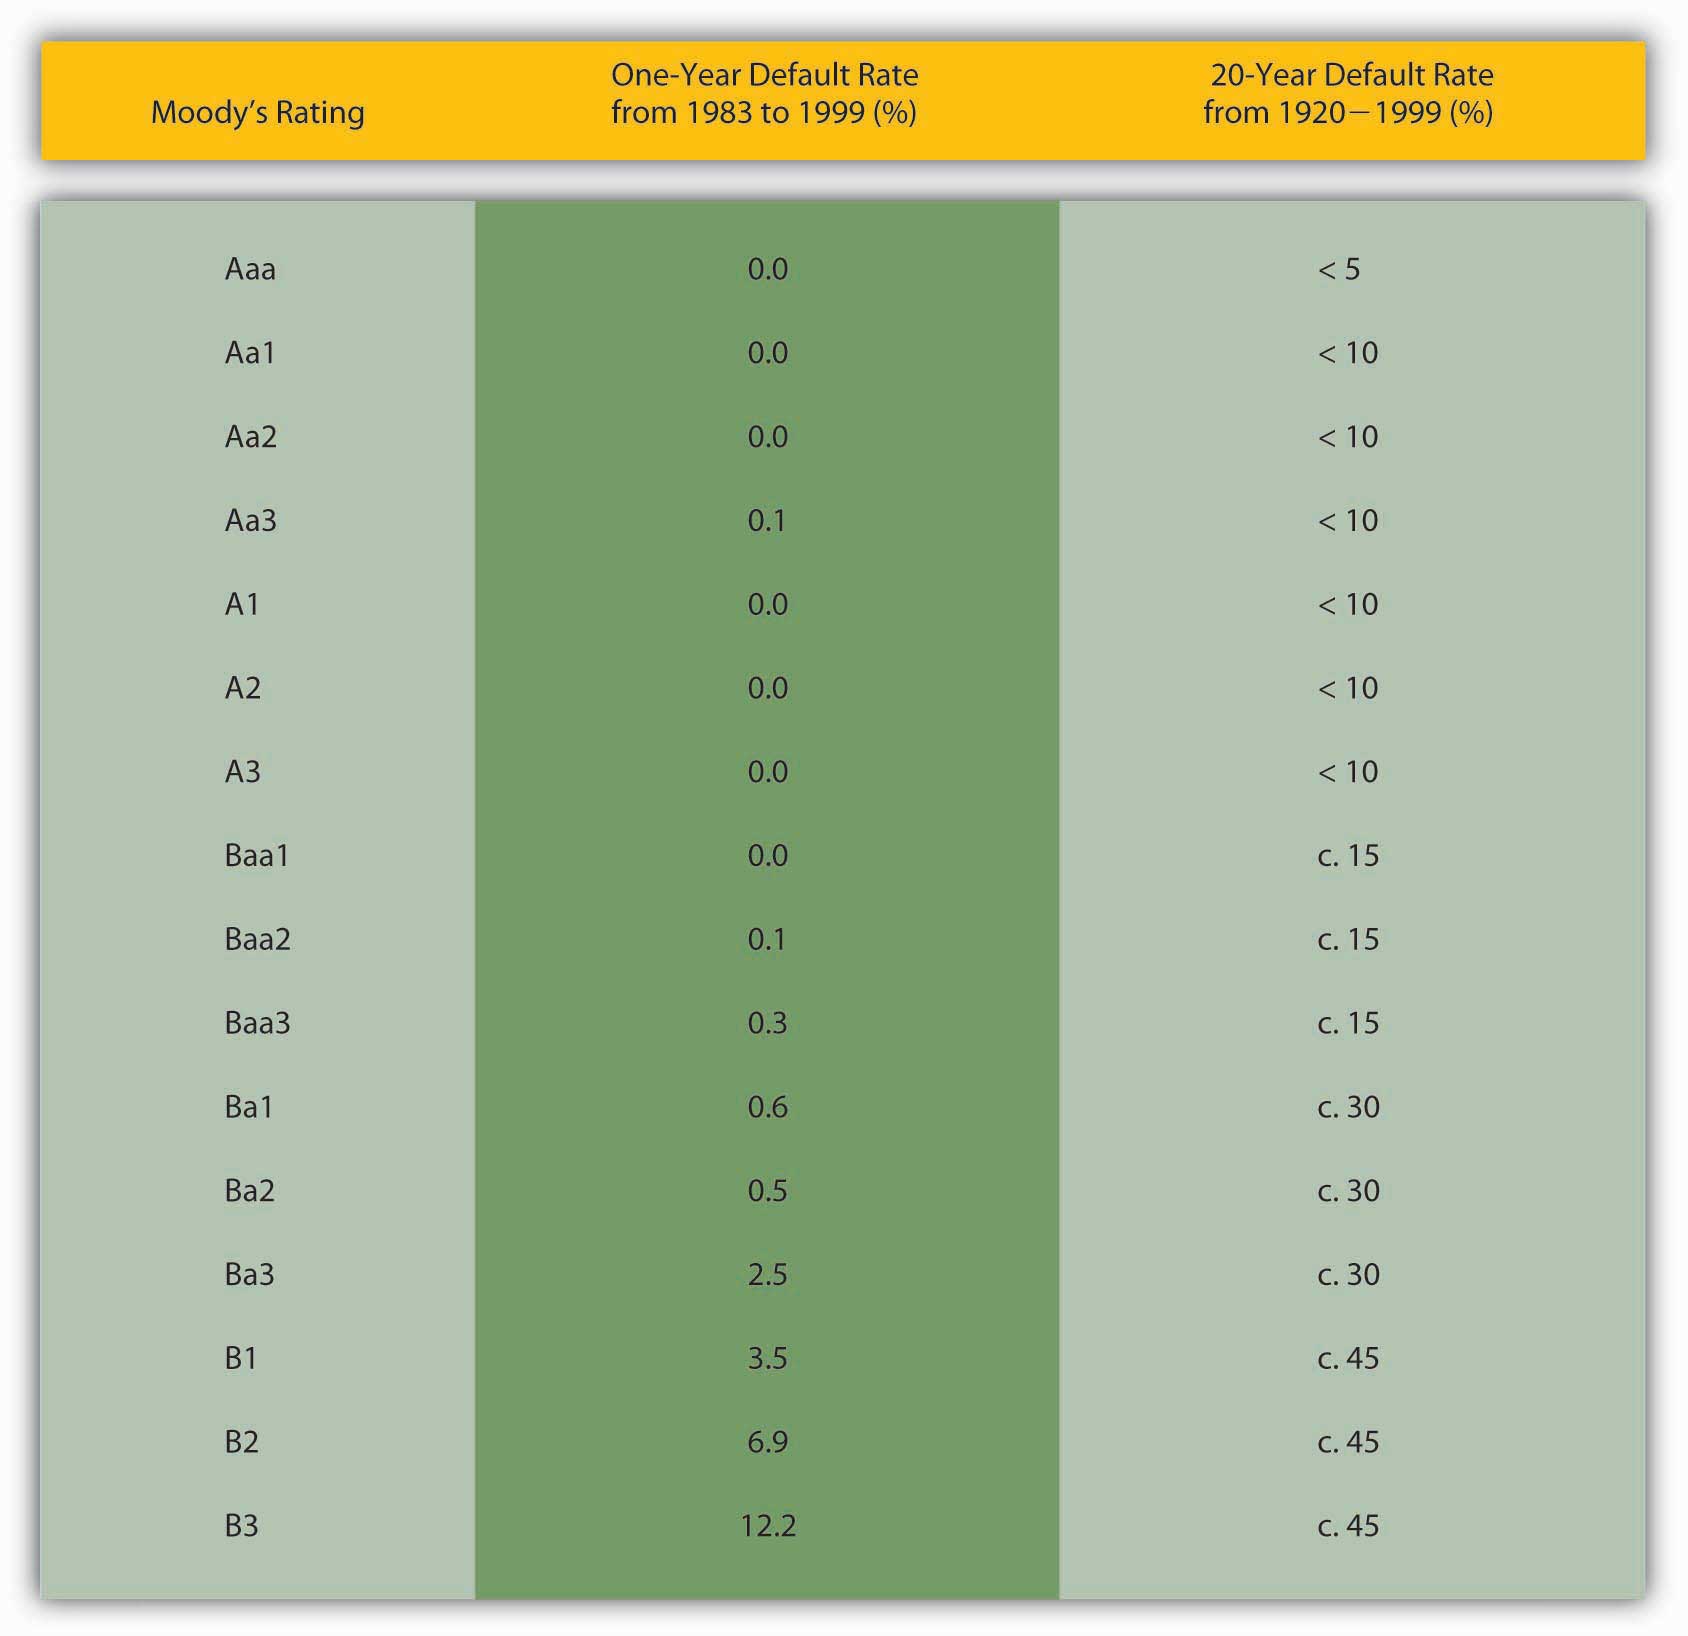
Equipped with this knowledge, we can easily understand the reasons for the rank ordering in Figure 6.1 "The risk structure of interest rates in the United States, 1919–2010".Figure 6.3 "Default rates on bonds rated by Moody’s from 1983 to 1999", by the way, should not be taken as evidence that credit rating agencies provide investors with useful information. Before 1970 or so, they sold ratings to investors and generally did a good job of ranking risks in a competitive market for ratings. Thereafter, however, they formed a government-sanctioned oligopoly and began to charge issuers for ratings. The resulting conflict of interest degraded the quality of ratings to the point that the big three rating agencies failed to predict the crises of 1997–98 in Southeast Asia and 2008 in the United States and Europe. Today, few investors still take their ratings seriously, as evidenced by the fact that Treasury bond prices actually increased after U.S. government bonds were downgraded by credit rating agency Standard and Poor’s in August 2011. Corporate Baa bonds have the highest yields because they have the highest default risk (of those graphed), and the markets for their bonds are generally not very liquid. Corporate Aaa bonds are next because they are relatively safer (less default risk) than Baa bonds and they may be relatively liquid, too. U.S. Treasuries are extremely safe and the markets for them are extremely liquid, so their yields are lower than those of corporate bonds. In other words, investors do not need as high a yield to own Treasuries as they need to own corporates. Another way to put this is that investors place a positive risk premium (to be more precise, a credit or default risk, liquidity, and tax premium) on corporate bonds.
Stop and Think Box
Corporate bond ratings go all the way down to C (Moody’s) or D (Standard and Poor’s). (These used to be called high-yield or junk bonds but are now generally referred to as B.I.G. or below investment grade bonds.) If plotted on Figure 6.1 "The risk structure of interest rates in the United States, 1919–2010", where would the yields of such bonds land? How do you know?
They would have higher yields and hence would be above the Baa line because they would have a higher default risk, the same tax treatment, and perhaps less liquidity.
The low yield on munis is best explained by their tax exemptions. Before income taxes became important, the yield on munis was higher than that of Treasuries, as we would expect given that Treasuries are more liquid and less likely to default. During World War II, investors, especially wealthy individuals, eager for tax-exempt income and convinced that the fiscal problems faced by many municipalities during the depression were over, purchased large quantities of municipal bonds, driving their prices up (and their yields down). Almost all the time since, tax considerations, which are considerable given our highest income brackets exceed 30 percent, have overcome the relatively high default risk and illiquidity of municipal bonds, rendering them more valuable than Treasuries, ceteris paribus.
Figure 6.4 Risk premiums and bond spreads during the Great Depression, 1929–1939
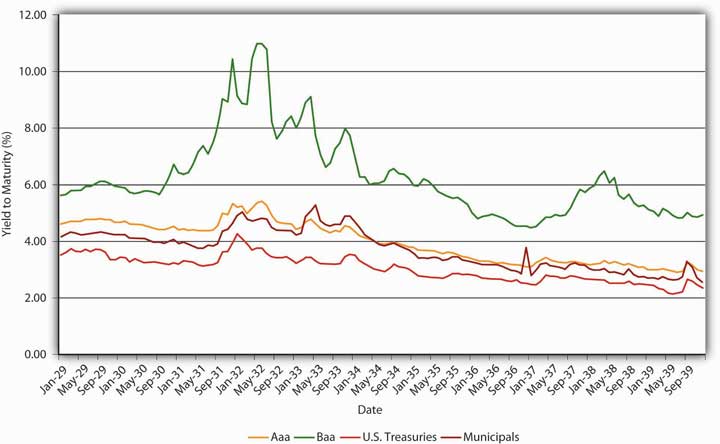
Risk, after-tax returns, and liquidity also help to explain changes in spreads, the difference between yields of bonds of different types (the distance between the lines in Figure 6.1 "The risk structure of interest rates in the United States, 1919–2010" and Figure 6.4 "Risk premiums and bond spreads during the Great Depression, 1929–1939"). The big spike in Baa bond yields in the early 1930s, the darkest days of the Great Depression, was due to one simple cause: companies with Baa bond ratings were going belly-up left and right, leaving bondholders hanging. As Figure 6.4 "Risk premiums and bond spreads during the Great Depression, 1929–1939" shows, companies that issued Aaa bonds, municipalities, and possibly even the federal government were also more likely to default in that desperate period, but they were not nearly as likely to as weaker companies. Yields on their bonds therefore increased, but only a little, so the spread between Baa corporates and other bonds increased considerably in those troubled years. In better times, the spreads narrowed, only to widen again during the so-called Roosevelt Recession of 1937–1938.
Figure 6.5 The flight to quality (Treasuries) and from risk (corporate securities)
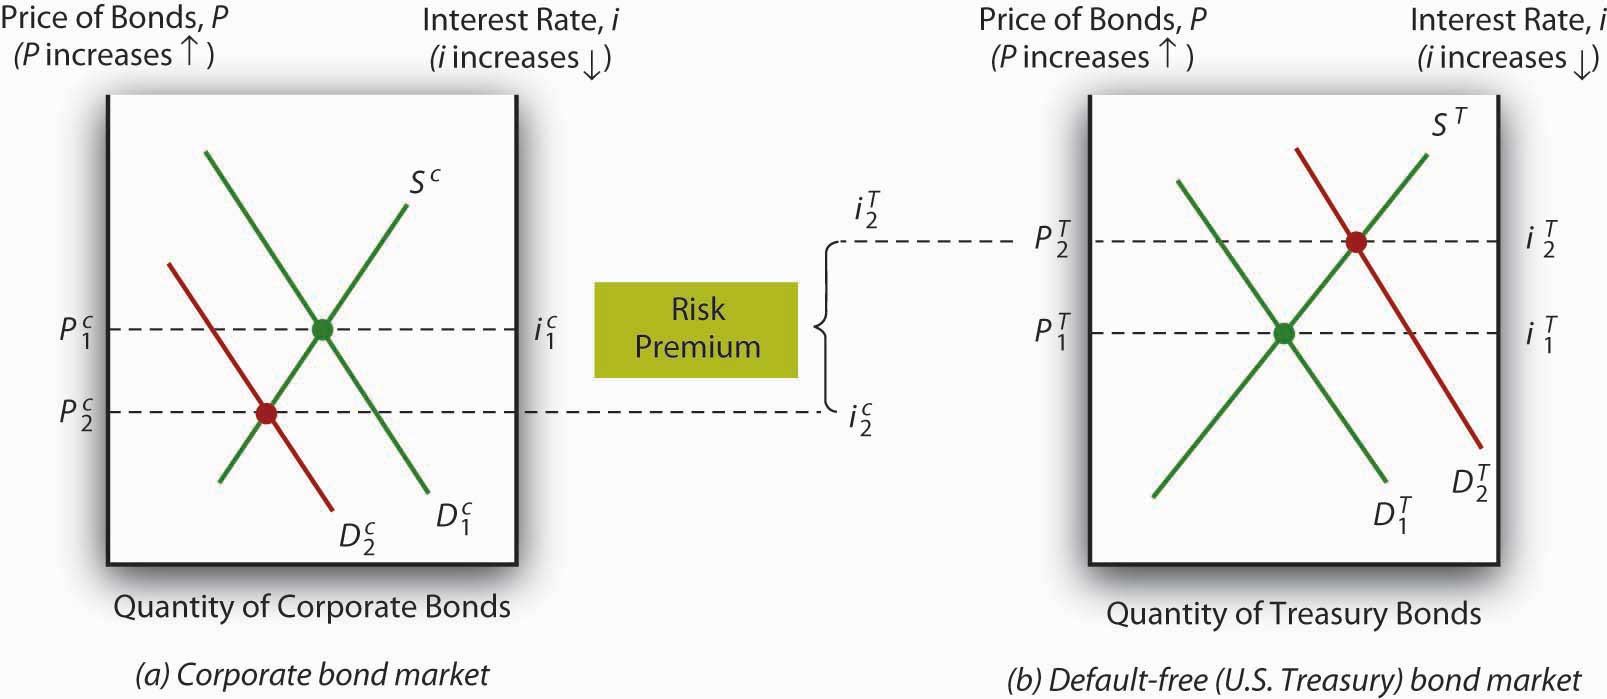
During crises, spreads can quickly soar because investors sell riskier assets, like Baa bonds, driving their prices down, and simultaneously buy safe ones, like Treasuries, driving their prices up. This so-called flight to quality is represented in Figure 6.5 "The flight to quality (Treasuries) and from risk (corporate securities)".
Stop and Think Box
In the confusion following the terrorist attacks on New York City and Washington, DC, in September 2001, some claimed that people who had prior knowledge of the attacks made huge profits in the financial markets. How would that have been possible?
The most obvious way, given the analyses provided in this chapter, would have been to sell riskier corporate bonds and buy U.S. Treasuries on the eve of the attack in expectation of a flight to quality, the mass exchange of risky assets (and subsequent price decline) for safe ones (and subsequent price increase).
Time for a check of your knowledge.
Exercises
- What would happen to the spreads between different types of bonds if the federal government made Treasuries tax-exempt and at the same time raised income taxes considerably?
- If the Supreme Court unexpectedly declared a major source of municipal government tax revenue illegal, what would happen to municipal bond yields?
- If several important bond brokers reduced the brokerage fee they charge for trading Baa corporate bonds (while keeping their fees for other bonds the same), what would happen to bond spreads?
- What happened to bond spreads when Enron, a major corporation, collapsed in December 2001?
Key Takeaways
- The risk structure of interest rates explains why bonds of the same maturity but issued by different economic entities have different yields (interest rates).
- The three major risks are default, liquidity, and after-tax return.
- By concentrating on the three major risks, you can ascertain why some bonds are more (less) valuable than others, holding their term (repayment date) constant.
- You can also post-dict, if not outright predict, the changes in rank order as well as the spread (or difference in yield) between different types of bonds.
- A flight to quality occurs during a crisis when investors sell risky assets (like below-investment-grade bonds) and buy safe ones (like Treasury bonds or gold).