This is “The Money Supply and the Money Multiplier”, chapter 15 from the book Finance, Banking, and Money (v. 1.1). For details on it (including licensing), click here.
For more information on the source of this book, or why it is available for free, please see the project's home page. You can browse or download additional books there. To download a .zip file containing this book to use offline, simply click here.
Chapter 15 The Money Supply and the Money Multiplier
Chapter Objectives
By the end of this chapter, students should be able to:
- Compare and contrast the simple money multiplier developed in Chapter 14 "The Money Supply Process" and the m1 and m2 multipliers developed in this chapter.
- Write the equation that helps us to understand how changes in the monetary base affect the money supply.
- Explain why the M2 multiplier is almost always larger than the m1 multiplier.
- Explain why the required reserve ratio, the excess reserve ratio, and the currency ratio are in the denominator of the m1 and m2 money multipliers.
- Explain why the currency, time deposit, and money market mutual fund ratios are in the numerator of the M2 money multiplier.
- Describe how central banks influence the money supply.
- Describe how banks, borrowers, and depositors influence the money supply.
15.1 A More Sophisticated Money Multiplier for M1
Learning Objectives
- How do the simple money multiplier and the more sophisticated one developed here contrast and compare?
- What equation helps us to understand how changes in the monetary base affect the money supply?
In Chapter 14 "The Money Supply Process", you learned that an increase (decrease) in the monetary base (MB, which = C + R) leads to an even greater increase (decrease) in the money supply (MS, such as M1M1 is a measure of the money supply that includes currency in circulation plus checkable deposits. or M2M2 is a measure of the money supply that includes M1 plus time deposits and noninstitutional (retail) money market funds.) due to the multiple deposit creation process. You also learned a simple but unrealistic upper-bound formula for estimating the change that assumed that banks hold no excess reserves and that the public holds no currency.
Stop and Think Box
You are a research associate for Moody’s subsidiary, High Frequency Economics, in West Chester, Pennsylvania. A client wants you to project changes in M1 given likely increases in the monetary base. Because of a glitch in the Federal Reserve’s computer systems, currency, deposit, and excess reserve figures will not be available for at least one week. A private firm, however, can provide you with good estimates of changes in banking system reserves, and of course the required reserve ratio is well known. What equation can you use to help your client? What are the equation’s assumptions and limitations?
You cannot use the more complex M1 money multiplier this week because of the Fed’s computer glitch, so you should use the simple deposit multiplier from Chapter 14 "The Money Supply Process": ΔD = (1/rr) × ΔR. The equation provides an upper-bound estimate for changes in deposits. It assumes that the public will hold no more currency and that banks will hold no increased excess reserves.
To get a more realistic estimate, we’ll have to do a little more work. We start with the observation that we can consider the money supply to be a function of the monetary base times some money multiplier (m):
This is basically a less specific version of the formula you learned in Chapter 14 "The Money Supply Process", except that instead of calculating the change in deposits (ΔD) brought about by the change in reserves (ΔR), we will now calculate the change in the money supply (ΔMS) brought about by the change in the monetary base (ΔMB). Furthermore, instead of using the reciprocal of the required reserve ratio (1/rr) as the multiplier, we will use a more sophisticated one (m1, and later M2) that doesn’t assume away cash and excess reserves.
We can add currency and excess reserves to the equation by algebraically describing their relationship to checkable depositsDeposits that can easily, cheaply, and quickly be drawn upon by check in order to make payments. Also known as transaction deposits.in the form of a ratio:
C/D = currency ratio
ER/D = excess reserves ratio
Recall that required reserves are equal to checkable deposits (D) times the required reserve ratio (rr). Total reserves equal required reserves plus excess reserves:
So we can render MB = C + R as MB = C + rrD + ER. Note that we have successfully removed C and ER from the multiple deposit expansion process by separating them from rrD. After further algebraic manipulations of the above equation and the reciprocal of the reserve ratio (1/rr) concept embedded in the simple deposit multiplier, we’re left with a more sophisticated, more realistic money multiplier:
So if
Required reserve ratio (rr) = .2
Currency in circulation = $100 billion
Deposits = $400 billion
Excess reserves = $10 billion
Practice calculating the money multiplier in Exercise 1.
Exercises
-
Given the following, calculate the M1 money multiplier using the formula m1 = 1 + (C/D)/[rr + (ER/D) + (C/D)].
Currency Deposits Excess Reserves Required Reserve Ratio Answer: m1 100 100 10 .1 1.67 100 100 10 .2 1.54 100 1,000 10 .2 3.55 1,000 100 10 .2 1.07 1,000 100 50 .2 1.02 100 1,000 50 .2 3.14 100 1,000 0 1 1 Once you have m, plug it into the formula ΔMS = m × ΔMB. So if m1 = 2.6316 and the monetary base increases by $100,000, the money supply will increase by $263,160. If m1 = 4.5 and MB decreases by $1 million, the money supply will decrease by $4.5 million, and so forth. Practice this in Exercise 2.
-
Calculate the change in the money supply given the following:
Change in MB m1 Answer: Change in MS 100 2 200 100 4 400 −100 2 −200 −100 4 −400 1,000 2 2,000 −1,000 2 −2,000 10,000 1 10,000 −10,000 1 −10,000
Stop and Think Box
Explain Figure 15.1 "U.S. MB and M1, 1959–2010", Figure 15.2 "U.S. m", and Figure 15.3 "U.S. currency and checkable deposits, 1959–2010".
Figure 15.1 U.S. MB and M1, 1959–2010
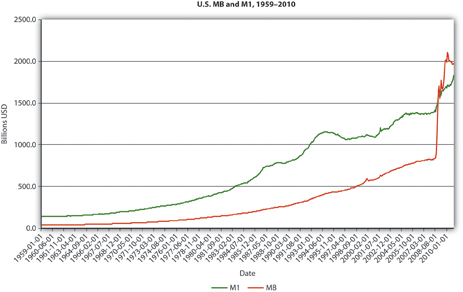
Figure 15.2 U.S. m1, 1959–2010.
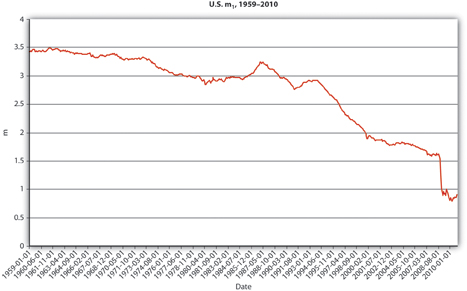
Figure 15.3 U.S. currency and checkable deposits, 1959–2010
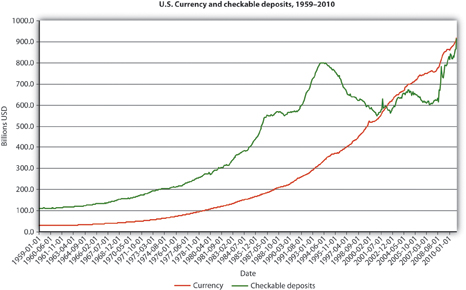
Figure 15.4 U.S. currency ratio, 1959–2010
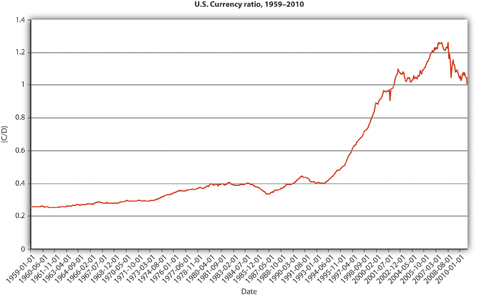
In Figure 15.1 "U.S. MB and M1, 1959–2010", M1 has increased because MB has increased, likely due to net open market purchases by the Fed. Apparently, m1 has changed rather markedly since the early 1990s. In Figure 15.2 "U.S. m", the M1 money multiplier m1 has indeed dropped considerably since about 1995. That could be caused by an increase in rr, C/D, or ER/D. Figure 15.3 "U.S. currency and checkable deposits, 1959–2010" shows that m decreased primarily because C/D increased. It also shows that the increase in C/D was due largely to the stagnation in D coupled with the continued growth of C. The stagnation in D is likely due to the advent of sweep accounts. Figure 15.4 "U.S. currency ratio, 1959–2010" isolates C/D for closer study.
Key Takeaways
- The money multipliers are the same because they equate changes in the money supply to changes in the monetary base times some multiplier.
- The money multipliers differ because the simple multiplier is merely the reciprocal of the required reserve ratio, while the other multipliers account for cash and excess reserve leakages.
- Therefore, m1 and m2 are always smaller than 1/rr (except in the rare case where C and ER both = 0).
- ΔMS = m × ΔMB, where ΔMS = change in the money supply; m = the money multiplier; ΔMB = change in the monetary base. A positive sign means an increase in the MS; a negative sign means a decrease.
15.2 The M2 Money Multiplier
Learning Objectives
- Why is the M2 multiplier almost always larger than the M1 multiplier?
- Why are the required reserve ratio, the excess reserve ratio, and the currency ratio in the denominator of the m1 and m2 money multipliers?
- Why are the currency, time deposit, and money market mutual fund ratios in the numerator of the m2 money multiplier?
Note that m1 is the M1 money multiplier. With a little bit more work, one can also calculate the M2 money multiplier (m2). Recall from Chapter 3 "Money" that M2 = C + D + T + MMF, where T = time and savings deposits and MMF = money market funds, money market deposit accounts, and overnight loans. We account for the extra types of deposits in the same way as we accounted for currency and excess reserves, by expressing them as ratios against checkable deposits:
(T/D) = time deposit ratio
(MMF/D) = money market ratio
which leads to the following equation:
Once you calculate M2, multiply it by the change in MB to calculate the change in the MS, specifically in M2, just as you did in Exercise 2. Notice that the denominator of the m2 equation is the same as the m1 equation but that we have added the time and money market ratios to the numerator. So M2 is alwaysM2 would equal m1 iff T = 0 and MMF = 0, which is highly unlikely. Note: iff means if and only if. > m1, ceteris paribus, which makes sense when you recall that M2 is composed of M1 plus other forms of money. To verify this, recall that we calculated m1 as 2.6316 when
Required reserves (rr) = .2
Currency in circulation = $100 million
Deposits = $400 million
Excess reserves = $10 million
We’ll now add time deposits of $900 million and money market funds of $800 million and calculate M2:
This is quite a bit higher than m1 because time deposits and money market funds are not subject to reserve requirements, so they can expand more than checkable deposits because there is less drag on them during the multiple expansion process.
Practice calculating the M2 money multiplier on your own in the exercise.
Exercise
-
Calculate the M2 money multiplier using the following formula: M2 = 1 + (C/D) + (T/D) + (MMF/D)/[rr + (ER/D) + (C/D)].
Currency Deposits Excess Reserves Required Reserve Ratio Time Deposits Money Market Funds Answer: M2 100 100 10 0.1 1,000 1,000 18.33 100 100 10 0.2 1,000 100 10 100 100 10 0.2 100 1,000 10 1,000 100 10 0.2 1,000 1,000 3.01 1,000 100 50 0.2 1,000 1,000 2.90 100 1,000 50 0.2 1,000 1,000 8.86 100 1,000 0 1 1,000 1,000 2.82 100 1 10 0.1 1,000 1,000 19.08
Key Takeaways
- Because M1 is part of M2, M2 is always > M1 (except in the rare case where time deposits and money market funds = 0, in which case M1 = M2).
- That fact is reflected in the inclusion of the time deposit and money market fund ratios in the numerator of the M2 multiplier equation.
- Moreover, no reserves are required for time and money market funds, so they will have more multiple expansion than checkable deposits will.
- The required reserve ratio, the excess reserve ratio, and the currency ratio appear in the denominator of the m1 and M2 money multipliers because all three slow the multiple deposit creation process. The higher the reserve ratios (required and excess), the smaller the sum available to make loans from a given deposit. The more cash, the smaller the deposit.
- The currency, time deposit, and money market mutual fund ratios are in the numerator of the M2 money multiplier because M2 is composed of currency, checkable deposits, time deposits, and money market mutual funds.
15.3 Summary and Explanation
Learning Objective
- How do central banks, banks, depositors, and borrowers influence the money supply?
By way of summary, Figure 15.5 "Major influences on m" explains why each of the major variables influences m1 and m2 in the ways implied by the equations presented above.
Figure 15.5 Major influences on m1 and m2
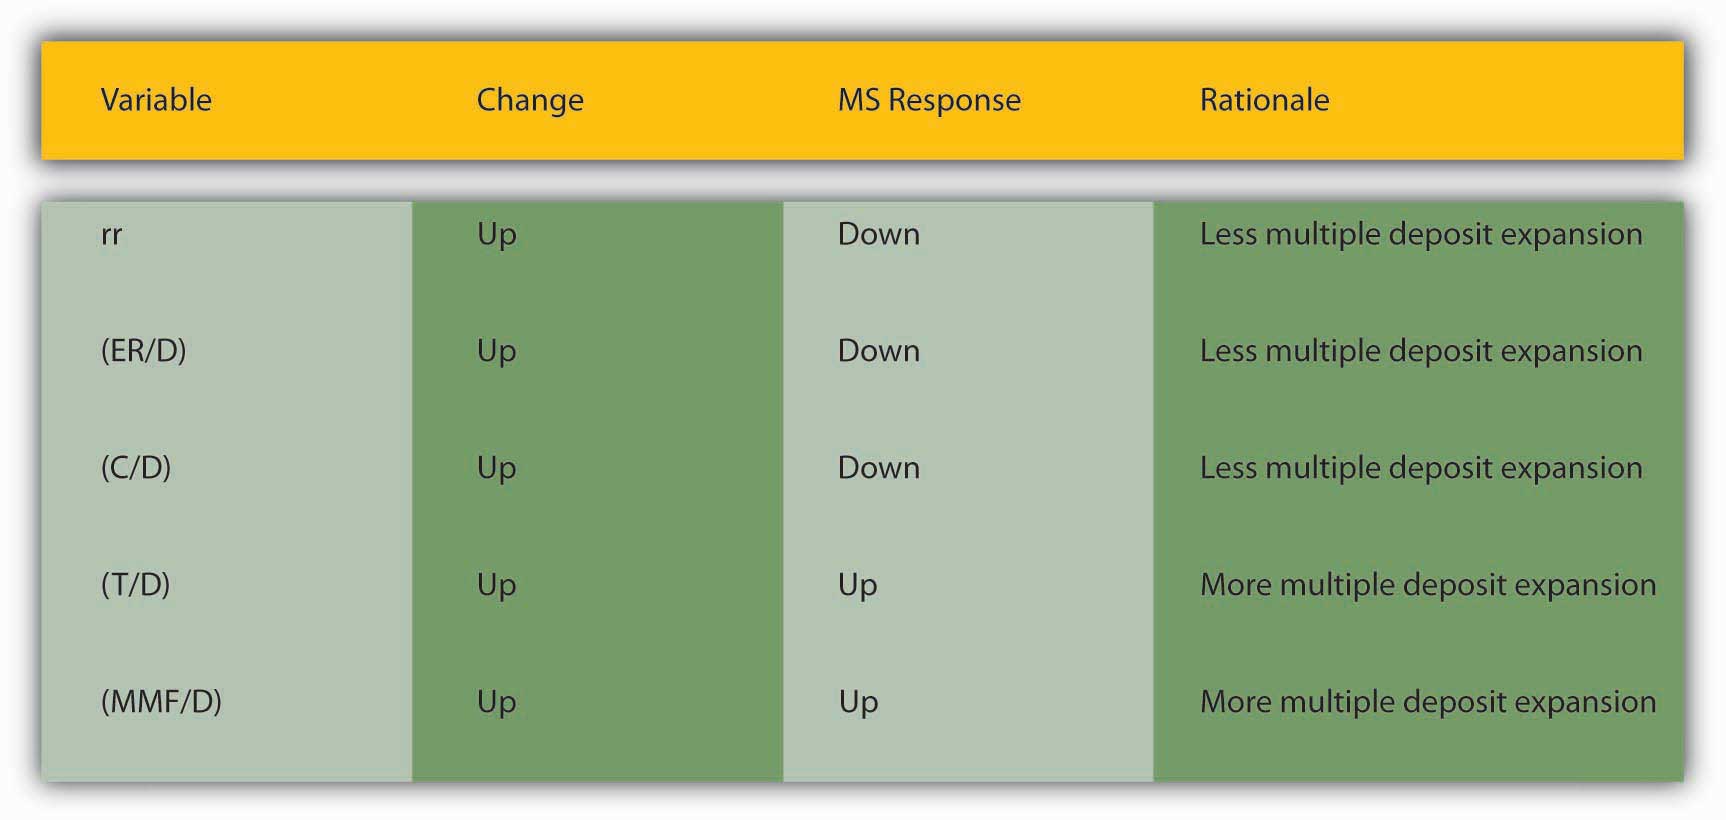
As we saw in Chapter 14 "The Money Supply Process", currency holdings, excess reserves, and required reserves slow down the multiple deposit creation process by removing funds from it. The bigger rr and ER/D are, the less each bank lends of the new deposits it receives. The bigger C/D is, the less money is deposited in the first place. For those reasons, we place those variables in the denominator. The larger the denominator, holding the numerator constant, the smaller m1 or M2 will be, of course. The appropriate money supply components compose the numerator-currency, and checkable deposits for m1, and currency, checkable deposits, time deposits, and money market mutual funds compose the numerator for M2.
This leaves us to consider why C/D, rr, and ER/D change over time. Short term, the currency ratio varies directly with the interest rate and the stability of the banking system. As the interest rate increases, the opportunity cost of keeping cash increases, so people are less anxious to hold it. People are also less anxious to hold currency if the banking system is stable because their money is safer in a checking deposit. If interest rates are extremely low or people believe the banks might be shaky, they naturally want to hold more physical cash. Longer term, C/D may be influenced by technology and loophole mining, encouraging bankers and depositors to eschew traditional checkable deposits in favor of sweep accounts.
The required reserve ratio is mandated by the central bank but, as noted in Chapter 10 "Innovation and Structure in Banking and Finance", loophole mining and technology have rendered it less important in recent years because sweep accounts allow banks to minimize the de jure level of their checkable deposits. In many places, rr is no longer a binding constraint on banks so, as we’ll see, most central banks no longer consider changing it as an effective monetary policy tool. (This in no way affects the money multiplier, which would provide the same figure for m1 or M2 whether we calculate them as above or replace rr and ER/D with R/D, where R = total reserves.)
Stop and Think Box
Prove the assertion made above: “This in no way affects the money multiplier, which would provide the same figure for m1 or M2 whether we calculate them as above or replace rr and ER/D with R/D, where R = total reserves.” Suppose that C = 100, R = 200, and D = 500 and that R is composed of required reserves of 100 and excess reserves of 100. That means that rr must equal .2(100/500).
Under the formula provided in the text,
Under the formula suggested above,
Excess reserves (or just reserves in a system without required reserves) are inversely related to the interest rate. In the early 1960s and early 2000s, when the interest rate was well less than 5 percent, ER/D was high, at .003 to .004. In the 1970s and 1980s, when interest rates were 10 percent and higher, ER/D dropped to .001 to .002. As we learned in Chapter 9 "Bank Management", expected deposit outflows directly affect excess reserve levels as banks stock up on reserves to meet the outflows. When uncertainty is high or a banking crisis is in progress or appears imminent, bankers will increase ER to protect their banks.
In summary, the central bank influences the money supply by controlling the monetary base and, to a far lesser extent, the required reserve ratio. Depositors, banks, and borrowers influence the money supply by influencing m1 and M2, specifically by determining the money multiplier, with depositors largely in control of C/D; depositors and banks interacting via deposit outflow expectations to determine E/R; and borrowers, depositors, banks, and the central bank interacting to determine interest rates and hence to some extent both C/D and E/R.
Key Takeaways
- Central banks control MB and rr, and affect interest rates, which in turn affect C/D and ER/D.
- Depositors determine C/D by deciding how much cash versus deposits to hold. They also influence interest rates.
- Banks influence interest rates and determine ER/D by deciding how many excess reserves to hold in the face of expected deposit outflows and interest rates.
- Borrowers influence the interest rate and hence to some extent C/D and ER/D.
15.4 Suggested Reading
Macesich, George. The Money Supply Process: A Comparative Analysis. New York: Praeger, 1999.


