This is “The Financial Crisis of 2007–2009”, chapter 12 from the book Finance, Banking, and Money (v. 1.1). For details on it (including licensing), click here.
For more information on the source of this book, or why it is available for free, please see the project's home page. You can browse or download additional books there. To download a .zip file containing this book to use offline, simply click here.


Chapter 12 The Financial Crisis of 2007–2009
Chapter Objectives
By the end of this chapter, students should be able to:
- Define financial crisis and differentiate between systemic and nonsystemic crises.
- Describe a generic asset bubble.
- Define leverage and explain its role in asset bubble formation.
- Explain why bubbles burst, causing financial panics.
- Define and explain the importance of lender of last resort.
- Define and explain the importance of bailouts.
- Narrate the causes and consequences of the financial crisis that began in 2007.
12.1 Financial Crises
Learning Objective
- What is a financial crisis?
A financial crisisThe functioning of one or more financial markets or intermediaries becomes erratic or ceases altogether.occurs when one or more financial markets or intermediaries cease functioning or function only erratically and inefficiently. A nonsystemic crisisA particular market or intermediary functions erratically or inefficiently. involves only one or a few markets or sectors, like the Savings and Loan Crisis described in Chapter 11 "The Economics of Financial Regulation". A systemic crisisThe functioning of all, or nearly all, of the financial system degrades. involves all, or almost all, of the financial system to some extent, as during the Great Depression.
Financial crises are neither new nor unusual. Thousands of crises, including the infamous Tulip Mania and South Sea Company episodes, have rocked financial systems throughout the world in the past five hundred years. Two such crises, in 1764–1768 and 1773, helped lead to the American Revolution.Tim Arango, “The Housing-Bubble and the American Revolution,” New York Times (29 November 2008), WK5. http://www.nytimes.com/2008/11/30/weekinreview/30arango.html?_r=2&pagewanted=1&ref=weekinreview After its independence, the United States suffered systemic crises in 1792, 1818–1819, 1837–1839, 1857, 1873, 1884, 1893–1895, 1907, 1929–1933, and 2008. Nonsystemic crises have been even more numerous and include the credit crunch of 1966, stock market crashes in 1973–1974 (when the Dow dropped from a 1,039 close on January 12, 1973, to a 788 close on December 5, 1973, to a 578 close on December 6, 1974) and 1987, the failure of Long-Term Capital Management in 1998, the dot-com troubles of 2000, the dramatic events following the terrorist attacks in 2001, and the subprime mortgage debacle of 2007. Sometimes, nonsystemic crises burn out or are brought under control before they spread to other parts of the financial system. Other times, as in 1929 and 2007, nonsystemic crises spread like a wildfire until they threaten to burn the entire system.
Stop and Think Box
“While we ridicule ancient superstition we have an implicit faith in the bubbles of banking, and yet it is difficult to discover a greater absurdity, in ascribing omnipotence to bulls, cats and onions, than for a man to carry about a thousand acres of land . . . in his pocket book. . . . This gross bubble is practiced every day, even upon the infidelity of avarice itself. . . . So we see wise and honest Americans, of the nineteenth century, embracing phantoms for realities, and running mad in schemes of refinement, tastes, pleasures, wealth and power, by the soul [sic] aid of this hocus pocus.”—Cause of, and Cure for, Hard Times.http://books.google.com/books When were these words penned? How do you know?
This was undoubtedly penned during one of the nineteenth century U.S. financial crises mentioned above. Note the negative tone, the allusion to Americans, and the reference to the nineteenth century. In fact, the pamphlet appeared in 1818. For a kick, compare/contrast it to blogs bemoaning the crisis that began in 2007:
http://cartledged.blogspot.com/2007/09/greedy-bastards-club.html
http://www.washingtonmonthly.com/archives/individual/2008_03/013339.php
http://thedefenestrators.blogspot.com/2008/10/death-to-bankers.html
Both systemic and nonsystemic crises damage the real economy by preventing the normal flow of credit from savers to entrepreneurs and other businesses and by making it more difficult or expensive to spread risks. Given the damage financial crises can cause, scholars and policymakers are keenly interested in their causes and consequences. You should be, too.
Key Takeaways
- Throughout history, systemic (widespread) and nonsystemic (confined to a few industries) financial crises have damaged the real economy by disrupting the normal flow of credit and insurance.
- Understanding the causes and consequences of financial crises is therefore important.
12.2 Asset Bubbles
Learning Objective
- What are asset bubbles and what role does leverage play in their creation?
Asset bubblesIn this context, a rapid increase in asset prices that is not easily justified by fundamentals like expected earnings, interest rates, and the like.are rapid increases in the value of some asset, like bonds, commodities (cotton, gold, oil, tulips), equities, or real estate. Some combination of low interest rates, new technology, unprecedented increases in demand for the asset, and leverage typically create bubbles.
Low interest rates can cause bubbles by lowering the total cost of asset ownership. Recall from Chapter 4 "Interest Rates" that interest rates and bond prices are inversely related. Algebraically, the i term is in the denominator of the PV formula—PV = FV/(1 + i)n—so as it gets smaller, PV must get larger (holding FV constant, of course).
Stop and Think Box
In colonial New York in the 1740s and 1750s, interest rates on mortgages were generally 8 percent. In the late 1750s and early 1760s, they fell to about 4 percent, and expected revenues from land ownership increased by about 50 percent. What happened to real estate prices? Why?
They rose significantly because it was cheaper to borrow money, thus lowering the total cost of real estate ownership, and because the land was expected to create higher revenues. Thinking of the land as a perpetuity and FV as the expected revenues arising from it:
And that is just the real estate effect. Increasing FV by £50 leads to the following:
In 1762, Benjamin Franklin reported that the “Rent of old Houses, and Value of Lands, . . . are trebled in the last Six Years.”For more on the crisis, see Tim Arango, “The Housing-Bubble Revolution,” New York Times (30 November 2008), WK 5. http://www.nytimes.com/2008/11/30/weekinreview/30arango.html?_r=2&pagewanted=1&ref=weekinreview
The effect of new technology can be thought of as increasing FV, leading, of course, to a higher PV. Or, in the case of equities, low interest rates decrease k (required return) and new inventions increase g (constant growth rate) in the Gordon growth model—P = E × (1 + g)/(k – g)—both of which lead to a higher price.
Large increases in the demand for an asset occur for a variety of reasons. Demand can be increased merely by investors’ expectations of higher prices in the future, as in the one period valuation model—P = E/(1 + k) + P1/(1 + k). If many investors believe that P1 must be greater than P a year (or any other period) hence, demand for the asset will increase and the expectation of a higher P1 will be vindicated. That sometimes leads investors to believe that P2 will be higher than P1, leading to a self-fulfilling cycle that repeats through P3 to Px. At some point, the value of the asset becomes detached from fundamental reality, driven solely by expectations of yet higher future prices. In fact, some scholars verify the existence of an asset bubble when news about the price of an asset affects the economy, rather than the economy affecting the price of the asset.
To increase their returns, investors often employ leverage, or borrowing. Compare three investors, one who buys asset X entirely with his own money, one who borrows half of the price of asset X, and one who borrows 90 percent of the price of asset X. Their returns (not including the cost of borrowing, which as noted above is usually low during bubbles) will be equal to those calculated in Figure 12.1 "The effects of leverage on returns in a rising market".
Figure 12.1 The effects of leverage on returns in a rising market
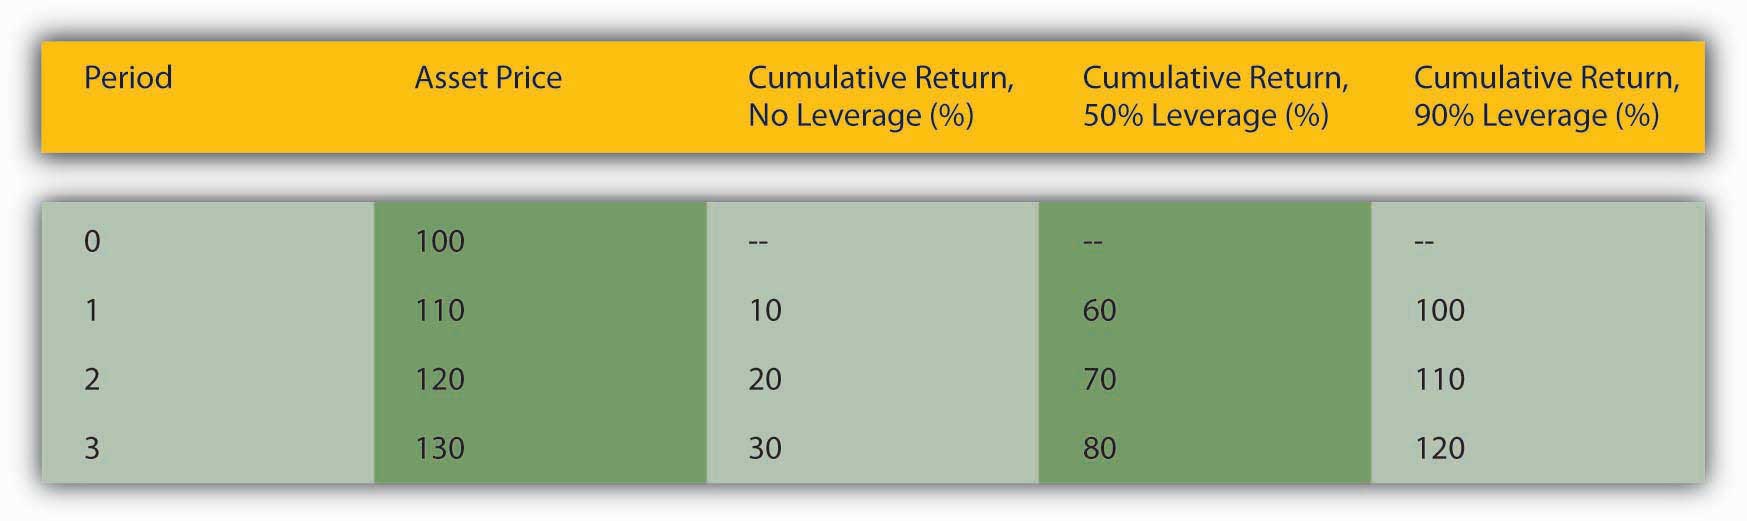
The figures were calculated using the rate of return formula: R = (C + Pt1 – Pt0)/Pt0 discussed in Chapter 4 "Interest Rates". Here, coupons are zero and hence drop out so that R = (Pt1 – Pt0)/Pt0.
In this example, returns for the unleveraged investor are great:
But the returns are not as high as the investor who borrowed half the cash, in essence paying only $50 of his own money for the $100 asset at the outset:
But even he looks like a chump compared to the investor who borrowed most of the money to finance the original purchase, putting up only $10 of his own money:
If you are thinking the most highly leveraged investor is the smart one, go back and reread the section of Chapter 2 "The Financial System"that discusses the trade-off between risk and return before continuing.
Key Takeaways
- Asset bubbles occur when the prices of some asset, like stocks or real estate, increase rapidly due to some combination of low interest rates, high leverage, new technology, and large, often self-fulfilling shifts in demand.
- The expectation of higher prices in the future, combined with high levels of borrowing, allow asset prices to detach from their underlying economic fundamentals.
12.3 Financial Panics
Learning Objective
- What are financial panics and what causes them?
A financial panicPanicked selling occurs during the rapid de-leveraging of the financial system following the bursting of an asset bubble.occurs when leveraged financial intermediaries and other investors must sell assets quickly in order to meet lenders’ callsA lender asks a borrower to repay, usually because interest rates have increased and/or the value of collateral has declined.. Lenders call loans, or ask for repayment, when interest rates increase and/or when the value of collateral pledged to repay the loan sinks below the amount the borrower owes. Calls are a normal part of everyday business, but during a panic, they all come en masse due to some shock, often the burstingWhen an asset bubble rapidly deflates, i.e., the price of the asset rapidly decreases. of an asset bubble. Bubbles, like people, are bound to die but nobody knows in advance when they will do so. A burst is sometimes triggered by an obvious shock, like a natural catastrophe or the failure of an important company, but sometimes something as seemingly innocuous as a large sell order can touch them off.
During a panic, almost everybody must sell and few can or want to buy, so prices plummet, triggering additional calls, and yet more selling. Invariably, some investors, usually the most highly leveraged ones, cannot sell assets quickly enough, or for a high enough price, to “meet the call” and repay their loans. Banks and other lenders begin to suffer defaults. Their lenders (other banks, depositors, holders of commercial paper), in turn, begin to wonder if they are still credit-worthy. Asymmetric information and uncertainty, as described in Chapter 11 "The Economics of Financial Regulation", reign supreme, inducing lenders to restrict credit. At some point, investors’ emotions take over, and they literally go into a panic, one that makes Tony Soprano’s panic attacks seem like a stroll in the park.http://www.menshealth.com/cda/article.do?site=MensHealth&channel= health&category=stress.management&conitem=04f999edbbbd201099edbbbd2010 cfe793cd____
Panics often cause the rapid de-leveragingLenders force borrowers to invest more of their own equity in assets.of the financial system, a period when interest rates for riskier types of loans and securities increase and/or when a credit crunchThe volume of loans decreases dramatically, usually in response to the bursting of an asset bubble during a financial crisis., or a large decrease in the volume of lending, takes place. Such conditions often usher in a negative bubbleA bubble characterized by prices that are far below their rational value., a period when high interest rates, tight credit, and expectations of lower asset prices in the future cause asset values to trend downward, sometimes well below the values indicated by underlying economic fundamentals. During de-leveraging, the forces that drove asset prices up now conspire to drag them lower.
Stop and Think Box
In New York in 1764, interest rates spiked from 6 to 12 percent and expected revenues from land plummeted by about 25 percent. What happened to real estate prices and why?
They dropped significantly because it was more expensive to borrow money, thus increasing the total cost of real estate ownership, and because the land was expected to yield lower revenues. Thinking of the land as a perpetuity and FV as the expected revenues arising from it:
And that is just the real estate effect. Decreasing FV by £25 leads to the following:
“I know of sundry Estates [farms and other landed property] that has been taken by Execution [foreclosed upon],” a New York merchant reported late in 1766, “and sold for not more than one third of their value owing to the scarcity of money.”
As shown in Figure 12.2 "The effects of leverage on returns in a falling market", the most highly leveraged investor suffers most of all.
Figure 12.2 The effects of leverage on returns in a falling market

Again, I used the rate of return formula, but coupons are zero so that R = (Pt1 – Pt0)/Pt0. As the price of the asset falls, the unleveraged investor suffers negative returns:
The leveraged investors lose the same percentage and must now pay a high interest rate for their loans, or put up the equity themselves, at a time when the opportunity cost of doing so is substantial:
The higher the leverage, the larger the sum that must be borrowed at high rates.
Also, the higher the leverage, the smaller the price change needs to be to trigger a call. At 50 percent leverage, a $100 asset could drop to $50 before the lender must call. At 90 percent leverage, a $100 asset need lose only $10 to induce a call.
Key Takeaways
- The bursting of an asset bubble, or the rapidly declining prices of an asset class, usually leads to a financial panic, reductions in the quantity of available credit, and the de-leveraging of the financial system.
- The most highly leveraged investors suffer most.
12.4 Lender of Last Resort
Learning Objective
- What is a lender of last resort and what does it do?
As noted above, financial panics and the de-leveraging that often occur after them can wreak havoc on the real economy by decreasing the volume of loans, insurance contracts, and other beneficial financial products. That, in turn, can cause firms to reduce output and employment. Lenders of last resort try to stop panics and de-leveraging by adding liquidity to the financial system and/or attempting to restore investor confidence. They add liquidity by increasing the money supply, reducing interest rates, and making loans to worthy borrowers who find themselves shut off from their normal sources of external finance. They try to restore investor confidence by making upbeat statements about the overall health of the economy and/or financial system and by implementing policies that investors are likely to find beneficial. During the darkest days of 1933, for example, the U.S. federal government restored confidence in the banking system through strong executive leadership and by creating the Federal Deposit Insurance Corporation.
Stop and Think Box
In a single day, October 19, 1987, the S&P fell by 20 percent. What caused such a rapid decline? Why did the panic not result in de-leveraging or recession?
According to a short history of the event by Mark Carlson (“A Brief History of the 1987 Stock Market Crash with a Discussion of the Federal Reserve Response”),http://www.federalreserve.gov/Pubs/feds/2007/200713/200713pap.pdf “During the years prior to the crash, equity markets had been posting strong gains. . . . There had been an influx of new investors. . . . Equities were also boosted by some favorable tax treatments given to the financing of corporate buyouts. . . . The macroeconomic outlook during the months leading up to the crash had become somewhat less certain. . . . Interest rates were rising globally. . . . A growing U.S. trade deficit and decline in the value of the dollar were leading to concerns about inflation and the need for higher interest rates in the U.S. as well.” On the day of the crash, investors learned that deficits were higher than expected and that the favorable tax rules might change. As prices dropped, “record margin calls” were made, fueling further selling. The panic did not proceed further because Federal Reserve Chairman Alan Greenspan restored confidence in the stock market by promising to make large loans to banks exposed to brokers hurt by the steep decline in stock prices. Specifically, the Fed made it known that “The Federal Reserve, consistent with its responsibilities as the Nation’s central bank, affirmed today its readiness to serve as a source of liquidity to support the economic and financial system.”
The most common form of lender of last resort today is the government central bank, like the European Central Bank (ECB) or the Federal Reserve. The International Monetary Fund (IMF) sometimes tries to act as a sort of international lender of last resort, but it has been largely unsuccessful in that role. In the past, wealthy individuals like J. P. Morgan and private entities like bank clearinghouses tried to act as lenders of last resort, with mixed success. Most individuals did not have enough wealth or influence to thwart a panic, and bank clearinghouses were at most regional in nature.
Key Takeaway
- A lender of last resort is an individual, a private institution, or, more commonly, a government central bank that attempts to stop a financial panic and/or postpanic de-leveraging by increasing the money supply, decreasing interest rates, making loans, and/or restoring investor confidence.
12.5 Bailouts
Learning Objective
- What is a bailout and how does it differ from the actions of a lender of last resort?
As noted above, lenders of last resort provide liquidity, loans, and confidence. They make loans to solvent institutions facing temporary solvency problems due to the crisis, not inevitable bankruptcy.Doug Arner, Financial Stability, Economic Growth, and the Role of Law (New York: Cambridge University Press, 2007), 139–140. BailoutsWhen taxpayer money is used to restore losses suffered by economic agents., by contrast, restore the losses suffered by one or more economic agents, usually with taxpayer money. The restoration can come in the form of outright grants or the purchase of equity but often takes the form of subsidized or government-guaranteed loans. Unsurprisingly, bailouts are often politically controversial because they can appear to be unfair and because they increase moral hazard, or risk-taking on the part of entities that expect to be bailed out if they encounter difficulties. Nevertheless, if the lender of last resort cannot stop the formation of a negative bubble or massive de-leveraging, bailouts can be an effective way of mitigating further declines in economic activity.
During the Great Depression, for example, the federal government used $500 million of taxpayer money to capitalize the Reconstruction Finance Corporation (RFC). In its initial phase, the RFC made some $2 billion in low-interest loans to troubled banks, railroads, and other businesses. Though at first deprecated as welfare for the rich, the RFC, most observers now concede, helped the economy to recover by keeping important companies afloat. Also during the depression, the Home Owners Loan Corporation (HOLC), seeded with $200 million of taxpayer dollars, bailed out homeowners, many of whom had negative equityThe market price of an asset is less than the sum borrowed to acquire it. Also known as being “in the bucket” or “under water.” in their homes, by refinancing mortgages on terms favorable to the borrowers. Similarly, in the aftermath of the Savings and Loan Crisis, the Resolution Trust Corporation (RTC) closed 747 thrifts with total assets of almost $400 billion. Both HOLC and RTC made the best of bad situations. HOLC made a small accounting profit, and the RTC cost taxpayers a mere $125 billion while staving off a more severe systemic crisis.
Stop and Think Box
The 1979 bailout of automaker Chrysler, which entailed a government guarantee of its debt, saved the troubled corporation from bankruptcy. It quickly paid off its debt, and the U.S. Treasury, and hence taxpayers, were actually the richer for it. Was this bailout successful?
At the time, many observers thought so. Chrysler creditors, who received 30 cents for every dollar the troubled automaker owed them, did not think so, however, arguing that they had been fleeced to protect Chrysler stockholders. Workers who lost their jobs or were forced to accept reductions in pay and benefits were also skeptical. Now that Chrysler and the other U.S. carmakers are again in serious financial trouble, some scholars are suggesting that the bailout was a disaster in the long term because it fooled Detroit execs into thinking they could continue business as usual. In retrospect, it may have been better to allow Chrysler to fail and a new, leaner, meaner company to emerge like a Phoenix from its ashes.
Key Takeaways
- Bailouts usually occur after the actions of a lender of last resort, such as a central bank, have proven inadequate to stop negative effects on the real economy.
- They usually entail restoring losses to one or more economic agents.
- Although politically controversial, bailouts can stop negative bubbles from leading to excessive de-leveraging, debt deflation, and economic depression.
12.6 The Crisis of 2007–2008
Learning Objective
- What factors led to the present financial crisis?
The most recent financial crisis began in 2007 as a nonsystemic crisis linked to subprime mortgagesLoans to risky borrowers collateralized with real estate, usually primary residences but sometimes vacation homes., or risky loans to homeowners. In 2008, the failure of several major financial services companies turned it into the most severe systemic crisis in the United States since the Great Depression.
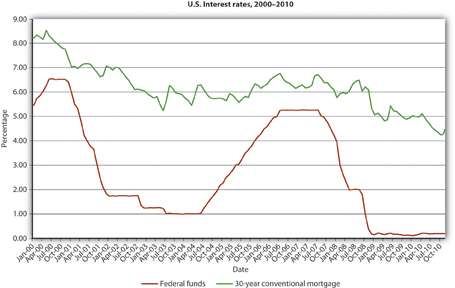
The troubles began with a major housing asset bubble. As shown in Figure 12.3 "Case-Shiller U.S. Home Price Composite Index, 2000–2010", between January 2000 and 2006, a major index of housing prices in the United States more than doubled. (Prices went up more in some areas than in others because real estate is a local asset.) Home prices rose rapidly for several reasons. As shown in Figure 12.4 "U.S. interest rates, 2000–2010", mortgage rates were quite low, to a large extent because the Federal Reserve kept the federal funds rate, the rate at which banks lend to each other overnight, very low.
Figure 12.3 Case-Shiller U.S. Home Price Composite Index, 2000–2010
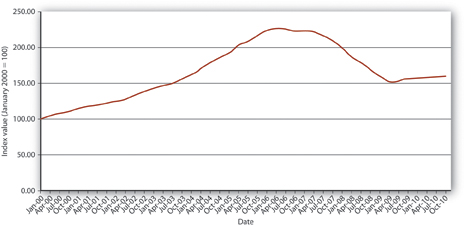
Figure 12.4 U.S. interest rates, 2000–2010
Mortgages also became much easier to obtain. Traditionally, mortgage lenders held mortgage loans on their own balance sheets. If a homeowner defaulted, the lender, usually a bank or life insurance company, suffered the loss. They were therefore understandably cautious about whom they lent to and on what terms. To shield themselves from loss, lenders insisted that borrowers contribute a substantial percentage of the home’s value as a down payment. The down payment ensured that the borrower had some equity at stake, some reason to work hard and not to default. It also provided lenders with a buffer if housing prices declined. Traditionally, lenders also verified that borrowers were employed or had other means of income from investments or other sources.
All that changed with the widespread advent of securitization, the practice of bundling and selling mortgages to institutional investors. Banks also began to “financial engineerA person who engages in financial engineering, the process of creating new, hopefully improved, financial products by redesigning or repackaging existing financial instruments.” those bundles, called mortgage-backed securitiesA bundle of home mortgages. (MBSs), into more complex derivative instruments like collateralized mortgage obligationsA type of derivative formed by financial engineering mortgage-backed securities into tranches with different risk-return characteristics. (CMOs). MBSs afforded investors the portfolio diversification benefits of holding a large number of mortgages; CMOs allowed investors to pick the risk-return profile they desired. They did so by slicing a group of MBSs into derivative securities (aka tranchesFrench for “slice.” Part of a structured finance instrument such as a collateralized mortgage obligation.) with credit ratings ranging from AAA, which would be the last to suffer losses, to BBB, which would suffer from the first defaults. The AAA tranches, of course, enjoyed a higher price (lower yield) than the lower-rated tranches. The holders of the lowest-rated tranches, those who took on the most risks, suffered most during the subprime maelstrom.
Securitization allowed mortgage lenders to specialize in making loans, turning them more into originators than lenders. Origination was much easier than lending because it required little or no capital. Unsurprisingly, a large number of new mortgage originators, most mere brokers, appeared on the scene. Paid a commission at closing, originators had little incentive to screen good borrowers from bad and much more incentive to sign up anyone with a pulse. A race to the bottom occurred as originators competed for business by reducing screening and other credit standards. At the height of the bubble, loans to no income, no job or assets (NINJA) borrowers were common. So-called liars’ loans for hundreds of thousands of dollars were made to borrowers without documenting their income or assets. Instead of insisting on a substantial down payment, many originators cajoled homeowners into borrowing 125 percent of the value of the home because it increased their commissions. They also aggressively pushed adjustable rate mortgages (ARMs) that offered low initial teaser rates and later were reset at much higher levels.
Regulators allowed, and even condoned, such practices in the name of affordable housing, even though six earlier U.S. mortgage securitization schemes had ended badly.Kenneth Snowden, “Mortgage Securitization in the United States: Twentieth Century Developments in Historical Perspective,” in Michael Bordo and Richard Sylla, eds., Anglo-American Financial Systems: Institutions and Markets in the Twentieth Century (Burr Ridge, IL: Irwin Professional Publishing, 1995), 261–298. Regulators also allowed Fannie Mae and Freddie Mac, two giant stockholder-owned mortgage securitization companies whose debt was effectively guaranteed by the federal government, to take on excessive risks and leverage themselves to the hilt. They also allowed credit-rating agencies to give investment-grade ratings to complicated mortgage-backed securities of dubious quality. (For the problem with credit-rating agencies, see Chapter 8 "Financial Structure, Transaction Costs, and Asymmetric Information".)
Observers, including Yale’s Robert Shillerhttp://www.econ.yale.edu/~shiller/ and Stern’s Nouriel Roubini,http://pages.stern.nyu.edu/~nroubini/ warned about the impending crisis, but few listened. As long as housing prices kept rising, shoddy underwriting, weak regulatory oversight, and overrated securities were not problems because borrowers who got into trouble could easily refinance or sell the house for a profit. Indeed, many people began to purchase houses with the intention of “flipping” them a month later for a quick buck.
In June 2006, however, housing prices peaked, and by the end of that year it was clear that the bubble had gone bye-bye. By summer 2007, prices were falling quickly. Defaults mounted as the sale/refinance option disappeared, and borrowers wondered why they should continue paying a $300,000 mortgage on a house worth only $250,000, especially at a time when a nasty increase in fuel costs and a minor bout of inflation strained personal budgets. Highly leveraged subprime mortgage lenders, like Countrywide and Indymac, suffered large enough losses to erode their narrow base of equity capital, necessitating their bankruptcy or sale to stronger entities. By early 2008, investment bank Bear Stearns, which was deeply involved in subprime securitization products, teetered on the edge of bankruptcy before being purchased by J. P. Morgan for a mere $10 per share.
As the crisis worsened, the Federal Reserve responded as a lender of last resort by cutting its federal funds target from about 5 to less than 2 percent between August 2007 and August 2008. It also made massive loans directly to distressed financial institutions. Mortgage rates decreased from a high of 6.7 percent in July 2007 to 5.76 percent in January 2008, but later rebounded to almost 6.5 percent in August 2008. Moreover, housing prices continued to slide, from an index score of 216 in July 2007 to just 178 a year later. Defaults on subprime mortgages continued to climb, endangering the solvency of other highly leveraged financial institutions, including Fannie Mae and Freddie Mac, which the government had to nationalize (take over and run). The government also arranged for the purchase of Merrill Lynch by Bank of America for $50 billion in stock. But it decided, probably due to criticism that its actions were creating moral hazard, to allow Lehman Brothers to go bankrupt. That policy quickly backfired, however, because Lehman dragged one of its major counterparties, AIG, down with it. Once bitten, twice shy, the government stepped in with a massive bailout for AIG to keep it from bankrupting yet other large institutions as it toppled.
Figure 12.5 Daily closing value of the Dow Jones Industrial Average, September–October 2008
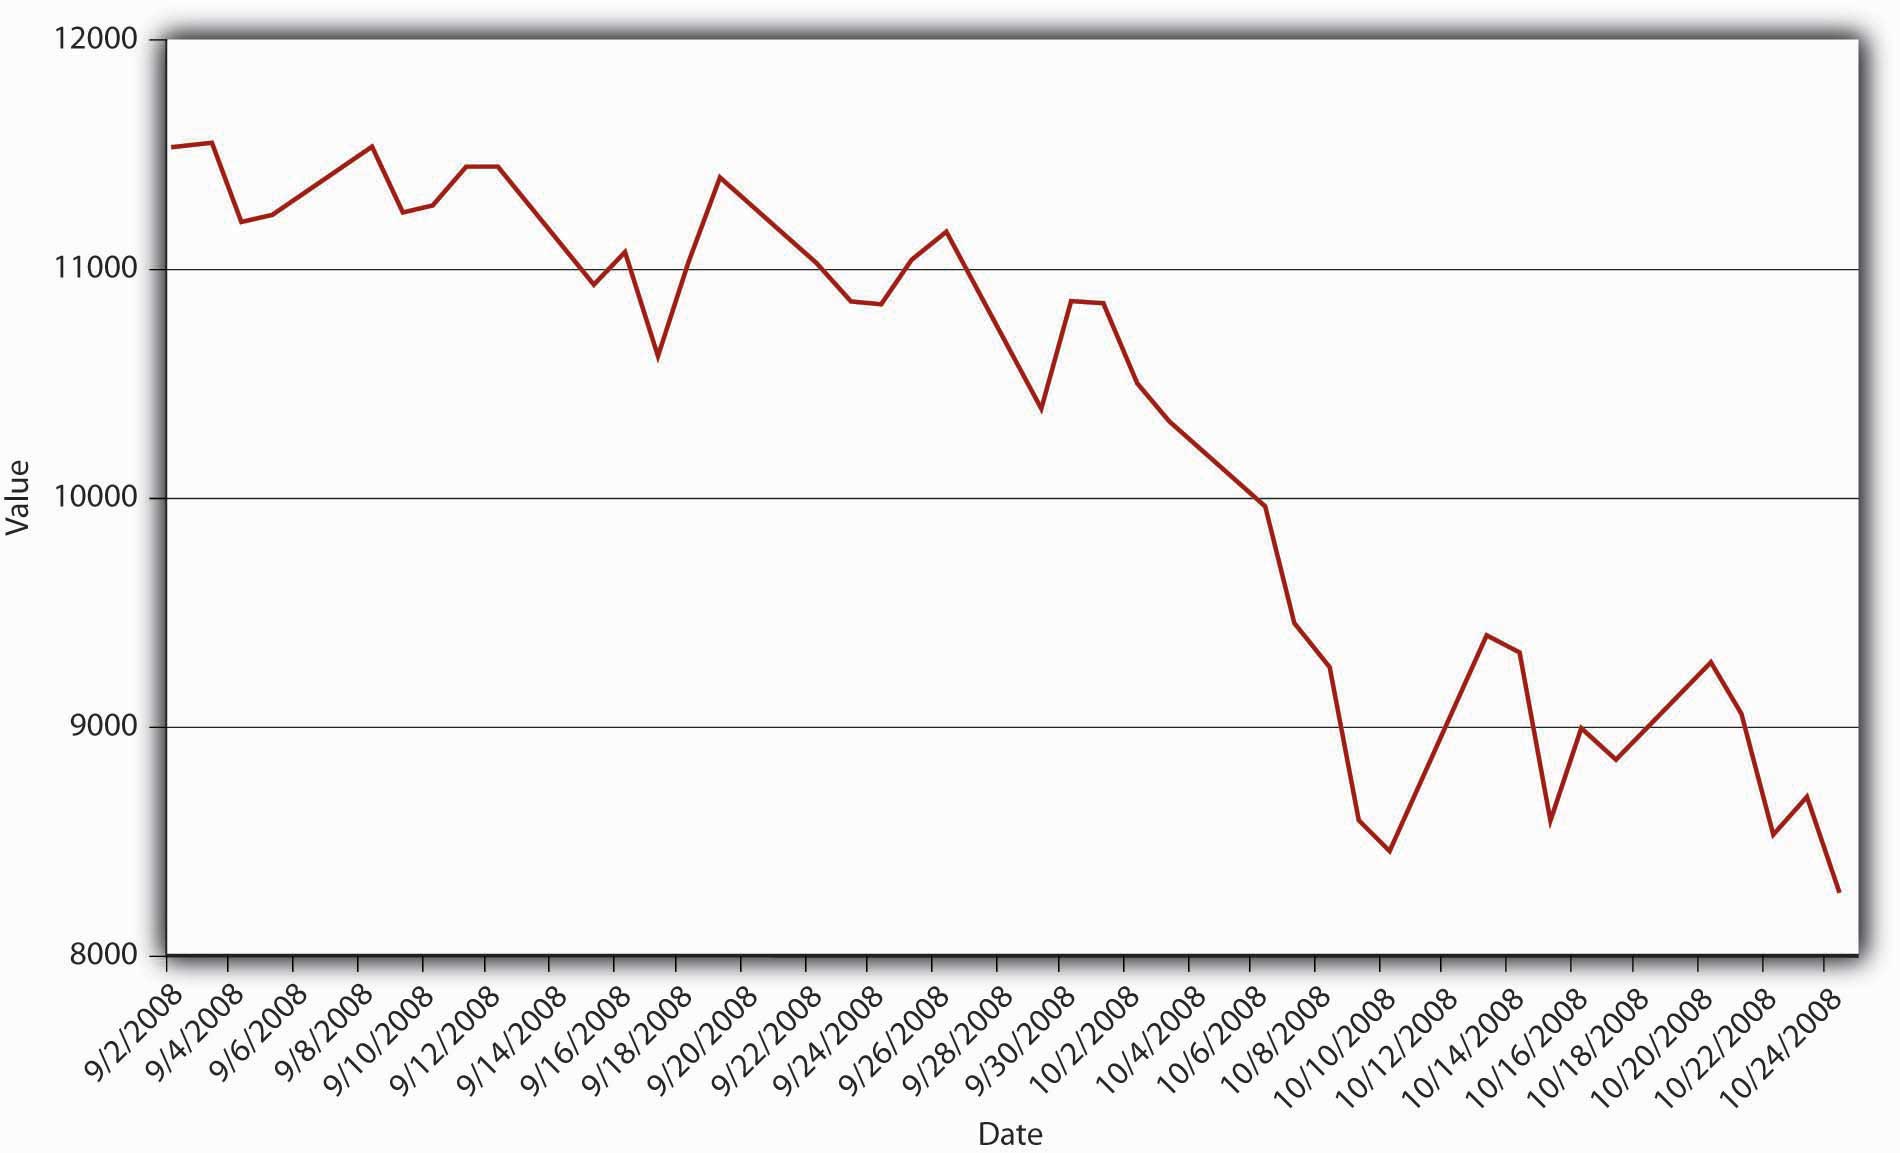
Figure 12.6 Bond yields, September–October 2008
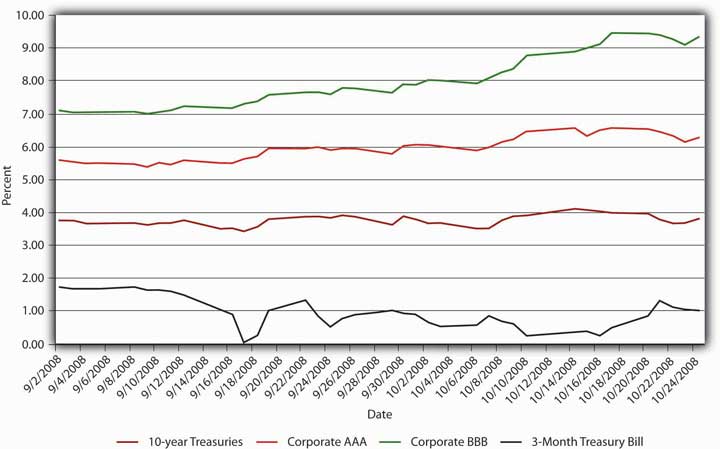
The damage, however, had been done and panic overtook both the credit and stock markets in September and October 2008. Figure 12.5 "Daily closing value of the Dow Jones Industrial Average, September–October 2008" and Figure 12.6 "Bond yields, September–October 2008" portray the carnage graphically.
Stop and Think Box
What is happening in Figure 12.6 "Bond yields, September–October 2008"?
Investors sold corporate bonds, especially the riskier Baa ones, forcing their prices down and yields up. In a classic flight to quality, they bought Treasuries, especially short-dated ones, the yields of which dropped from 1.69 percent on September 1 to .03 percent on the September 17.
With an economic recession and major elections looming, politicians worked feverishly to develop a bailout plan. The Bush administration’s plan, which offered some $700 billion to large financial institutions, initially met defeat in the House of Representatives. After various amendments, including the addition of a large sum of pork barrel sweeteners, the bill passed the Senate and the House. The plan empowered the Treasury to purchase distressed assets and to inject capital directly into banks. Combined with the $300 billion Hope for Homeowners plan, a bailout for some distressed subprime borrowers, and the direct bailout of AIG, the government’s bailout effort became the largest, in percentage of GDP terms, since the Great Depression. The Treasury later decided that buying so-called toxic assets, assets of uncertain and possibly no value, was not economically or politically prudent. Government ownership of banks, however, has a shaky history too because many have found the temptation to direct loans to political favorites, instead of the best borrowers, irresistible.“Leaving Las Vegas: No Dire Mistakes so Far, but Governments Will Find Exiting Banks Far Harder Than Entering Them,” The Economist (22 November 2008), 22.
Economists and policymakers are now busy trying to prevent a repeat performance, or at least mitigate the scale of the next bubble. One approach is to educate people about bubbles in the hope that they will be more cautious investors. Another is to encourage bank regulators to use their powers to keep leverage to a minimum. A third approach is to use monetary policy—higher interest rates or tighter money supply growth—to deflate bubbles before they grow large enough to endanger the entire financial system. Each approach has its strengths and weaknesses. Education might make investors afraid to take on any risk. Tighter regulation and monetary policy might squelch legitimate, wealth-creating industries and sectors. A combination of better education, more watchful regulators, and less accommodative monetary policy may serve us best.
Key Takeaways
- Low interest rates, indifferent regulators, unrealistic credit ratings for complex mortgage derivatives, and poor incentives for mortgage originators led to a housing bubble that burst in 2006.
- As housing prices fell, homeowners with dubious credit and negative equity began to default in unexpectedly high numbers.
- Highly leveraged financial institutions could not absorb the losses and had to shut down or be absorbed by stronger institutions.
- Despite the Fed’s efforts as lender of last resort, the nonsystemic crisis became systemic in September 2008 following the failure of Lehman Brothers and AIG.
- The government responded with huge bailouts of subprime mortgage holders and major financial institutions.
12.7 Suggested Reading
Ben-Shahard, Danny, Charles Ka Yui Leung, and Seow Eng Ong. Mortgage Markets Worldwide. Hoboken, NJ: John Wiley and Sons, 2007.
Kindleberger, Charles, and Robert Aliber. Manias, Panics, and Crashes: A History of Financial Crises, 5th ed. Hoboken, NJ: John Wiley and Sons, 2005.
Mishkin, Frederic. “How Should We Respond to Asset Price Bubbles?” in Banque de France, Financial Stability Review. October 2008, 65–74.
Reinhart, Carmen, and Kenneth Rogoff. This Time Is Different: Eight Centuries of Financial Folly. Princeton: Princeton University Press, 2009.
Roubini, Nouriel, and Brad Stetser. Bailouts or Bail-ins: Responding to Financial Crises in Emerging Markets. New York: Peterson Institute, 2004.
Shiller, Robert. Irrational Exuberance. New York: Doubleday, 2006.
The Subprime Solution: How Today’s Global Financial Crisis Happened, and What to Do About It. Princeton, NJ: Princeton University Press, 2008.
Sprague, Irvine. Bailout: An Insider’s Account of Bank Failures and Rescues. New York: Beard Books, 2000.
Wright, Robert E., ed. Bailouts: Public Money, Private Profit. New York: Columbia University Press, 2010.