This is “Risk Management Using the Capital Markets”, section 5.3 from the book Enterprise and Individual Risk Management (v. 1.0). For details on it (including licensing), click here.
For more information on the source of this book, or why it is available for free, please see the project's home page. You can browse or download additional books there. To download a .zip file containing this book to use offline, simply click here.


5.3 Risk Management Using the Capital Markets
Learning Objectives
- In this section you will learn how the ERM function can incorporate the capital markets’ instruments, such as derivatives.
- You also learn though a case how swaps can help mitigate the interest rate risk of a bank.
Enterprise risk management has emerged from the following steps of maturation:
- Risk management using insurance as discussed briefly in Chapter 4 "Evolving Risk Management: Fundamental Tools" and will be the topic of the rest of the book
- Explosive growth in technology and communications
- Development of quantitative techniques and models to measure risk (shown in Chapter 2 "Risk Measurement and Metrics")
- Evolution of the financial markets and financial technology into hedging of risks
These mechanisms combine to create a direct connection between the firm’s overall appetite for risk, as set in company objectives, and choosing appropriate corporate-level for solutions in mitigating risks.
Evolution of the Financial Markets
The last two or three decades have been a period of rapid financial innovation. Capital markets soared and with the growth came the development of derivatives. DerivativesFinancial securities whose value is derived from another underlying asset. can be defined as financial securities whose value is derived from another underlying asset. Our discussion will incorporate three basic tools used: forwards/futures, swaps, and options. Derivatives are noninsurance instruments used to hedge, or protect, against adverse movements in prices (in stocks or in commodities such as rice and wheat) or rates (such as interest rates or foreign exchange rates). For example, breakfast cereal manufacturer Frosty O’s must have wheat to produce its finished goods. As such, the firm is continually vulnerable to sudden increases in wheat prices. The company’s risk management objective would be to protect against wheat price fluctuations. Using derivatives, we will explore the different choices in how an enterprise risk manager might mitigate the unwanted price exposure.
Forward/Future Purchase
Forwards and futures are similar in that they are agreements that obligate the owner of the instrument to buy or sell an asset for a specified price at a specified time in the future. ForwardsFinancial securities traded in the over-the-counter market whose characteristics can be tailored to meet specific customer needs. are traded in the over-the-counter market, and contract characteristics can be tailored to meet specific customer needs. Farmers and grain elevator operators also use forwards to lock in a price for their corn or soybeans or wheat. They may choose to lock in the basisThe amount of money above and beyond the futures price., which is the amount of money above and beyond the futures price. Alternatively, if they like (believe that the prices are at their highest likely levels) the futures’ price levels, they can lock in the entire price. Food and beverage companies use forwards to lock in their costs for grains and fruits and vegetables. Quaker Oats, for example, locks in the prices on corn and oats using forward contracts with growers. Anheuser Busch depends upon forwards to lock in the price of hops, rice, and other grains used to make beer. Dole fruit companies use forwards to price out pineapples, raspberries, grapes, and other fruits.
FuturesFinancial securities that trade on an exchange and that have standardized contract specifications., on the other hand, trade on an exchange with standardized contract specifications. Forwards and futures prices derive from the spot, or cash market, which is “today’s” price for a particular asset. An example of a spot contract would be your agreement to purchase a meal at a restaurant. The spot market is the quoted price on today’s menu. A futures or forwards market would be the price you would have to pay if you wanted the same meal one year from today. Getting back to our cereal manufacturer, Frosty O’s can either go to the spot market on an ongoing basis or use the forwards/futures market to contract to buy wheat in the future at an agreed-upon price. Buying in the spot market creates exposure to later price fluctuation. Buying in the forwards/futures market allows the manufacturer to guarantee future delivery of the wheat at a locked-in price. Hence, this strategy is known as a “lock it in” defense. Southwest Airlines’ strategy to buy oil futures during the fuel crisis of 2007–2008 allowed them to be the only profitable airline. On the other side, Continental Airline is suffering from buying aviation fuel futures when the price of oil subsequently declined dramatically. Thus, the use of futures and forwards can create value or losses, depending upon the timing of its implementation.
Swaps
SwapsAgreements to exchange or transfer expected future variable-price purchases of a commodity or foreign exchange contract for a fixed contractual price today. are agreements to exchange or transfer expected future variable-price purchases of a commodity or foreign exchange contract for a fixed contractual price today. In effect, Frosty O’s buys wheat and swaps its expected “floating” price exposure for wheat at different times in the future for a fixed rate cost. For example, if Frosty O’s normally buys wheat on the first of each month, the company will have to pay whatever the spot price of wheat is on that day. Frosty O’s is exposed to market price fluctuations for each of the twelve months over a year’s time period. It can enter into a transaction to pay a fixed monthly rate over a year’s time period instead of whatever the floating spot rate may be each month. The net effect of the swap transaction is to receive the necessary wheat allotment each month while paying a fixed, predetermined rate. The swap rate quote would be fixed using the spot market and the one-year forward market for wheat. Thus Frosty O’s eliminates any adverse price exposure by switching the “floating” price exposure for an agreed-upon fixed price. Swaps are used in the same manner to exchange floating interest rate liabilities for fixed-interest rate liabilities. Hence, this strategy is known as a “switch out of it” defense. We will show an elaborate swaps example at the end of this section.
Options
Agreements that give the right (but not the obligation) to buy or sell an underlying asset at a specified price at a specified time in the future are known as optionsAgreements that give the right (but not the obligation) to buy or sell an underlying asset at a specified price at a specified time in the future.. Frosty O’s can purchase an option to buy the wheat it needs for production at a given strike price. The strike price (also called exercise price) is the specified price set in the option contract. In this fashion, Frosty O’s can place a ceiling on the price it will pay for the needed wheat for production in future time periods. Until the maturity date of the option passes, option holders can exercise their rights to buy wheat at the strike price. If the future spot price of wheat rises above the strike price, Frosty O’s will execute its option to purchase the wheat at the lower strike price. If the future price of wheat falls below the strike price, the company will not exercise its option and will instead purchase wheat directly in the spot market. This differentiates the option contract from the futures contract. An option is the right to buy or sell, whereas a futures/forward contract is an obligation to buy of sell. The option buyer pays the cost of the option to buy wheat at the strike price—also known as the option premium. A call option grants the right to buy at the strike price. A put option grants the right to sell at the strike price. A call option acts like insurance to provide an upper limit on the cost of a commodity. A put option acts like insurance to protect a floor selling price for wheat. Hence, option strategies are known as “cap” and “floor” defenses.James T. Gleason, The New Management Imperative in Finance Risk (Princeton, NJ: Bloomberg Press, 2000), Chapter 4 "Evolving Risk Management: Fundamental Tools".
Individuals and companies alike use derivative instruments to hedge against their exposure to unpredictable loss due to price fluctuations. The increasing availability of different derivative products has armed enterprise risk managers (ERM) with new risk management tool solutions. An importer of raw materials can hedge against changes in the exchange rate of the U.S. dollar relative to foreign currencies. An energy company can hedge using weather derivatives to protect against adverse or extreme weather conditions. And a bank can hedge its portfolio against interest rate risk. All of these risk exposures interrupt corporate cash flow and affect earnings, capital, and the bottom line, which is the value of the firm. These solutions, however, create new risk exposures. Over-the-counter market-traded derivatives, which feature no exchange acting as counterparty to the trade, expose a company to credit risk in that the counter party to the contract may not live up to its side of the obligation.
Risk Management Using Capital Markets
Dramatic changes have taken place in the insurance industry in the past two to three decades. A succession of catastrophic losses has caused insurers and reinsurers to reevaluate their risk analyses. The reassessment effort was made in full realization that these disasters, as horrible as they were, may not be the last worst-case scenarios. Past fears of multiple noncorrelated catastrophic events occurring in a relatively short period of time are on the top of agendas of catastrophe risk modelers and all constituencies responsible for national disaster management. The affordability of coverage, along with reinsurers’ credit quality concerns players who have lost large chunks of capital and surplus or equity to those disasters led to the first foray into using the capital markets as a reinsurance alternative.Michael Himick et al., Securitized Insurance Risk: Strategic Opportunities for Insurers and Investors (Chicago: Glenlake Publishing Co., Ltd., 1998), 49–59.
Securitization
Packaging and transferring the insurance risks to the capital markets through the issuance of a financial security is termed securitizationPackaging and transferring the insurance risks to the capital markets through the issuance of a financial security..David Na, “Risk Securitization 101, 2000, CAS Special Interest Seminar” (Bermuda: Deloitte & Touche), http://www.casact.org/coneduc/specsem/catastrophe/2000/handouts/na.ppt. The risks that have been underwritten are pooled together into a bundle, which is then considered an asset and the underwriter then sells its shares; hence, the risk is transferred from the insurers to the capital markets. Securitization made a significant difference in the way insurance risk is traded—by making it a commodity and taking it to the capital markets in addition to or instead of to the insurance/reinsurance market. Various insurance companies’ risks for similar exposures in diversified locations are combined in one package that is sold to investors (who may also include insurers). Securitized catastrophe instruments can help a firm or an individual to diversify risk exposures when reinsurance is limited or not available. Because global capital markets are so vast, they offer a promising means of funding protection for even the largest potential catastrophes. Capital market solutions also allow the industry (insurers and reinsurers) to reduce credit risk exposure, also known as counterparty riskRisk of loss from failure of a counterparty, or second party, in a derivatives contract to perform as agreed or contracted.. This is the risk of loss from failure of a counterparty, or second party, in a derivatives contract to perform as agreed or contracted. Capital market solutions also diversify funding sources by spreading the risk across a broad spectrum of capital market investors. Securitization instruments are also called insurance-linked securities (ISLs)General term for securitization instruments.. They include catastrophe bonds, catastrophe risk exchange swaps, insurance-related derivatives/options, catastrophe equity puts (Cat-E-Puts), contingent surplus notes, collateralized debt obligations (CDOs),A word of caution: AIG and its CDS without appropriate capitalization and reserves. The rating of credit rating agencies provided the security rather than true funds. Thus, when used inappropriately, the use of such instruments can take down giant corporations as is the case of AIG during the 2008 to 2009 crisis. and weather derivatives.
Catastrophe bondsBonds that seek to protect the insurance industry from catastrophic events., or CAT bonds, seek to protect the insurance industry from catastrophic events. The bonds pay interest and return principal to investors the way other debt securities do—as long as the issuer does not experience losses above an agreed-upon limit. Insurers can come to the capital market to issue bonds that are tied to a single peril, or even to a portfolio or basket of risks. Embedded in each issue is a risk trigger that, in the event of catastrophic loss, allows for forgiveness of interest and/or principal repayment.
The CAT Bond Story
Innovation is key to the success stories on Wall Street. In November 1996, Morgan Stanley & Co. was about to make history as the first to underwrite an insurance-related issue offered to the public: catastrophe bonds. California Earthquake Authority (CEA), a state agency providing homeowners insurance, needed capital and had sought Wall Street’s assistance. Morgan Stanley proposed a simple structure: bonds paying a robust 10 percent interest but with a catastrophic loss trigger point of $7 billion. If CEA lost that much (or more) from any one earthquake, the investors would lose their principal.
The deal didn’t happen because Berkshire Hathaway’s insurance division, National Indemnity Co., offered to underwrite CEA’s earthquake risk. Many speculate that Berkshire was intent on foiling investment banking firms’ attempt to steal away traditional reinsurance business. The market didn’t go away, however. By the time Katrina hit the Gulf Coast in 2005, the market had grown to an estimated $6 billion in value. The market kept growing since 1997 when $900 million worth of CAT bonds were sold. In June of that year, USAA, a San Antonio-based insurer, floated an issue of $477 million in the capital markets with a one-year maturity. The loss threshold was $1 billion. As long as a hurricane didn’t hit USAA for more than the $1 billion over the one-year time period, investors would enjoy a hefty coupon of 11 percent and would get their principal back.
Reinsurer industry executives agreed upon only one thing: CAT bonds would radically change their business. With ongoing property development in catastrophe-prone areas, the insurance industry’s exposure to huge losses is only increasing. S&P calculated that the probability of a $1 billion loss occurring in any given year is about 68 percent, while the probability of a $3 billion loss drops to about 31 percent. The chance of a $15 billion loss in a given year is about 4 percent. For example, Hurricane Ike produced losses of about $23 billion in 2008.
CAT bonds have been hailed for the following reasons: they add capacity to the market, fill in coverage gaps, and give risk managers leverage when negotiating with insurers by creating a competitive alternative. As the insurance industry cycles, and the next wave of disasters depletes reinsurance companies’ capital and surplus, Wall Street will be poised to take advantage. During soft markets, CAT bonds are more expensive than traditional reinsurance. If reinsurance markets begin to harden, CAT bond issues are a practical alternative. However, some downside potential threaten. What happens when you have a loss, and the bonds are used to pay for the exposure? Andrew Beazley, active underwriter of Beazley Syndicate 623 in London, said, “Once you have a loss, the bonds will pay, but you still have the exposure. The question is whether you’ll be able to float another bond issue to cover it the next time something happens. Reinsurers are expected to stick around and still write coverage after a loss, but can the same be said with CAT bond investors?” Apparently, the answer is “yes,” as evidenced from the substantial growth of this risk capital from an estimated $4.04 billion in 2004 to approximately $6 billion in 2005. The biggest fear of the CAT bonds owners in the aftermath of Katrina did not materialize. The insured losses from Katrina did not exceed the agreed level.
Sources: Andrew Osterland, “The CATs Are out of the Bag,” BusinessWeek, January 26, 1998; Douglas McLeod, “Cat Bonds to Grow: Increasing Frequency of Losses Will Contribute: S&P,” Business Insurance, July 12 1999, 2; Mike Hanley, “Cat Bond Market Almost There,” International Risk Management, 8, no. 1 (2001); Sam Friedman, “There’s More than One Way to Skin a Cat,” National Underwriter, Property & Casualty/Risk & Benefits Management Edition, May 8, 2000; Mark E. Ruquet “CAT Bonds Grew 17 Percent In ‘04” National Underwriter Online News Service, April 1, 2005; Richard Beales and Jennifer Hughes, “Katrina Misses Cat Bond Holders,” Financial Times, August 31, 2005 at http://news.ft.com/cms/s/59e21066-1a66-11da-b7f5-00000e2511c8.html.
An example of a CAT bond is the issue by Oriental Land Company Ltd., owner and operator of Tokyo Disneyland. Oriental Land used CAT bonds to finance one facility providing earthquake coverage and the other to provide standby financing to continue a $4 billion expansion of the theme park. Each facility raised $100 million via the bond market to cover property risk exposure and subsequent indirect business interruption loss in case of catastrophic loss from an earthquake. The trigger event was for an earthquake, regardless of whether the event caused any direct physical damage to the park.Sam Friedman, “There’s More Than One Way to Skin a Cat,” National Underwriter, Property & Casualty/Risk & Benefits, May 8, 2000. For more about how CAT bonds provide protection, see “The CAT Bond Story” in this chapter.
With catastrophe equity puts (Cat-E-Puts)Financial instrument that gives an insurer the option to sell equity (e.g., preferred shares) at predetermined prices, contingent upon the catastrophic event., the insurer has the option to sell equity (e.g., preferred shares) at predetermined prices, contingent upon the catastrophic event. Contingent surplus notesOptions to borrow money in case of a specific event. are options to borrow money in case of a specific event. Collateralized debt obligations (CDOs)Securities backed by a pool of diversified assets. are securities backed by a pool of diversified assets; these are referred to as collateralized bond obligations (CBOs) when the underlying assets are bonds and as collateralized loan obligations (CLOs) when the underlying assets are bank loans.Definition from Frank J. Fabozzi and Laurie S. Goodman, eds., Investing in Collateralized Debt Obligations (Wiley, 2001). Weather derivativesDerivative contracts that pay based on weather-related events. are derivative contracts that pay based on weather-related events. All are examples of financial market instruments that have been used to transfer risk and to provide risk-financing vehicles.A comprehensive report by Guy Carpenter appears in “The Evolving Market for Catastrophic Event Risk,” August 1998, http://www.guycarp.com/publications/white/evolving/evolv24.html.
Investors’ advantages in insurance-linked securities are diversification, as these instruments allow noninsurance investors to participate in insurance-related transactions and above-average rates of return. Advantages to the issuers of such instruments include greater capacity and access to the capital markets. Insurance-linked securities provide issuers with more flexibility and less reliance on reinsurers. The presence of new instruments stabilizes reinsurance pricing and provides higher levels of risk transfer with cutting-edge understanding for both insurance and capital markets.
We have shown that enterprise risk management (ERM) for a corporation is indeed complex. Full enterprise-wide risk management entails folding financial risk management into the CRO’s department responsibilities. A chief risk officer’s role is multifaceted. Today, risk managers develop goals to widen the understanding of risk management so that employees take into account risk considerations in their day-to-day operations. Risk awareness has become imperative to the overall health of the organization. Sound practices must incorporate the advancements on the technology front so that companies can compete in the global environment. Viewing all integrated segments of risk from across the enterprise in a holistic manner facilitates a global competitive advantage.
Example: The Case of Financial Risk Management for the Hypothetical Hometown Bank
John Allen is the CEO of Hometown Bank.Written by Denise Togger, printed with permission of the author. Denise Williams Togger earned her Bachelor of Science degree in economics in 1991 and her Master of Science in finance in 2002 from Virginia Commonwealth University. In fulfilling the MS degree requirements, she completed an independent study in finance focusing on enterprise risk management tools. Text and case material presented draws from curriculum, research, and her eighteen years experience in the investment securities industry. Most recently Denise served as a member of the risk management committee of BB&T Capital Markets as senior vice president and fixed-income preferred trader. BB&T Capital Markets is the capital markets division of BB&T Corporation, the nation’s fourteenth largest financial holding company. It was featured as part of Case 4 in the original “Risk Management and Insurance” Textbook by Etti Baranoff, 2003, Wiley and Sons. Mr. Allen is addressing company-wide, long-range plans to incorporate risk management techniques to maximize his bank’s financial performance and shareholder value.
Important note: This hypothetical case reflects a bank’s activities in the early 2000s. It does not deal with the 2008–2009 credit crisis and it ramifications on many banks and the financial institutions globally.
History
In the early years of U.S. banking history, banks seemed to have the easiest job in the corporate world. All a bank manager had to do was receive deposits in the form of checking, savings, and deposit accounts (bank liabilities), and provide mortgage and other lending services (bank assets). Throughout the twentieth century, the banking industry prospered. For most of the post–World War II era the upward-sloping yield curve meant that interest rates on traditional thirty-year residential mortgage loans exceeded rates on shorter-term savings and time deposits.Anthony Saunders, Chapter 1 "The Nature of Risk: Losses and Opportunities" Financial Institutions Management: A Modern Perspective, 3rd ed. (New York: McGraw-Hill Higher Education, 2000), ch. 1. The positive net margin between the two rates accounted for banks’ prosperity. All of this ended abruptly when the Federal Reserve changed its monetary policy in October 1979 to one of targeting bank reserves instead of interest rates. Figure 5.3 "Thirty-Year Treasury Rates—Secondary Market" and Figure 5.4 "Three-Month Treasury Bills Rates—Secondary Market" provide a historical perspective of interest rates.
Figure 5.3 Thirty-Year Treasury Rates—Secondary Market
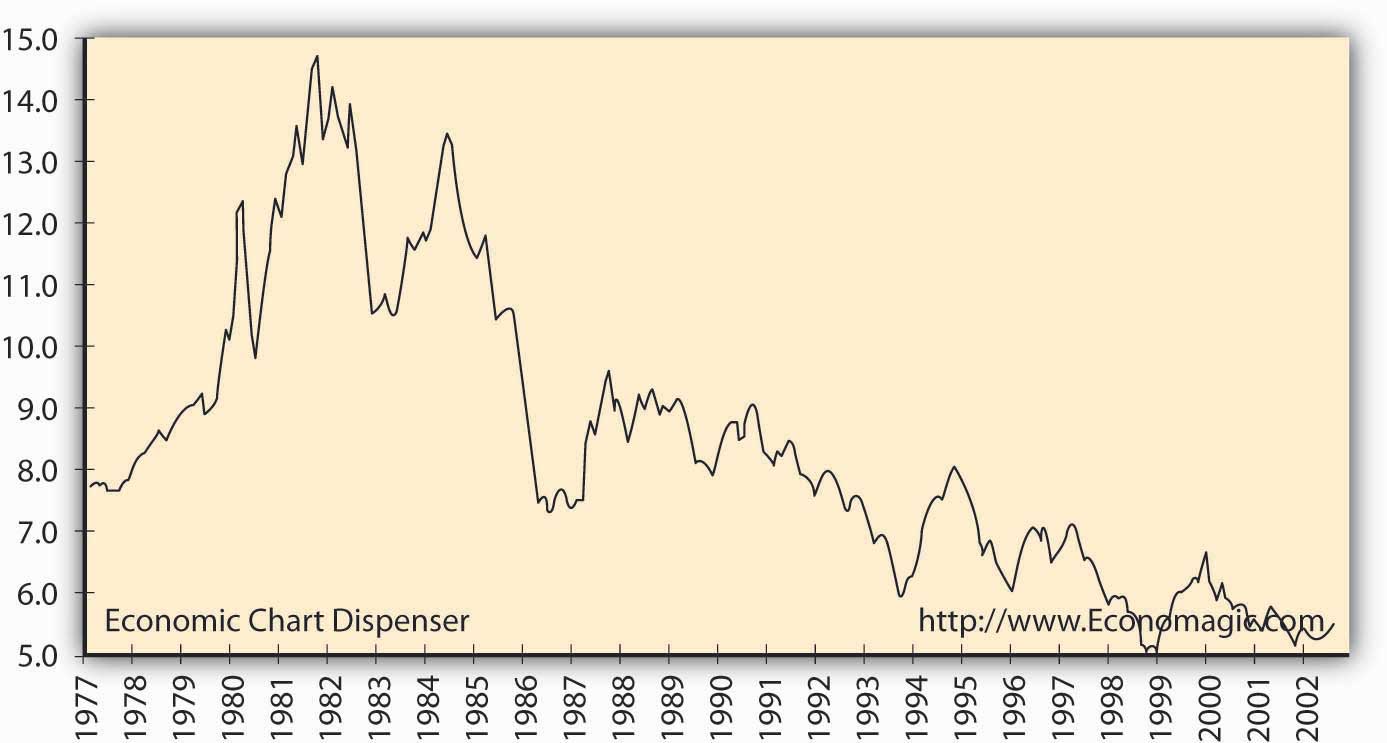
Source: http://www.Economagic.com. Economagic includes the original data source: U.S. Government, Federal Reserve Board of Governors historical monthly interest rate series.
Figure 5.4 Three-Month Treasury Bills Rates—Secondary Market
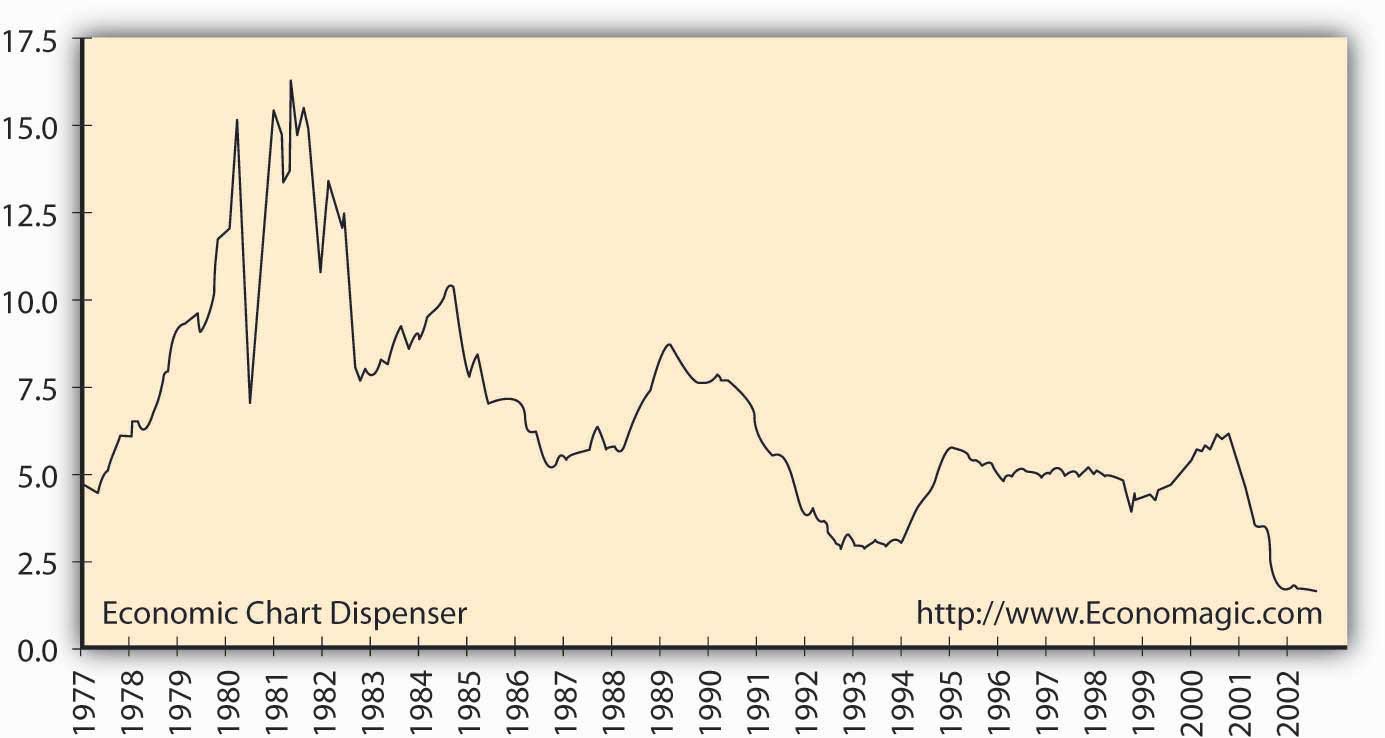
Source: http://www.Economagic.com. Economagic includes the original data source: U.S. Government, Federal Reserve Board of Governors historical monthly interest rate series.
Figure 5.3 "Thirty-Year Treasury Rates—Secondary Market" and Figure 5.4 "Three-Month Treasury Bills Rates—Secondary Market" graphically present interest rate risk exposure that banks face. The noticeable change is the absolute pickup in interest rate volatility from 1979 forward. As Figure 5.4 "Three-Month Treasury Bills Rates—Secondary Market" shows, three-month T-bill interest rates reached above 16 percent in the early 1980s. Yet many banks’ assets were locked into low-interest, long-term loans, mostly thirty-year mortgages. The financial crisis that followed the rapid rise in interest rates (on both short- and long-term liabilities) was catastrophic in proportion; many banks failed by positioning their loan portfolios incorrectly for the change in interest rates. Locked-in long-term mortgage loan rates provided insufficient cash inflows to meet the higher cash outflows required on deposits. Those that survived had to make major changes in their risk management style. Later we will introduce how a specific bank, Hometown Bank, manages its interest rate exposure using derivatives.
“Modern banks employ credit-scoring techniques to ensure that they are making good lending decisions, use analytical models to monitor the performance of their loan portfolios, and implement financial instruments to transfer out those credit risks with which they are not comfortable.”Sumit Paul-Choudhury, “Real Options,” Risk Management Magazine, September 2001, 38. Bankers learned a costly lesson in the 1980s by not being adequately prepared for a changing interest rate environment. Risk management must be enterprise-wide and inclusive of all components of risk. Hometown Bank is a surviving bank, with lofty goals for the future. The current focus for CEO John Allen has three components:
-
Review the primary elements of Hometown’s financial risks:
- Interest rate risk—those risks associated with changes in interest rates
- Market risk—risk of loss associated with changes in market price or value
- Credit risk—risk of loss through customer default
- Review Hometown’s nonfinancial, or operational, risks: those risks associated with the operating processes or systems in running a bank
- Monitor the success of risk mitigation techniques the bank employs
The Hypothetical Hometown Bank—Early 2000s
Hometown Bancorp was formed in 1985 as a financial holding company headquartered in Richmond, Virginia. Its only subsidiary is Hometown Bank, which was chartered in 1950 with the opening of its first branch in downtown Richmond. Hometown has experienced a steady growth of core assets: deposits, money market instruments, and marketable security investments. Table 5.6 "Hometown Bancorp Investment Policy, December 31, 2001" shows Hometown’s investment policy and lists allowable securities for their investment securities account.
Table 5.6 Hometown Bancorp Investment Policy, December 31, 2001
|
The securities portfolio is managed by the president and treasurer of the bank. Investment management is handled in accordance with the investment policy, which the board of directors approves annually. To assist in the management process, each investment security shall be classified as “held-for-maturity” or “available-for-sale.” The investment policy covers investment strategies, approved securities dealers, and authorized investments. The following securities have been approved as investments:
All securities must be investment grade quality and carry a minimum rating of no less than single-A by Moody’s or Standard & Poor’s. |
Asset growth has occurred both internally and externally with the acquisition of community banks and branches in Hometown’s market. Market domain expanded to include the capital region (the city of Richmond and surrounding counties), the Tidewater region, the Shenandoah Valley region, and the northern Virginia markets. In March 2002, Hometown Bank opened its twenty-fifth branch, in Virginia Beach, Virginia. With total assets of approximately $785 million (as of December 2001), Hometown ranks as the eighth largest commercial bank in the state of Virginia. The network of branches offers a wide range of lending and deposit services to business, government, and consumer clients. The use of these deposits funds both the loan and investment portfolio of the bank. Principal sources of revenue are interest and fees on loans and investments and maintenance fees for servicing deposit accounts. Principal expenses include interest paid on deposits and other borrowings and operating expenses. Corporate goals include achieving superior performance and profitability, gaining strategic market share, and providing superior client service. Hometown has achieved its fifth consecutive year of record earnings. Table 5.7 "Hometown Bancorp and Subsidiaries Financial Statements (in Thousands)" shows Hometown’s consolidated financial statements from 1999 to 2001.
Table 5.7 Hometown Bancorp and Subsidiaries Financial Statements (in Thousands)
| 2001 | 2000 | 1999 | |
|---|---|---|---|
| Consolidated Balance Sheet | |||
| Interest-earning assets | |||
| Money market investments | $62,800 | $49,600 | $39,100 |
| Investment securities | 65,500 | 51,700 | 40,800 |
| Loans | 649,300 | 513,000 | 405,000 |
| Allowance for loan losses | (11,300) | (7,600) | (6,000) |
| Premises, furniture, & equipment | 14,900 | 11,700 | 10,000 |
| Other real estate | 3,800 | 3,000 | 2,500 |
| Total assets | $785,000 | $621,400 | $491,400 |
| Interest-bearing liabilities | |||
| Deposits | $467,500 | $369,300 | $292,000 |
| Other short-term borrowings | 123,000 | 97,000 | 76,700 |
| non-interest borrowings | 117,000 | 92,400 | 73,000 |
| Long-term debt | 12,900 | 10,000 | 8,200 |
| Total liabilities | $720,400 | $568,700 | $449,900 |
| Shareholders’ equity | 64,600 | $52,700 | 41,500 |
| Total liabilities and shareholders equity | $785,000 | $621,400 | $491,400 |
| Consolidated Income Statement | |||
| Interest income | $55,000 | $44,000 | $34,700 |
| Interest expense | (27,500) | (21,100) | (18,300) |
| Net interest income | $27,500 | $22,900 | $16,400 |
| Provision for loan losses | (4,400) | (3,400) | (2,700) |
| Net interest income after provision | $23,100 | $19,500 | $13,700 |
| noninterest income | 4,400 | 2,800 | 1,900 |
| Operating expenses | (16,900) | (14,300) | (10,100) |
| Income before taxes | $10,600 | $8,000 | $5,500 |
| Taxes | (3,600) | (2,700) | (1,100) |
| Net Income | $7,000 | $5,300 | $4,400 |
The Challenges of Managing Financial Risk
Corporations all face the challenge of identifying their most important risks. Allen has identified the following broad risk categories that Hometown Bank faces:
- Interest rate risk associated with asset-liability management
- Market risk associated with trading activities and investment securities portfolio management; that is, the risk of loss/gain in the value of bank assets due to changes in market prices (VaR was computed for this Bank in Chapter 2 "Risk Measurement and Metrics").
- Credit risk associated with lending activities, including the risk of customer default on repayment (VaR was computed for this Bank in Chapter 2 "Risk Measurement and Metrics")
- Operational risk associated with running Hometown Bank and the operating processes and systems that support the bank’s day-to-day activities
Here we only elaborate on the management of interest rate risk using swaps.
Interest Rate Risk
Hometown Bank’s primary financial objective is to grow its assets. Net worth, also known as shareholder value, is defined as:
Thus, when assets grow more than liabilities, shareholder value also increases. Hometown Bank’s assets, as noted on its consolidated balance sheet in Table 5.7 "Hometown Bancorp and Subsidiaries Financial Statements (in Thousands)", primarily consist of loans; at year-end 2001, $649 million of Hometown’s $785 million total assets were in the form of loans (see Table 5.8 "Loan Portfolio Composition, Hometown Bancorp (in Thousands)" for loan portfolio composition). Hometown obtains funding for these loans from its deposit base. Note that for Hometown Bank, as for all banks, deposit accounts are recorded as liabilities. Hometown Bank has an outstanding obligation to its deposit customers to give the money back. For Hometown, deposits make up $467.5 million, or 65 percent, of total outstanding liabilities. The mismatch between deposits and loans is each element’s time frame. Hometown’s main asset category, retail mortgage loans, has long-term maturities, while its main liabilities are demand deposits and short-term CDs, which have immediate or short-term maturities.
Table 5.8 Loan Portfolio Composition, Hometown Bancorp (in Thousands)
| 2001 Amount ($) | % | 2000 Amount ($) | % | 1999 Amount ($) | % | ||
|---|---|---|---|---|---|---|---|
| Construction and land development | |||||||
| Residential | 32,465 | 5 | 30,780 | 6 | 28,350 | 7% | |
| Commercial | 32,465 | 5 | 25,650 | 5 | 20,250 | 5 | |
| Other | 12,986 | 2 | 20,520 | 4 | 16,200 | 4 | |
| Mortgage | |||||||
| Residential | 331,143 | 51 | 241,110 | 47 | 182,250 | 45 | |
| Commercial | 110,381 | 17 | 82,080 | 16 | 81,000 | 20 | |
| Commercial and industrial | 32,465 | 5 | 41,040 | 8 | 24,300 | 6 | |
| Consumer | 97,395 | 15 | 71,820 | 14 | 52,650 | 13 | |
| Total Loans Receivable | 649,300 | 100 | 513,000 | 100 | 405,000 | 100 | |
Hometown’s net cash outflows represent payments of interest on deposits. Because of the deposits’ short-term maturities, these interest payments are subject to frequent changes. Demand depositors’ interest rates can change frequently, even daily, to reflect current interest rates. Short-term CDs are also subject to changes in current interest rates because the interest rate paid to customers changes at each maturity date to reflect the current market. If bank customers are not happy with the new rate offered by the bank, they may choose not to reinvest their CD. Interest rate risk for Hometown Bank arises from its business of lending long-term, with locked-in interest rates, while growing their loan portfolio with short-term borrowings like CDs, with fluctuating interest rates. This risk has increased dramatically because of the increase in interest rate volatility. During the period of January 2001 through October 2002, three-month treasury bills traded in a range from 6.5 percent to 1.54 percent. (Refer to Figure 5.3 "Thirty-Year Treasury Rates—Secondary Market"). During periods of inverted yield curves (where longer-term investments have lower interest rates than short-term investments), a bank’s traditional strategy of providing long-term loans using deposits is a money-losing strategy. Note the normal yield curve and inverted yield curve inset below in Figure 5.5 "Yield Curves".
Figure 5.5 Yield Curves
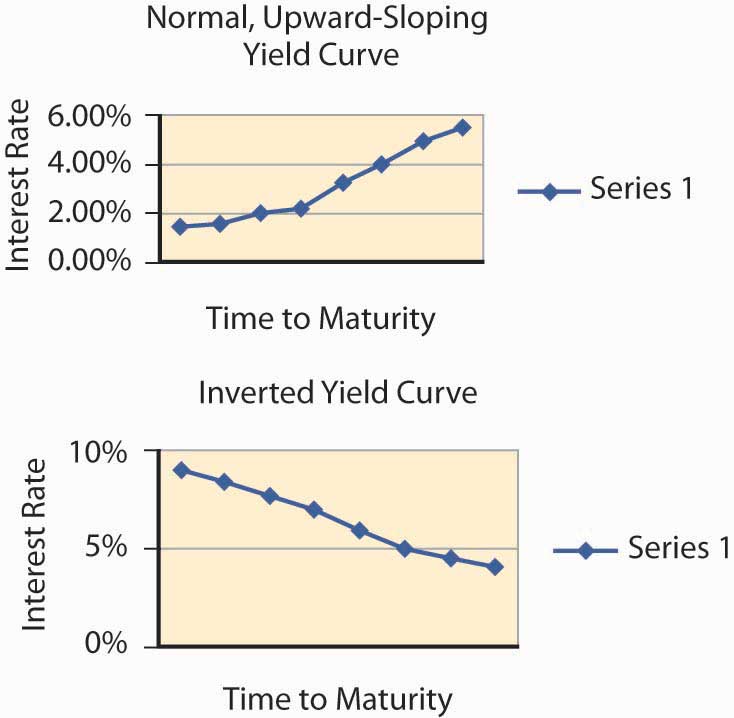
When interest rates are inverted, cash outflows associated with interest payments to depositors will exceed cash inflows from borrowers such as mortgage holders. For example, a home buyer with a thirty-year mortgage loan at 6 percent on $100,000 will continue to make principal and interest payments to Hometown at $597.65 per month. Interest cash flow received by Hometown is calculated at the 6 percent stated rate on the $100,000 loan. If short-term interest rates move higher, for example to 10 percent, Hometown will have interest cash outflows at 10 percent with interest cash inflows at only 6 percent. How will Hometown Bank deal with this type of interest rate risk?
Swaps as a Tool
An interest rate swap is an agreement between two parties to exchange cash flows at specified future times. Banks use interest rate swaps primarily to convert floating-rate liabilities (remember, customers will demand current market interest rates on their deposits—these are the floating rates) into fixed-rate liabilities. Exchanging variable cash flows for fixed cash flows is called a “plain vanilla” swap. Hometown can use a swap as a tool to reduce interest rate risk.
Table 5.9 Interest Rate Risks
| U.S. Banks | European Banks | ||
|---|---|---|---|
| Assets | Liabilities | Assets | Liabilities |
| Fixed rate loans | Floating rate deposits | Floating rate loans | Fixed rate deposits |
| Hometown Bank Average Rates | |||
| 7.25% | 2.5% | ||
| Risk: If interest rates go up, interest paid on deposits could exceed interest received on loans; a loss | Risk: If interest rates go down, interest received on loans could be less than interest paid on deposits; a loss | ||
European banks are the opposite of U.S. banks. European bank customers demand floating rate loans tied to LIBOR (London Interbank Offer Rate); their loans are primarily variable rate and their deposit base is fixed-rate time deposits. If two banks, one U.S. and one European, can agree to an exchange of their liabilities the result is the following:
Table 5.10 Objective of Mitigating Interest Rate Risks
| U.S. Bank | European Bank | ||
|---|---|---|---|
| Assets | Liabilities | Assets | Liabilities |
| Fixed | Fixed | Floating | Floating |
The swap creates a match of interest-rate-sensitive cash inflows and outflows: fixed rate assets and liabilities for the U.S. bank and floating rate assets and liabilities for the European bank as shown in Table 5.10 "Objective of Mitigating Interest Rate Risks". The following steps show how Hometown Bank employs the financial instrument of a swap with SwissBank for $100 million of their mortgage loans as a risk management tool.
In our simplified example, Hometown agrees to swap with SwissBank cash flows equal to an agreed-upon fixed rate of 3 percent on $100 million, a portion of their total assets. The term is set for ten years. At the same time, SwissBank agrees to pay Hometown cash flows equal to LIBOR an indexed short-term floating rate of interest on the same $100 million. Remember, the contract is an agreement to exchange, or swap, interest payments only. The amount is determined by the desired amount of assets the two parties wish to hedge against interest rate risk. They agree to do this because, as explained above, it better aligns each bank’s risk. They agree to swap to minimize interest-rate risk exposure. For Hometown Bank, when interest rates rise, the dollars they receive on the swap increase. This creates a gain on the swap that offsets the loss or supplements the smaller margins are available to the bank because of interest rate moves. Keep in mind that the interest margin may have been profitable at the time of the original transaction; however, higher interest rates have increased cash outflows of interest paid to depositors.
Table 5.11 Swap Cash Flow
| Hometown Bank | Pays 5 percent fixed rate to | SwissBank |
| SwissBank | pays LIBOR to | Hometown Bank |
| Swap Example for Hometown Bank | |||||
|---|---|---|---|---|---|
| End of Year | LIBOR | Fixed-Rate | Interest Obligation of Hometown Bank | Interest Obligation of SwissBank | Net Cash Payment to Hometown |
| 1 | 2.50% | 3% | $100,000,000 × .03 = $3,000,000 | $100,000,000 × .025 = $2,500,000 | $(500,000) |
| 2 | 3.00% | 3% | $100,000,000 × .03 = $3,000,000 | $100,000,000 × .03 = $3,00,000 | $0 |
| 3 | 4.00% | 3% | $100,000,000 × .03 = $3,000,000 | $100,000,000 × .04 = $4,000,000 | $1,000,000 |
| 4 | 4.50% | 3% | $100,000,000 × .03 = $3,000,000 | $100,000,000 × .045 = $4,500,000 | $1,500,000 |
| … | |||||
| 10 | 5.50% | 3% | $100,000 × .03 = $3,000,000 | $100,000,000 × 0.55 = $5,500,000 | $2,500,000 |
In our example in Table 5.11 "Swap Cash Flow", we show what happens if interest rates increase. Over the sample four years shown, short-term interest rates move up from 2.50 percent to 4.50 percent. If Hometown Bank was not hedged with the interest rate swap, their interest expenses would increase as their deposit base would be requiring higher interest cash outflows. With the swap, Hometown Bank can offset the higher cash outflows on their liabilities (higher interest payments to depositors) with the excess cash payments received on the swap. The swap mitigates the risk of increasing interest rates.
Why, you might ask, would SwissBank agree to the swap? Remember, SwissBank has floating rate loans as the majority of their asset base. As interest rates rise, their cash inflows increase. This offsets their increasing cash flows promised to Hometown Bank. The risk of loss for SwissBank comes into play when interest rates decline. If interest rates were to decline below the fixed rate of 3 percent, SwissBank would benefit from the swap.
Key Takeaway
- In this section you learned about the use capital markets to mitigate risks and the many financial instruments that are used as derivatives to hedge against risks.
Discussion Questions
- What financial instrument might a jeweler use to cap his price for gold, the main raw material used in jewelry production?
- If an insurance company invests in the stock market, what type of instrument would the insurer use to mitigate the risk of stock price fluctuations?
- What are the benefits of securitization in the insurance/reinsurance industry?
- It has been said that the most important thing in the world is to know what is most important now. What do you think is the most important risk for you now? What do you think will be the most important risk you will face twenty-five years from now?
- Explain securitization and provide examples of insurance-linked securities.
- Explain how swaps work to mitigate the interest rate risk. Give an example.