This is “Responsiveness of Demand to Other Factors”, section 5.2 from the book Economics Principles (v. 2.0). For details on it (including licensing), click here.
For more information on the source of this book, or why it is available for free, please see the project's home page. You can browse or download additional books there. To download a .zip file containing this book to use offline, simply click here.


5.2 Responsiveness of Demand to Other Factors
Learning Objectives
- Explain the concept of income elasticity of demand and its calculation.
- Classify goods as normal or inferior depending on their income elasticity of demand.
- Explain the concept of cross price elasticity of demand and its calculation.
- Classify goods as substitutes or complements depending on their cross price elasticity of demand.
Although the response of quantity demanded to changes in price is the most widely used measure of elasticity, economists are interested in the response to changes in the demand shifters as well. Two of the most important measures show how demand responds to changes in income and to changes in the prices of related goods and services.
Income Elasticity of Demand
We saw in the chapter that introduced the model of demand and supply that the demand for a good or service is affected by income. We measure the income elasticity of demandThe percentage change in quantity demanded at a specific price divided by the percentage change in income that produced the demand change, all other things unchanged., eY, as the percentage change in quantity demanded at a specific price divided by the percentage change in income that produced the demand change, all other things unchanged:
Equation 5.3
The symbol Y is often used in economics to represent income. Because income elasticity of demand reports the responsiveness of quantity demanded to a change in income, all other things unchanged (including the price of the good), it reflects a shift in the demand curve at a given price. Remember that price elasticity of demand reflects movements along a demand curve in response to a change in price.
A positive income elasticity of demand means that income and demand move in the same direction—an increase in income increases demand, and a reduction in income reduces demand. As we learned, a good whose demand rises as income rises is called a normal good.
Studies show that most goods and services are normal, and thus their income elasticities are positive. Goods and services for which demand is likely to move in the same direction as income include housing, seafood, rock concerts, and medical services.
If a good or service is inferior, then an increase in income reduces demand for the good. That implies a negative income elasticity of demand. Goods and services for which the income elasticity of demand is likely to be negative include used clothing, beans, and urban public transit. For example, the studies we have already cited concerning the demands for urban public transit in France and in Madrid found the long-run income elasticities of demand to be negative (−0.23 in France and −0.25 in Madrid).See Georges Bresson, Joyce Dargay, Jean-Loup Madre, and Alain Pirotte, “Economic and Structural Determinants of the Demand for French Transport: An Analysis on a Panel of French Urban Areas Using Shrinkage Estimators.” Transportation Research: Part A 38: 4 (May 2004): 269–285. See also Anna Matas. “Demand and Revenue Implications of an Integrated Transport Policy: The Case of Madrid.” Transport Reviews 24:2 (March 2004): 195–217.
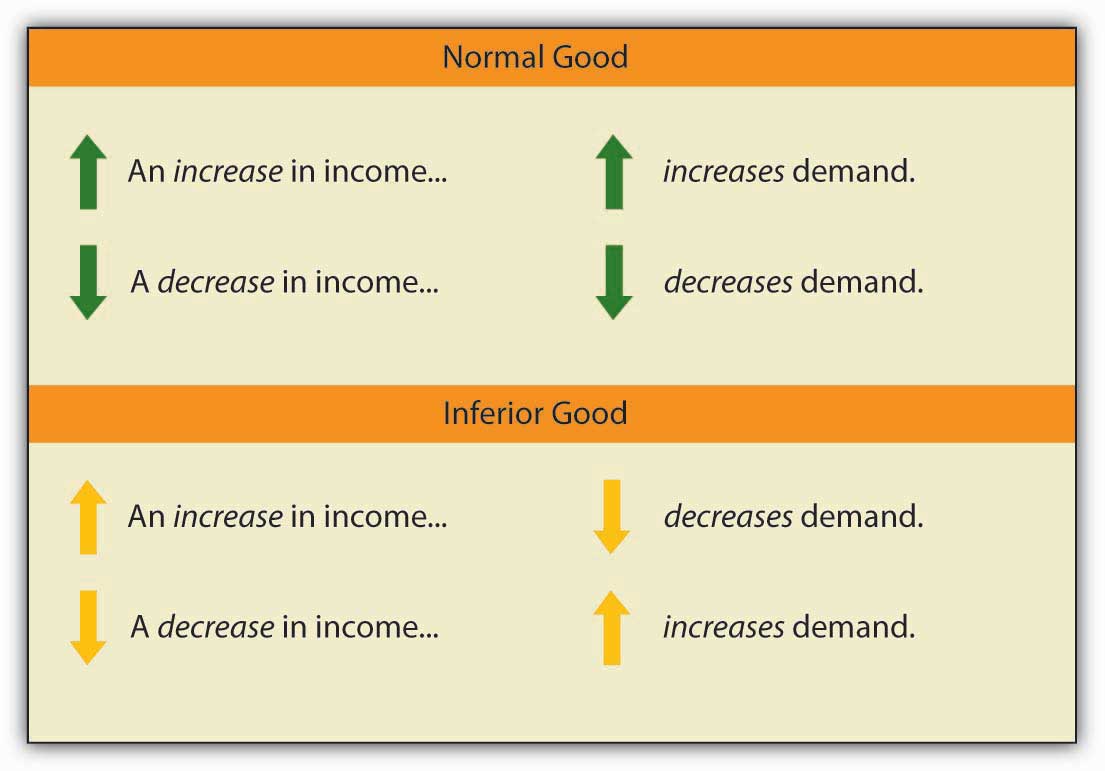
When we compute the income elasticity of demand, we are looking at the change in the quantity demanded at a specific price. We are thus dealing with a change that shifts the demand curve. An increase in income shifts the demand for a normal good to the right; it shifts the demand for an inferior good to the left.
Cross Price Elasticity of Demand
The demand for a good or service is affected by the prices of related goods or services. A reduction in the price of salsa, for example, would increase the demand for chips, suggesting that salsa is a complement of chips. A reduction in the price of chips, however, would reduce the demand for peanuts, suggesting that chips are a substitute for peanuts.
The measure economists use to describe the responsiveness of demand for a good or service to a change in the price of another good or service is called the cross price elasticity of demandIt equals the percentage change in the quantity demanded of one good or service at a specific price divided by the percentage change in the price of a related good or service., eA, B. It equals the percentage change in the quantity demanded of one good or service at a specific price divided by the percentage change in the price of a related good or service. We are varying the price of a related good when we consider the cross price elasticity of demand, so the response of quantity demanded is shown as a shift in the demand curve.
The cross price elasticity of the demand for good A with respect to the price of good B is given by:
Equation 5.4
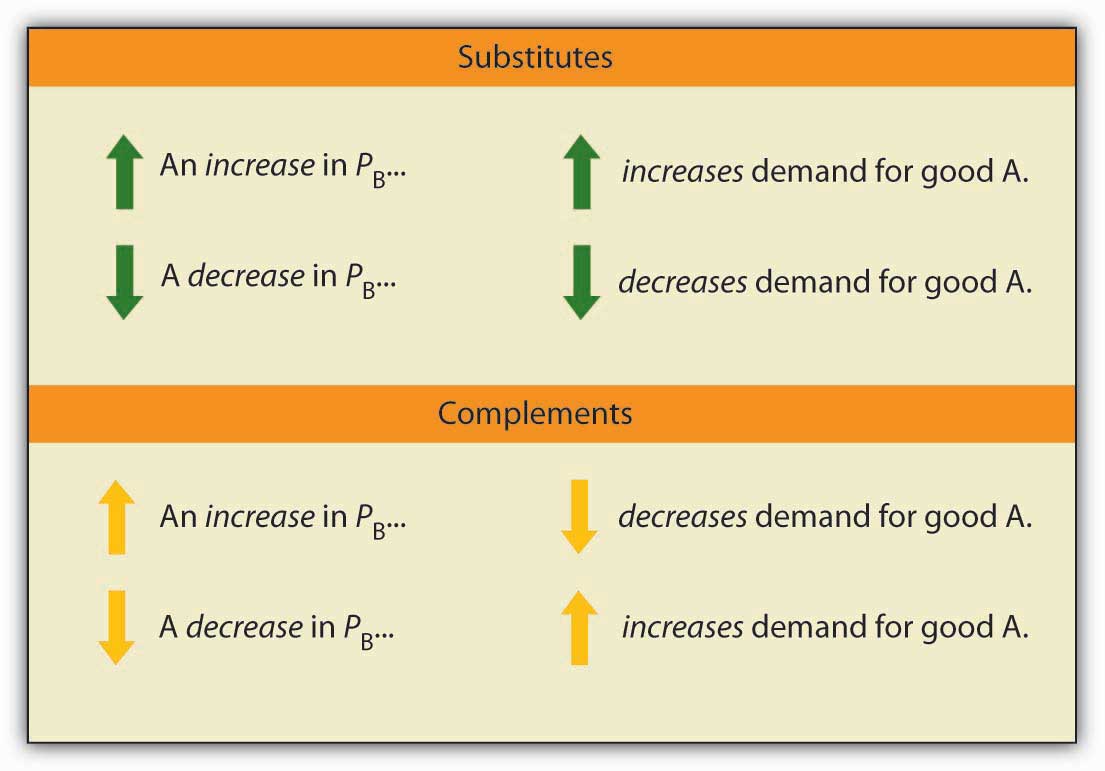
Cross price elasticities of demand define whether two goods are substitutes, complements, or unrelated. If two goods are substitutes, an increase in the price of one will lead to an increase in the demand for the other—the cross price elasticity of demand is positive. If two goods are complements, an increase in the price of one will lead to a reduction in the demand for the other—the cross price elasticity of demand is negative. If two goods are unrelated, a change in the price of one will not affect the demand for the other—the cross price elasticity of demand is zero.
An examination of the demand for local television advertising with respect to the price of local radio advertising revealed that the two goods are clearly substitutes. A 10 per cent increase in the price of local radio advertising led to a 10 per cent increase in demand for local television advertising, so that the cross price elasticity of demand for local television advertising with respect to changes in the price of radio advertising was 1.0.Robert B. Ekelund, S. Ford, and John D. Jackson. “Are Local TV Markets Separate Markets?” International Journal of the Economics of Business 7:1 (2000): 79–97.
Heads Up!
Notice that with income elasticity of demand and cross price elasticity of demand we are primarily concerned with whether the measured value of these elasticities is positive or negative. In the case of income elasticity of demand this tells us whether the good or service is normal or inferior. In the case of cross price elasticity of demand it tells us whether two goods are substitutes or complements. With price elasticity of demand we were concerned with whether the measured absolute value of this elasticity was greater than, less than, or equal to 1, because this gave us information about what happens to total revenue as price changes. The terms elastic and inelastic apply to price elasticity of demand. They are not used to describe income elasticity of demand or cross price elasticity of demand.
Key Takeaways
- The income elasticity of demand reflects the responsiveness of demand to changes in income. It is the percentage change in quantity demanded at a specific price divided by the percentage change in income, ceteris paribus.
- Income elasticity is positive for normal goods and negative for inferior goods.
- The cross price elasticity of demand measures the way demand for one good or service responds to changes in the price of another. It is the percentage change in the quantity demanded of one good or service at a specific price divided by the percentage change in the price of another good or service, all other things unchanged.
- Cross price elasticity is positive for substitutes, negative for complements, and zero for goods or services whose demands are unrelated.
Try It!
Suppose that when the price of bagels rises by 10%, the demand for cream cheese falls by 3% at the current price, and that when income rises by 10%, the demand for bagels increases by 1% at the current price. Calculate the cross price elasticity of demand for cream cheese with respect to the price of bagels and tell whether bagels and cream cheese are substitutes or complements. Calculate the income elasticity of demand and tell whether bagels are normal or inferior.
Case in Point: Various Demand Elasticities for Conventional and Organic Milk

© Thinkstock
Peruse the milk display at any supermarket and you will see a number of items that you would not have seen a decade ago. Choices include fat content; with or without lactose; animal milks or milk substitutes, such as soy or almond milk; flavors; and organic or conventional milk. Whereas in the 1990s only specialty stores stocked organic milk, today it is readily available in most supermarkets. In fact, the market share for organic milk has grown, as sales of conventional milk have been fairly constant while sales of organic milk have increased.
Professors Pedro Alviola and Oral Capps have estimated various demand elasticities associated with conventional and organic milk, based on a study of 38,000 households. Their results are summarized in the following table.
| Elasticity Measure | Organic Milk | Conventional Milk |
|---|---|---|
| Own-price elasticity | −2.00 | −0.87 |
| Cross-price elasticity | 0.70 | 0.18 |
| Income elasticity | 0.27 | −0.01 |
Organic milk is price elastic, while conventional milk is price inelastic. Both cross-price elasticities are positive, indicating that these two kinds of milk are substitutes but their estimated values differ. In particular, a 1% increase in the price of conventional milk leads to a 0.70% increase in the quantity demanded of organic milk, while a 1% increase in the price of organic milk leads to an increase in the quantity demanded of conventional milk of only 0.18%. This asymmetry suggests that organic milk consumers have considerable reluctance in switching back to what they may perceive as a lower-quality product. Finally, the income elasticity estimates suggest that organic milk is a normal good, while conventional milk is an inferior good. As might be expected, in the sample used in the study, purchasers of organic milk are more affluent as a group than are purchasers of conventional milk.
Being a fairly new product, organic milk studies are just becoming available and the authors point out that other researchers using different data sets have calculated different values for these elasticities. Over time, as more data become available and various studies are compared, this type of work is likely to influence milk marketing and pricing.
Source: Pedro A. Alviola IV and Oral Capps Jr., “Household Demand Analysis of Organic and Conventional Fluid Milk in the United States Based on the 2004 Nielsen Homescan Panel,” Agribusiness 26:3 (2010): 369–388.
Answer to Try It! Problem
Using the formula for cross price elasticity of demand, we find that eAB = (−3%)/(10%) = −0.3. Since the eAB is negative, bagels and cream cheese are complements. Using the formula for income elasticity of demand, we find that eY = (+1%)/(10%) = +0.1. Since eY is positive, bagels are a normal good.