This is “Natural Resources and Conservation”, section 13.3 from the book Economics Principles (v. 1.1). For details on it (including licensing), click here.
For more information on the source of this book, or why it is available for free, please see the project's home page. You can browse or download additional books there. To download a .zip file containing this book to use offline, simply click here.


13.3 Natural Resources and Conservation
Learning Objectives
- Distinguish between exhaustible and renewable natural resources.
- Discuss the market for exhaustible natural resources in terms of factors that influence both demand and supply.
- Discuss the market for renewable natural resources and relate the market outcome to carrying capacity.
- Explain and illustrate the concept of economic rent.
Natural resources are the gifts of nature. They include everything from oil to fish in the sea to magnificent scenic vistas. The stock of a natural resource is the quantity of the resource with which the earth is endowed. For example, a certain amount of oil lies in the earth, a certain population of fish live in the sea, and a certain number of acres make up an area such as Yellowstone National Park or Manhattan. These stocks of natural resources, in turn, can be used to produce a flow of goods and services. Each year, we can extract a certain quantity of oil, harvest a certain quantity of fish, and enjoy a certain number of visits to Yellowstone.
As with capital, we examine the allocation of natural resources among alternative uses across time. By definition, natural resources cannot be produced. Our consumption of the services of natural resources in one period can affect their availability in future periods. We must thus consider the extent to which the expected demands of future generations should be taken into account when we allocate natural resources.
Natural resources often present problems of property rights in their allocation. A resource for which exclusive property rights have not been defined will be allocated as a common property resource. In such a case, we expect that the marketplace will not generate incentives to use the resource efficiently. In the absence of government intervention, natural resources that are common property may be destroyed. In this section, we shall consider natural resources for which exclusive property rights have been defined. The public sector’s role in the allocation of common property resources is investigated in the chapter on the environment.
We can distinguish two categories of natural resources, those that are renewable and those that are not. A renewable natural resourceA resource whose services can be used in one period without necessarily reducing the stock of the resource that will be available in subsequent periods. is one whose services can be used in one period without necessarily reducing the stock of the resource that will be available in subsequent periods. The fact that they can be used in such a manner does not mean that they will be; renewable natural resources can be depleted. Wilderness areas, land, and water are renewable natural resources. The consumption of the services of an exhaustible natural resourceA resource whose services cannot be used in one period without reducing the stock of the resource that will be available in subsequent periods., on the other hand, necessarily reduces the stock of the resource. Oil and coal are exhaustible natural resources.
Exhaustible Natural Resources
Owners of exhaustible natural resources can be expected to take the interests of future as well as current consumers into account in their extraction decisions. The greater the expected future demand for an exhaustible natural resource, the greater will be the quantity preserved for future use.
Expectations and Resource Extraction
Suppose you are the exclusive owner of a deposit of oil in Wyoming. You know that any oil you pump from this deposit and sell cannot be replaced. You are aware that this is true of all the world’s oil; the consumption of oil inevitably reduces the stock of this resource.
If the quantity of oil in the earth is declining and the demand for this oil is increasing, then it is likely that the price of oil will rise in the future. Suppose you expect the price of oil to increase at an annual rate of 15%.
Given your expectation, should you pump some of your oil out of the ground and sell it? To answer that question, you need to know the interest rate. If the interest rate is 10%, then your best alternative is to leave your oil in the ground. With oil prices expected to rise 15% per year, the dollar value of your oil will increase faster if you leave it in the ground than if you pump it out, sell it, and purchase an interest-earning asset. If the market interest rate were greater than 15%, however, it would make sense to pump the oil and sell it now and use the revenue to purchase an interest-bearing asset. The return from the interest-earning asset, say 16%, would exceed the 15% rate at which you expect the value of your oil to increase. Higher interest rates thus reduce the willingness of resource owners to preserve these resources for future use.
Figure 13.8 Future Generations and Exhaustible Natural Resources
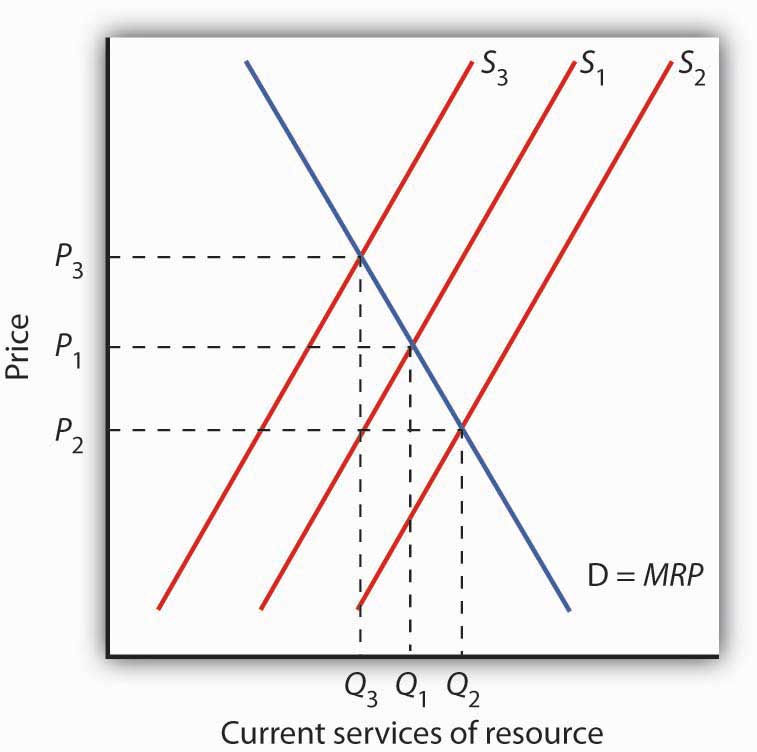
The current demand D for services of an exhaustible resource is given by the marginal revenue product (MRP). S1 reflects the current marginal cost of extracting the resource, the prevailing interest rate, and expectations of future demand for the resource. The level of current consumption is thus at Q1. If the interest rate rises, the supply curve shifts to S2, causing the price of the resource to fall to P2 and the quantity consumed to rise to Q2. A drop in the interest rate shifts the supply curve to S3, leading to an increase in price to P3 and a decrease in consumption to Q3.
The supply of an exhaustible resource such as oil is thus governed by its current price, its expected future price, and the interest rate. An increase in the expected future price—or a reduction in the interest rate—reduces the supply of oil today, preserving more for future use. If owners of oil expect lower prices in the future, or if the interest rate rises, they will supply more oil today and conserve less for future use. This relationship is illustrated in Figure 13.8 "Future Generations and Exhaustible Natural Resources". The current demand D for these services is given by their marginal revenue product (MRP). Suppose S1 reflects the current marginal cost of extracting the resource, the prevailing interest rate, and expectations of future demand for the resource. If the interest rate increases, owners will be willing to supply more of the natural resource at each price, thereby shifting the supply curve to the right to S2. The current price of the resource will fall. If the interest rate falls, the supply curve for the resource will shift to the left to S3 as more owners of the resource decide to leave more of the resource in the earth. As a result, the current price rises.
Resource Prices Over Time
Since using nonrenewable resources would seem to mean exhausting a fixed supply, then one would expect the prices of exhaustible natural resources to rise over time as the resources become more and more scarce. Over time, however, the prices of most exhaustible natural resources have fluctuated considerably relative to the prices of all other goods and services. Figure 13.9 "Natural Resource Prices, 1980–2007" shows the prices of four major exhaustible natural resources from 1980 to 2007. Prices have been adjusted for inflation to reflect the prices of these resources relative to other prices.
During the final two decades of the twentieth century, exhaustible natural resource prices were generally falling or stable. With the start of the current century, their prices have been rising. In short, why do prices of natural resources fluctuate as they do? Should the process of continuing to “exhaust” them just drive their prices up over time?
Figure 13.9 Natural Resource Prices, 1980–2007
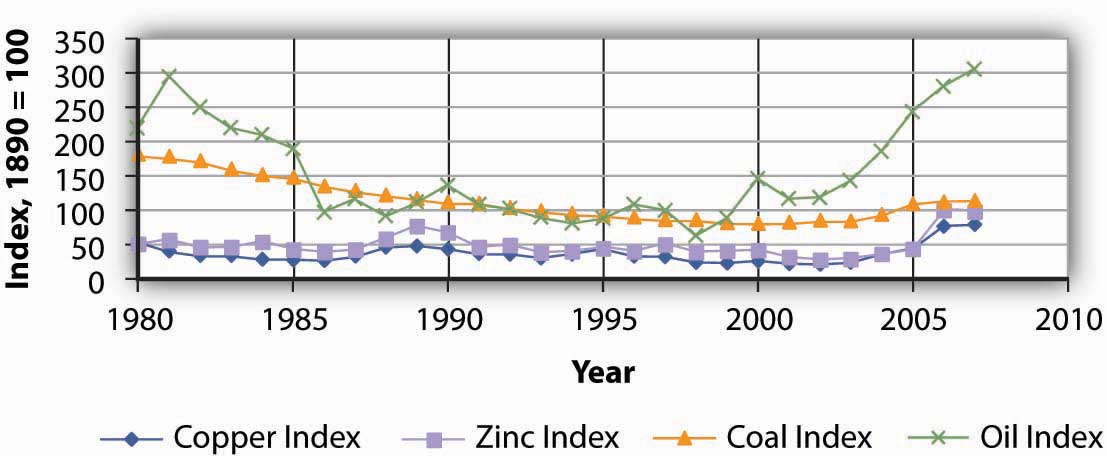
The chart shows changes in the prices of five exhaustible resources—chromium, copper, nickel, tin, and tungsten (relative to the prices of other goods and services)—from 1890–2003.
Sources: U.S. Bureau of the Census, Statistical Abstract of the United States, online; U.S. Energy Information Administration, Annual Energy Review, online.
In setting their expectations, people in the marketplace must anticipate not only future demand but future supply as well. Demand in future periods could fall short of expectations if new technologies produce goods and services using less of a natural resource. That has clearly happened. The quantity of energy—which is generally produced using exhaustible fossil fuels—used to produce a unit of output has fallen by more than half in the last three decades. At the same time, rising income levels around the world, particularly in China and India over the last two decades, have led to increased demand for energy. Supply increases when previously unknown deposits of natural resources are discovered and when technologies are developed to extract and refine resources more cheaply. Figure 13.10 "An Explanation for Falling Resource Prices" shows that discoveries that reduce the demand below expectations and increase the supply of natural resources can push prices down in a way that people in previous periods might not have anticipated. This scenario explains the fall in some prices of natural resources in the latter part of the twentieth century. To explain the recent rise in exhaustible natural resources prices, we can say that the factors contributing to increased demand for energy and some other exhaustible natural resources were outweighing the factors contributing to increased supply, resulting in higher prices—a scenario opposite to what is shown in Figure 13.10 "An Explanation for Falling Resource Prices". This upward trend began to reverse itself again in late 2008, as the world economies began to slump.
Figure 13.10 An Explanation for Falling Resource Prices
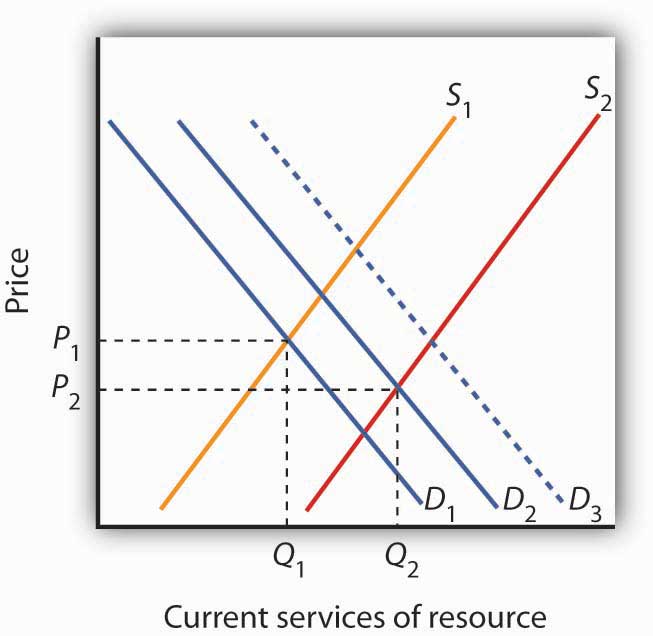
Demand for resources has increased over time from D1 to D2, but this shift in demand is less than it would have been (D3) if technologies for producing goods and services using less resource per unit of output had not been developed. Supply of resources has increased from S1 to S2 as a result of the discovery of deposits of natural resources and/or development of new technologies for extracting and refining resources. As a result, the prices of many natural resources have fallen.
Will we ever run out of exhaustible natural resources? Past experience suggests that we will not. If no new technologies or discoveries that reduce demand or increase supply occur, then resource prices will rise. As they rise, consumers of these resources will demand lower quantities of these resources. Eventually, the price of a particular resource could rise so high that the quantity demanded would fall to zero. At that point, no more of the resource would be used. There would still be some of the resource in the earth—it simply would not be practical to use more of it. The market simply will not allow us to “run out” of exhaustible natural resources.
Renewable Natural Resources
As is the case with exhaustible natural resources, our consumption of the services of renewable natural resources can affect future generations. Unlike exhaustible resources, however, renewable resources can be consumed in a way that does not diminish their stocks.
Carrying Capacity and Future Generations
The quantity of a renewable natural resource that can be consumed in any period without reducing the stock of the resource available in the next period is its carrying capacityThe quantity of a renewable natural resource that can be consumed in any period without reducing the stock of the resource available in the next period.. Suppose, for example, that a school of 10 million fish increases by 1 million fish each year. The carrying capacity of the school is therefore 1 million fish per year—the harvest of 1 million fish each year will leave the size of the population unchanged. Harvests that exceed a resource’s carrying capacity reduce the stock of the resource; harvests that fall short of it increase that stock.
As is the case with exhaustible natural resources, future generations have a stake in current consumption of a renewable resource. Figure 13.11 "Future Generations and Renewable Resources" shows the efficient level of consumption of such a resource. Suppose Qcap is the carrying capacity of a particular resource and S1 is the supply curve that reflects the current marginal cost of utilizing the resource, including costs for the labor and capital required to make its services available, given the interest rate and expected future demand. The efficient level of consumption in the current period is found at point E, at the intersection of the current period’s demand and supply curves. Notice that in the case shown, current consumption at Q1 is less than the carrying capacity of the resource. A larger stock of this resource will be available in subsequent periods than is available now.
Figure 13.11 Future Generations and Renewable Resources
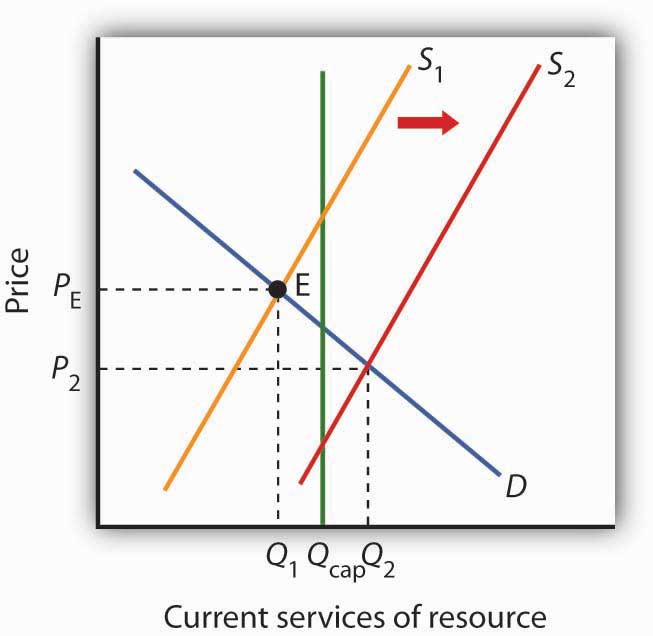
The efficient quantity of services to consume is determined by the intersection S1 and the demand curve D. This intersection occurs at point E at a quantity of Q1. This lies below the carrying capacity Qcap. An increase in interest rates, however, shifts the supply curve to S2. The efficient level of current consumption rises to Q2, which now exceeds the carrying capacity of the resource.
Now suppose interest rates increase. As with nonrenewable resources, higher interest rates shift the supply curve to the right, as shown by S2. The result is an increase in current consumption to Q2. Now consumption exceeds the carrying capacity, and the stock of the resource available to future generations will be reduced. While this solution may be efficient, the resource will not be sustained over time at current levels.
If society is concerned about a reduction in the amount of the resource available in the future, further steps may be required to preserve it. For example, if trees are being cut down faster than they are being replenished in a particular location, such as the Amazon in Brazil, a desire to maintain biological diversity might lead to conservation efforts.
Economic Rent and The Market for Land
We turn finally to the case of land that is used solely for the space it affords for other activities—parks, buildings, golf courses, and so forth. We shall assume that the carrying capacity of such land equals its quantity.
Figure 13.12 The Market for Land
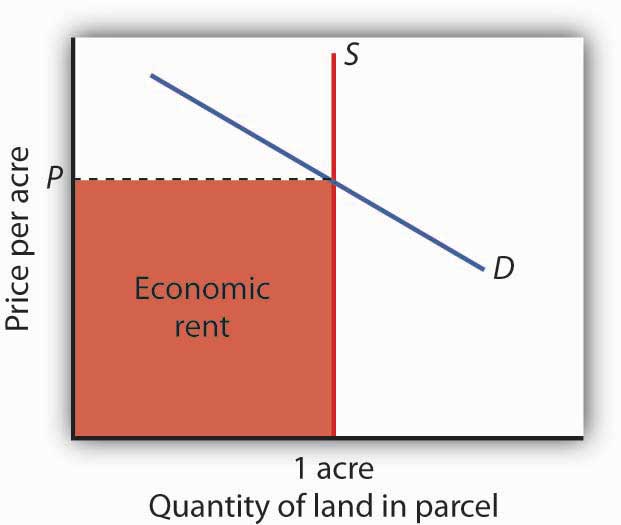
The price of a one-acre parcel of land is determined by the intersection of a vertical supply curve and the demand curve for the parcel. The sum paid for the parcel, shown by the shaded area, is economic rent.
The supply of land is a vertical line. The quantity of land in a particular location is fixed. Suppose, for example, that the price of a one-acre parcel of land is zero. At a price of zero, there is still one acre of land; quantity is unaffected by price. If the price were to rise, there would still be only one acre in the parcel. That means that the price of the parcel exceeds the minimum price—zero—at which the land would be available. The amount by which any price exceeds the minimum price necessary to make a resource available is called economic rentThe amount by which any price exceeds the minimum price necessary to make a resource available..
The concept of economic rent can be applied to any factor of production that is in fixed supply above a certain price. In this sense, much of the salary received by Brad Pitt constitutes economic rent. At a low enough salary, he might choose to leave the entertainment industry. How low would depend on what he could earn in a best alternative occupation. If he earns $30 million per year now but could earn $100,000 in a best alternative occupation, then $29.9 million of his salary is economic rent. Most of his current earnings are in the form of economic rent, because his salary substantially exceeds the minimum price necessary to keep him supplying his resources to current purposes.
Key Takeaways
- Natural resources are either exhaustible or renewable.
- The demand for the services of a natural resource in any period is given by the marginal revenue product of those services.
- Owners of natural resources have an incentive to take into account the current price, the expected future demand for them, and the interest rate when making choices about resource supply.
- The services of a renewable natural resource may be consumed at levels that are below or greater than the carrying capacity of the resource.
- The payment for a resource above the minimum price necessary to make the resource available is economic rent.
Try It!
You have just been given an oil well in Texas by Aunt Carmen. The current price of oil is $45 per barrel, and it is estimated that your oil deposit contains about 10,000 barrels of oil. For simplicity, assume that it does not cost anything to extract the oil and get it to market and that you must decide whether to empty the well now or wait until next year. Suppose the interest rate is 10% and that you expect that the price of oil next year will rise to $54 per barrel. What should you do? Would your decision change if the choice were to empty the well now or in two years?
Case in Point: World Oil Dilemma
Figure 13.13
© 2010 Jupiterimages Corporation
The world is going to need a great deal more oil. Perhaps soon.
The International Energy Agency, regarded as one of the world’s most reliable in assessing the global energy market, says that world oil production must increase from 87 million barrels per day in 2008 to 99 million barrels per day by 2015. Looking farther ahead, the situation gets scarier. Jad Mouawad reported in The New York Times that the number of cars and trucks in the world is expected to double—to 2 billion—in 30 years. The number of passenger jetliners in the world will double in 20 years. The IEA says that the demand for oil will increase by 35% by 2030. Meeting that demand would, according to the Times, require pumping an additional 11 billion barrels of oil each year—an increase of 13%.
Certainly some in Saudi Arabia, which holds a quarter of the world’s oil reserves, were sure it would be capable of meeting the world’s demand for oil, at least in the short term. In the summer of 2005, Peter Maass of The New York Times reported that Saudi Arabia’s oil minister, Ali al-Naimi, gave an upbeat report in Washington, D.C. to a group of world oil officials. With oil prices then around $55 a barrel, he said, “I want to assure you here today that Saudi Arabia’s reserves are plentiful, and we stand ready to increase output as the market dictates.” The minister may well have been speaking in earnest. But, according to the U. S. Energy Information Administration, Saudi Arabia’s oil production was 9.6 million barrels per day in 2005. It fell to 8.7 million barrels per day in 2006 and to 8.7 million barrels per day in 2007. The agency reports that world output also fell in each of those years. World oil prices soared to $147 per barrel in June of 2008. What happened?
Much of the explanation for the reduction in Saudi Arabia’s output in 2006 and 2007 can be found in one field. More than half of the country’s oil production comes from the Ghawar field, the most productive oil field in the world. Ghawar was discovered in 1948 and has provided the bulk of Saudi Arabia’s oil. It has given the kingdom and the world more than 5 million barrels of oil per day for well over 50 years. It is, however, beginning to lose pressure. To continue getting oil from it, the Saudis have begun injecting the field with seawater. That creates new pressure and allows continued, albeit somewhat reduced, production. Falling production at Ghawar has been at the heart of Saudi Arabia’s declining output.
The Saudi’s next big hope is an area known as the Khurais complex. An area about half the size of Connecticut, the Saudis are counting on Khurais to produce 1.2 million barrels per day beginning in 2009. If it does, it will be the world’s fourth largest oil field, behind Ghawar and fields in Mexico and Kuwait. Khurais, however, is no Ghawar. Not only is its expected yield much smaller, but it is going to be far more difficult to exploit. Khurais has no pressure of its own. To extract any oil from it, the Saudis will have to pump a massive amount of seawater from the Persian Gulf, which is 120 miles from Khurais. Injecting the water involves an extraordinary complex of pipes, filters, and more than 100 injection wells for the seawater. The whole project will cost a total of $15 billion. The Saudis told The Wall Street Journal that the development of the Khurais complex is the biggest industrial project underway in the world. The Saudis have used seismic technology to take more than 2.8 million 3-dimensional pictures of the deposit, trying to gain as complete an understanding of what lies beneath the surface as possible. The massive injection of seawater is risky. Done incorrectly, the introduction of the seawater could make the oil unusable.
Khurais illustrates a fundamental problem that the world faces as it contemplates its energy future. The field requires massive investment for an extraordinarily uncertain outcome, one that will only increase Saudi capacity from about 11.3 million barrels per day to 12.5.
Sadad al-Husseini, who until 2004 was the second in command at Aramco and is now a private energy consultant, doubts that Saudi Arabia will be able to achieve even that increase in output. He says that is true of the world in general, that the globe has already reached the maximum production it will ever achieve—the so-called “peak production” theory. What we face, he told The Wall Street Journal in 2008, is a grim future of depleting oil resources and rising prices.
Rising oil prices, of course, lead to greater conservation efforts, and the economic slump that took hold in the latter part of 2008 has led to a sharp reversal in oil prices. But, if “peak production” theory is valid, lower oil prices will not persist after world growth returns to normal. This idea is certainly one to consider as we watch the path of oil prices over the next few years.
Sources: Peter Maass, “The Breaking Point,” The New York Times Magazine Online, August 21, 2005; Jad Mouawad, “The Big Thirst,” The New York Times Online, April 20, 2008; US. Energy Information Administration, International Controlling a Monthly, May 2008, Table 4.1c; Neil King, Jr. “Saudis Face Hurdles in New Oil Drilling,” The Wall Street Journal, April 22, 2008, A1, Neil King, Jr. “Global Oil-Supply Worries Fuel Debate in Saudi Arabia,” The Wall Street Journal, June 27, 2008, A1.
Answer to Try It! Problem
Since you expect oil prices to rise ($54 − 45)/$45 = 20% and the interest rate is only 10%, you would be better off waiting a year before emptying the well. Another way of seeing this is to compute the present value of the oil a year from now:
Po = ($54 * 10,000)/(1 + 0.10)1 = $490,909.09Since $490,909 is greater than the $45*10,000 = $450,000 you could earn by emptying the well now, the present value calculation shows the rewards of waiting a year.
If the choice is to empty the well now or in 2 years, however, you would be better off emptying it now, since the present value is only $446,280.99:
Po = ($54 * 10,000)/(1 + 0.10)2 = $446,280.99