This is “Growth Strategy”, chapter 6 from the book Competitive Strategies for Growth (v. 1.0). For details on it (including licensing), click here.
For more information on the source of this book, or why it is available for free, please see the project's home page. You can browse or download additional books there. To download a .zip file containing this book to use offline, simply click here.


Chapter 6 Growth Strategy
6.1 Introduction
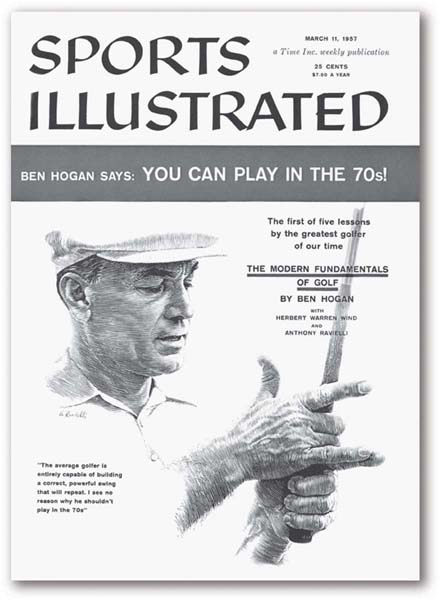
We have used the phrase “breakdown” value several times so far. The term breaking down has become a common phrase in the English language in reference to dividing some whole up into component parts. In sports, one of the most impressive feats in the history of breaking down complexity is Ben Hogan’s classic Five Lessons: The Modern Fundamentals of Golf.Hogan (1957). Mr. Hogan is one of the greatest champions in the history of the game, with 64 PGA tour wins between 1938 and 1959. These included nine major tournament titles, six of which came after a horrific 1949 accident in which the car he was driving collided head on with a Greyhound bus. In Five Lessons, he provides the first in-depth accounting of the golf swing broken down into four core elements: the grip, stance and posture, first part of the swing (backswing), and the second part of the swing (downswing). This paperback has itself turned into a modern classic, still in print (available on Amazon!) and responsible for the swings of some of the most accomplished players today, including Tiger Woods.
Those inexperienced with golf often wonder how this seemingly simple game can be worthy of such devotion and study. They are incredulous to learn, for example, that Mr. Hogan’s book has an entire chapter on the grip—that is, simply how to hold the club! Figure 6.1 "Ben Hogan on the Cover of Sports Illustrated" shows the striking ink drawings by Anthony Ravielli on the cover of Sports Illustrated, perfect in detail as Mr. Hogan demanded. Hogan’s devotion to studying different approaches to gripping the club has him describing grip aesthetics in words rich with emotion: “For myself and other serious golfers there is an undeniable beauty in the way a fine player sets his hands on the club.” Such admiration and attention to subtle nuance is the result of deep study, and it leads to explanations of the grip of such a technical nature as to leave any but the most dedicated student of golf scratching heads:
Figure 6.1 Ben Hogan on the Cover of Sports Illustrated
When a golfer has completed his left-hand grip, the V formed by the thumb and forefinger should point to his right eye. The total pressure of all the fingers should not be any stronger (and may even be a little less strong) than the pressure exerted by just the forefinger and the palm pad in the preparatory guiding action. In the completed I grip, the main pressure points are the last three fingers, with the forefinger and the palm pad adding assisting pressure. (Hogan, 1957)
Yet Mr. Hogan is also clear in identifying the important outcomes of developing this understanding, which ultimately connects the grip with other parts of the swing:
Keeping pressure on the shaft with the palm pad does three things: it strengthens the left arm throughout the swing; at the top of the backswing, the pressure from this pad prevents the club from slipping from the player’s grasp; and it acts as a firm reinforcement at impact. (Hogan, 1957)
The grip elements represent one piece of the puzzle. But Mr. Hogan has a deep, almost stunning insight about the outcome of grounding your golf swing in solid fundamentals throughout. Ultimately, careful attention to the grip helps in executing other fundamental elements of the swing and also dramatically improves the golfer’s ability to compete:
Frequently, you know, what looks like a fairly good golf swing falls apart in competition…the harsh light of competition reveals that a swing is only superficially correct…It can’t stand up day after day. A correct swing will. In fact, the greater the pressure you put on it, the better your swing should function, if it is honestly sound. (Hogan, 1957)
While we would overly flatter ourselves to suggest that we could replicate the level of depth and expertise in Mr. Hogan’s work on the golf swing in the study of growth strategy, our intent is the same. The 3-Circle model is about creating honestly sound strategy that will hold up under competition. We do that by breaking down value, seeking to deeply understand the component parts and how to work with them and then assembling them back together in an integrative strategy. The primary insight is that each individual category of value can spawn unique ideas for growth through building the firm’s ability to produce and communicate value that really matters to customers. This is what we will be breaking down in this chapter.
6.2 Value and Positioning
There are a number of prescriptions for growth that emerge from the 3-Circle model. However, growth strategy should not be developed independent of the firm’s overall positioning strategy. At the end of Chapter 5 "Sorting Value", the value map was presented as a means of thinking through where your offering lies in a value space, defined by price on one axis and perceived benefits on the other. Growth strategy ideas that each seek to improve value for customers should form an integrative whole to the extent possible, and should be consistent with the overall positioning and meaning for your organization or brand. As you think through growth strategies, it is important to do so with the backdrop of your goals for your overall position as a choice alternative for the customer. The overall goal of the analysis is to improve the value proposition for the customer relative to competitors to increase the probability that the customer will choose your offering.
Overall Positioning Strategy
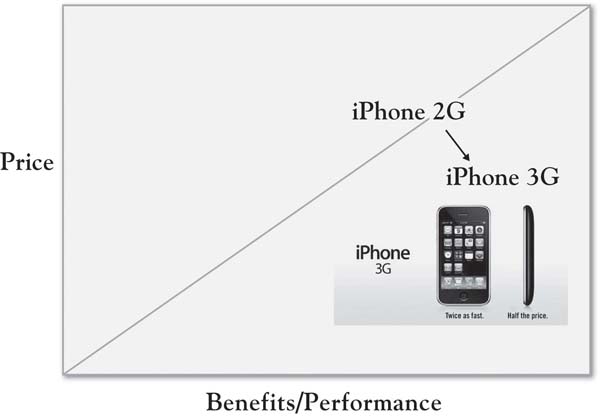
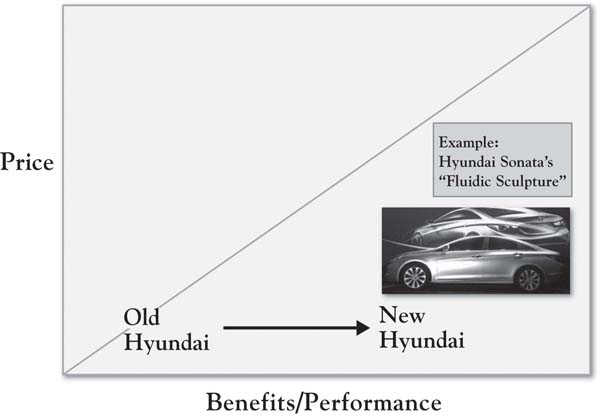
We have replicated the value map from Chapter 5 "Sorting Value" into Figure 6.2 "Directional Moves on the Value Map", which illustrates “directional” moves from a center location. As noted in Chapter 5 "Sorting Value", a firm improves its value proposition by either adding or improving benefits or lowering the customer’s costs. The degree to which adding or improving benefits (moving east on the value map) increases sales depends on whether those benefits are important to customers. The degree to which changing customer costs or price will affect sales depends on customer price sensitivity. Lowering customer costs represents a southerly move, while raising customer costs is a move toward the north on the map. However, simultaneous changes in both numerator and denominator can occur—then, customer response depends on the combined impact on value. So a firm might add benefits and raise price, which would move it northeast on the 45-degree line on the map, as when Ford makes a hybrid version of its Escape SUV and charges $9,000 more. Alternatively, a southwest move would involve reducing benefits compared to an existing position and lowering price, illustrated by a cluster of emergent cell phone and cell phone service providers like Net10 who sell simple cell phones on prepaid plans at prices substantially lower than the standard national carriers. Figure 6.3 "Repositioning the iPhone 3GS: “Twice as Fast. Half the Price.”" illustrates a unique strategy by Apple, moving the iPhone southeast—enhancing both benefits (twice as fast) and cost (half the price). We will see that this overall value positioning is difficult but increasingly evident, reflected in Kim and Mauborgne’s work on value innovation and blue ocean strategy.Kim and Mauborgne (2005). In sum, while we think of individual changes as additions or deletions of attributes or benefits, such changes, in fact, (a) may have multiple elements, and (b) will eventually be translated in the minds of customers to some sense of overall value for the money. The degree to which such changes contribute to improved profitability is a function of both changes in sales revenue and changes in cost.
Figure 6.2 Directional Moves on the Value Map
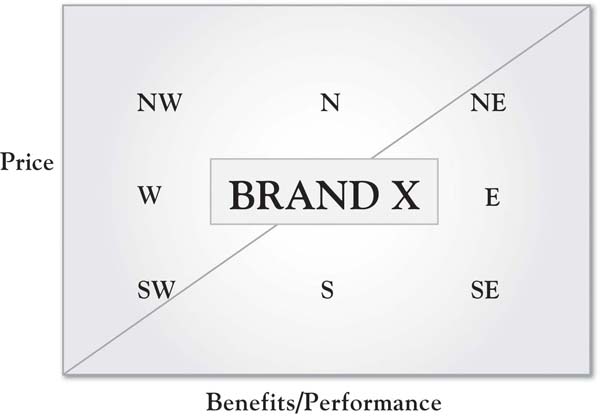
Figure 6.3 Repositioning the iPhone 3GS: “Twice as Fast. Half the Price.”
6.3 Growth Implications for Value Categories
In alphabetical order, here is a generally comprehensive list of the key growth strategy implications from the seven value categories in the 3-Circle framework:
- Area A: Defend and build. The chief goal is to enhance and enlarge Area A relative to Area C by building distinctive attributes and benefits for which we have a unique capability or identity, in a manner focused on target customers.
- Area B: Maintain and defend the foundation. There are core attributes and benefits (table stakes) that you must deliver as effectively as competitors do to even be in the game.
- Area C: Shore up your value (i.e., neutralize competitors’ advantage) where it is cost-effective and strategy-consistent to do so. Certain deficits in Area C may provide an opportunity to improve our value proposition by neutralizing and perhaps exceeding the competitor’s advantage. Alternatively, live and let live.
- Areas D, E: Correct negative value, eliminate or reduce unwanted attributes, better communicate, or find new capabilities. These are areas with multiple dimensions for which there are a variety of growth strategy directions.
- Area F: Improve upon and exploit the competitor’s unique deficiency. This is a strategic decision, but it holds the possibility of improving your offering’s value position by helping customers discover more about what is legitimately wrong with the competitor’s offering.
- Area G: Continually seek unmet needs. There are ways in which the white space can be explored in a structured and disciplined manner. The exploration provides a means of uncovering potentially new sources of value that can substantially improve customers’ connection with the firm’s offering.
Here, we will cycle through these ideas, expanding upon them and introducing a number of illustrations. An important point here is that there is a logical sequence or order with which one should evaluate growth opportunities. We are going to suggest a series of strategic growth options—questions that will prompt a concrete look at a number of potential ideas for growing the value customers receive that will enhance and strengthen the firm’s overall position. We always need to keep in mind the simple value formula and the goal: to enhance that overall value by recognizing that the firm might improve either numerator or denominator:
We will walk through each of the imperatives and strategic growth opportunities, one at a time. We will occasionally refer to “numerator” ideas, which are ideas to build and enhance benefits. “Denominator” ideas are those related to reducing customer costs—either direct costs or effort costs.
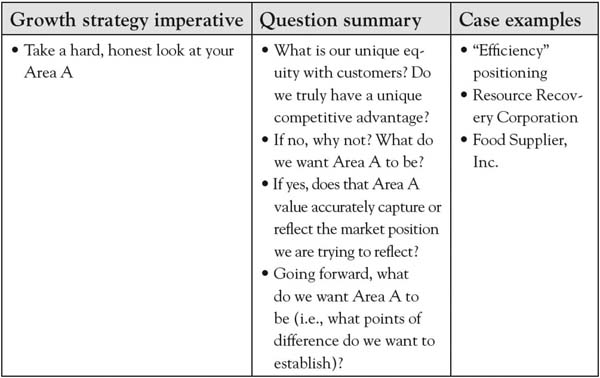
6.4 Overall Positioning: First, Take a Hard, Honest Look at Your Area A
The following questions are among the most essential that one can ask about the business that can be answered by the customer value analysis you have completed:
- What is our unique equity with customers? Do we truly have a unique competitive advantage?
- If no, why not?
- If yes, does that Area A value accurately capture the market position we are trying to reflect?
- Going forward, what do we want Area A to be—that is, what points of difference do we want to establish?
To illustrate a common finding, consider a manufacturer who has, for the past several years, touted its efficiency as its primary point of difference. The firm’s management has been consistent in communicating this priority both internally (mission statement, coffee cups, posters on the wall) and externally with distributors and customers, proud of the fact that it is the “most efficient in the industry.” Then, in a 3-Circle growth project, some leaders in the firm discover the surprising insight that customers only care about the firm’s efficiency if they see some benefit from it. In some ways, the firm’s promotion of its efficiency is almost resented by some customers who do not believe they see anything being passed down in the way of lower costs or greater efficiency for them. Recall similar cases in this book (e.g., Resource Recovery Corporation, Food Supplier, Inc.) in which executives discovered that their Area A was not nearly as large and distinctive as they had envisioned. So the first step in plotting growth is to get a clear understanding of your current Area A, being open to the possibility that customers may not view you as you think they do. As noted in Chapter 5 "Sorting Value", an important element of this assessment is identifying where you currently reside in consumers’ minds on the value map. Figure 6.4 "First Priority in Growth Strategy: Assess Your Area A" summarizes this first priority.
Figure 6.4 First Priority in Growth Strategy: Assess Your Area A
6.5 Exploring Five Growth Imperatives
The strategic positioning assessment is critical in highlighting strategic priorities for the company. In addition, there are some tactical insights that emerge that can be fixed in a straightforward way. The fundamental growth imperatives can be summarized as follows:
- Correct obvious, critical deficiencies (Areas E, D)
- Solidify Area B
- Neutralize Area C
- Reduce and eliminate, or reinvigorate, current Areas E and D dimensions
- Build and defend Area A
The goal of 3-Circle analysis is to leverage the insight from the initial, structured analysis of customer feedback into a preliminary set of ideas or brainstorms about growth. We will provide a systematic walk-through of these ideas. Figure 6.5 "Growth Imperatives 1 Through 4" summarizes the analysis of the first four growth imperatives.
Figure 6.5 Growth Imperatives 1 Through 4
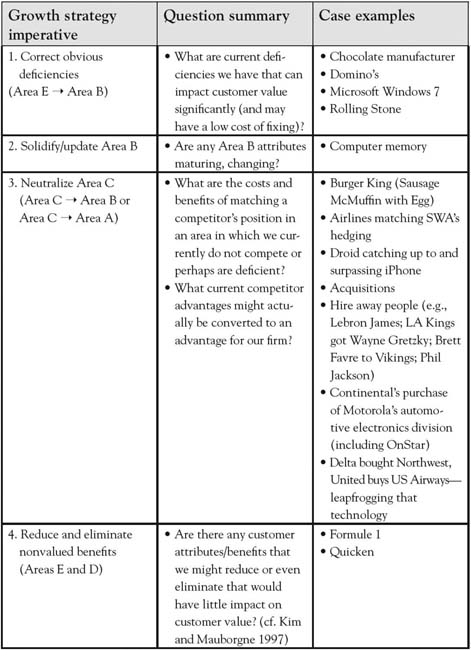
Growth Imperative 1: Correct Deficiencies (Areas E and D)
As we emphasize throughout the book, customer value is enhanced (by way of the numerator of the value ratio) by ensuring that the product substantively delivers upon and exceeds expectations. At times, there are very fundamental issues that emerge in research and analysis that suggest obvious change—for example, the proverbial low-hanging fruit. Note such insights occur both for substantive changes in quality and basic issues on which our current superiority is not being effectively communicated. A few examples include substantively changing benefits and clarifying customer perception.
Substantively Changing Benefits
In Michael Porter’s work on competitive strategy and the value chain, he notes an example of a bulk chocolate manufacturer who sells its finished product to a confectionary producer in bulk bars.Porter (1985). Essentially, a study of the customer’s inbound logistics and operations (i.e., the real processes and needs) led to the discovery that the chocolate manufacturer was wasting time hardening and packaging the chocolate, when the confectionary producer had to remelt it upon arrival. Each manufacturer saved time and money when the chocolate manufacturer began delivering the product in liquid form. This illustrates a reality in most firm-customer relationships—there very often exist opportunities to improve value (sometimes for both parties) that are surprisingly related to basic blocking and tackling rather than significant innovation. Domino’s experienced increases in revenue and operating profit of 18% and 28%, respectively, in the first quarter of 2010 after communicating in its advertising that it was responding to consumer dissatisfaction with its pizza recipe with an improved product.Solsman and Ziobro (2010, May 4); Bryson (2010). Similarly, Microsoft’s notorious reputation of a controlling, complex, and unreliable operating system was softened by the introduction of Windows 7, which was developed with advertising in which users explained how the new operating system integrated their ideas for improvement.“10 Things Microsoft Did” (2010, March 4). Finally, Hyundai is an excellent example of a firm once characterized by significant disequity that has substantially improved its position. In a difficult 2009 market for the auto industry, Hyundai increased sales over 6% in the United States, improving market share to 4.3% from 3.0% in 2008 with substantive changes in car design, warranty, and platform integration to improve cycle time.Ohnsman and Cha (2009, December 28); Saad and Hill (2010, February 25). Figure 6.6 "Hyundai Sonata’s “Fluidic Sculpture” Value Map Repositioning" illustrates Hyundai’s desired shift on the industry’s value map, particularly with a focus on new, more elegant car designs.
Clarifying Customer Perceptions
A significant insight in 3-Circle growth analysis is that items that emerge in Area E that are misperceptions can be corrected through communications. We would not claim to be the first to discover certain types of misperception in the marketplace that can be corrected. A clever example of this is Rolling Stone magazine’s classic “perception vs. reality” ad campaign back in the 1980s and 1990s, which sought to correct major advertisers’ misperception that the magazine’s readership was composed primarily of hippies. The ads were two full pages—a left-hand page titled “perception” and a right-hand page titled “reality,” each presenting insights about previous vs. new readers, respectively. One of the best-known versions of the ad had a left-hand page showing a peace sign, and a right-hand page showing a Mercedes-Benz hood ornament. Similarly, SC Johnson currently fends off the longtime perception for its Pledge furniture cleaner product that it leaves wax build-up by pointing out that the product does not even have wax in it! (The tag line is “No wax. No build-up.”) Surprises in customer perceptions are a very common outcome in 3-Circle growth strategy projects, producing significant growth opportunities. We will detail a pharmaceutical case in Chapter 9 "Summary: Growth Strategy in 10 Steps" in which the firm discovered and responded to important physician misperceptions about their drug’s outcomes and managed care system.
Figure 6.6 Hyundai Sonata’s “Fluidic Sculpture” Value Map Repositioning
Growth Imperative 2: Solidify and Update Area B (Points of Parity)
Points of parity are those dimensions of value that your offering is expected to have. Laptop computers have at minimum 3 or 4 gigabytes of hard drive space and 32 megabytes of RAM. Those basic requirements used to be a lot lower. The Wikipedia entry for Moore’s Law (which describes the exponential growth of digital device capabilities) indicates that hard drive memory capacity—a standard feature of personal computers—grew from 0.01 gigabytes in 1985 to 1,000 gigabytes in 2010.http://en.wikipedia.org/wiki/Moore’s_law The issue here is that even points of parity evolve and move. Returning to the six lessons about attributes from Chapter 4 "The Meaning of Value", there is a dynamic pattern to value creation in markets that begins with a firm’s incentive to try something new—a new value-added feature like a camera on a cell phone, for example. Once the market finds value in that feature, it becomes a point of parity, that is, a basic expectation of the market. But it is important for the firm to keep an eye on that, as some firms may continue to improve it, for example, by improving picture quality or allowing for more video capacity or easier sharing. This is not to suggest that every effort to improve points of parity should be imitated without consideration of the value that customers obtain from it. Instead, the more general point is to take a systematic look at Area B attributes to ensure that your offering is not slipping behind on these table stakes.
Growth Imperative 3: Neutralize Area C (C→B or C→A)
In the normal course of competition in the free market, one of the most fundamental principles is that successful offerings get imitated unless they are protected legally or by unique resources, capabilities, and assets. McDonald’s has experienced success in mimicking both the higher quality coffee and, to some extent, the consumption experience of Starbucks stores, at substantially lower prices. McDonald’s marketing communications program includes a billboard with huge lettering saying “four bucks is dumb,” with a parenthetical remark below (“now serving espresso”) and the golden arches logo in the lower right. Ironically, a McDonald’s competitor has similarly pursued an imitation strategy so extreme that they depict a brazen Burger King (with the smiling plastic mask) breaking into McDonald’s corporate headquarters to steal the secret plans for the Sausage McMuffin. Burger King wants you to know that you get the exact same product, with one difference: a price of $1.00 rather than $1.99. Each of these actions would be seeking to directly position south of the competitor on the value map, essentially with a denominator (price) strategy. We might think of three strategies related to neutralizing Area C:
- Equal value: Match the competitors’ benefits simply to neutralize them as a unique advantage. Strategies that seek to neutralize Area C may be such strategies in which the firm seeks to turn the competitor’s Area C attributes (their points of difference) into Area B attributes (points of parity). For example, Verizon has been very aggressive about promoting the superiority of its mobile phone coverage, with a campaign built around the strength of its coverage map relative to AT&T’s. In a fierce advertising battle, AT&T responded in kind for a time, seeking to make coverage an Area B item. In addition, AT&T spent $2 billion improving its network in 2010. There was some measure of success in the campaign, as AT&T picked up new users, although it appears that those gains came from smaller carriers like Sprint and T-Mobile rather than Verizon.Fredrix (2010). Note that while the strategy of equalizing value on particular attributes does not create a superior advantage—it removes a reason for not choosing a brand, which can have a powerful effect on customer choices.
- Better value. A firm may instead seek to leapfrog a competitor on value. One way of doing this is to match the competitor’s Area C benefits, but at a lower price. This is illustrated by Burger King’s blatant, humorous effort to literally duplicate the McDonald’s breakfast sandwich, but to offer it at a significantly lower price (again, a due south positioning strategy on the value map). Alternatively, the firm might neutralize the competitor’s advantage by developing superior benefits at the same price (a due east strategy). Eastern strategies would tend to involve the addition of value-added products or services that competitors do not, or cannot, offer. Examples of this would include the Infiniti with the “Around View Monitor” with cameras on all sides of the car, the Motorola-Verizon Droid surpassing the Apple-AT&T iPhone’s features at a similar price, the computer manufacturer with a superior warranty, or the consumer-products firm that adds 30% more product volume in the package than the competitor but at the same price.
- Live and let live. While we may see prospects for improving customer value and choice in neutralizing the competitor’s Area C, the larger assessment, in fact, should be whether or not the benefits of such a strategy exceed the costs for the firm. There may be Area C advantages that naturally belong to the competitor and would be too costly to try to match. For example, recall in Chapter 2 "Introduction to 3-Circle Analysis" that while standardized testing was a cost-feasible addition for Glenview New Church School (and a competitive must-have), it would be very difficult and costly for Glenview New Church to attempt to imitate the public school’s broad curriculum (beyond the core). It is important that a cost-benefit analysis be applied in a disciplined way to match or imitate a competitor’s advantages. Criteria for evaluating the desirability of such imitation would include not only investment and likely return financially but also the fit of the move with current positioning and strategy and the likelihood of provoking competitive reaction. For the market-share leader, a move to imitate a smaller underdog’s actions may simply bring more attention to the underdog.
Growth Imperative 4: Reduce or Eliminate Nonvalued Benefits
Kim and Mauborgne’s (2005) empirical research on value innovation and blue ocean strategy revealed an important element of strategy that had not been discussed previously. They found firms who were able to find growth, even in highly competitive industries, by reducing or even eliminating attributes or benefits that customers valued less, and by investing in significantly improving the most important values. An example is adapted in Figure 6.7 "Quicken’s Innovation: Reducing Complexity", depicting the strategy for Quicken’s personal finance software, which was introduced into an existing market of 42 powerful, but very complex and difficult-to-use, software products. Scott Cook, founder of Intuit, considered those products but also had in mind positioning against the simplest of all financial management products—the pencil! As Figure 6.7 "Quicken’s Innovation: Reducing Complexity" shows, Quicken’s value was in its ease of use but equivalent power relative to the software packages of the day, yet it maintained the speed and accuracy advantages over the pencil. The company simplified the product by stripping out many complex features and using straightforward language. The simpler product also costs less, illustrating the core principle in Kim and Mauborgne’s (2005) concept of “value innovation”—that companies create significant gains in value by focusing on building a few benefits that customers value and eliminating or reducing those that are less valued. The elimination of some benefits can lower costs, leading to lower prices as well. Figure 6.7 "Quicken’s Innovation: Reducing Complexity" illustrates the same Quicken positioning strategy as captured in a value map.
Growth Imperative 5: Build and Defend Area A
The 3-Circle model provides a simple way to explain the essence of competitive strategy: the goal is to build Area A relative to Area C. Seeking to shrink Area C may be part of that strategy. But building Area A is a code word for the raison d’être for any business—what truly unique value do you bring into the world? Having analyzed customer value and categorized the value using the seven categories in the framework, you will find a variety of ways to think about how to build the distinctive value in Area A. As captured in Figure 6.8 "Growth Imperative 5: Building Area A", there are a number of areas in the 3-Circle model that provide sources of value on which Area A might be built.
Figure 6.7 Quicken’s Innovation: Reducing Complexity
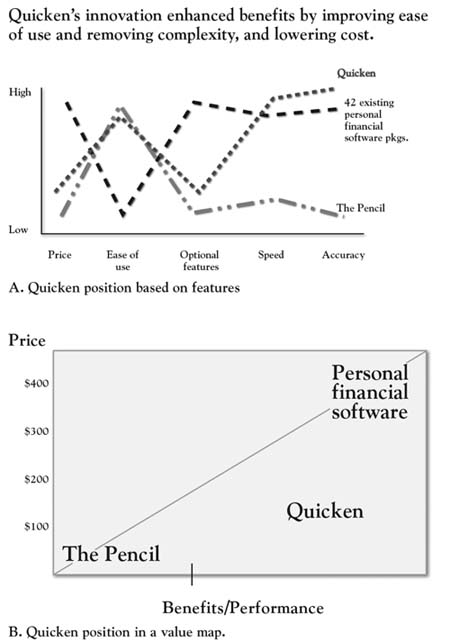
Source: Adapted from “Creating New Market Space,” by W. C. Kim and R. Mauborgne, 1999, Harvard Business Review (January–February), 83–93.
Figure 6.8 Growth Imperative 5: Building Area A
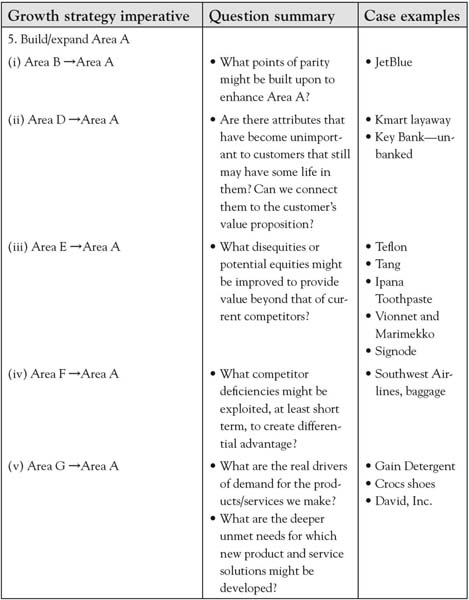
Ratchet Up Points of Parity (Area B → Area A)
JetBlue was founded on a unique passenger experience. Building upon the original model of Southwest Airlines of a regional hub-to-hub airline with an emphasis on low cost, JetBlue captured significant unique dimensions of value by taking a standard flying experience and enhancing the comfort and excitement of the passenger experience. In one of its early advertisements—a humorous “mockumentary”—JetBlue employees explain, for a variety of basic services, that when customers ask them to do something (e.g., seat them together with another passenger), they actually do it. So when a passenger asked for some headphones, “I hooked him up,” notes a flight attendant. This is a parody on the notion that many existing airlines often fail to meet the most basic of expected services. Yet JetBlue’s distinctive value is in taking a commoditized in-flight experience and significantly improving it. The firm seeks a very passenger-oriented in-flight experience from its attendants, and has both comfortable leather seats and entertainment systems for every passenger on every flight. This is a classic illustration of taking standard attributes in the overall value proposition and pushing them to new value-enhancing levels in ways that require significant investment. For such a strategy to work, the attributes or benefits must be (a) fundamentally important to customers, and (b) credibly differentiable among competitors. In certain circumstances, there may be opportunities for differentiation because an industry (both firms and customers) has become so accustomed to its points of parity that all take certain levels of value as given. So when Wal-Mart takes its standard in-store layout that has been virtually the same (and similar to other mass-merchant rivals) for decades and enhances colors, layout, and fashion orientation, the result is a remarkable contrast that sharpens the value customers obtain from its low-price Area A. In sum, raising the levels of Area B attributes to enhance Area A is often a process of exploring the customer’s experience around existing attributes and then uncovering how to build a new experience.
Find Value in Old Ideas That Worked at One Time (Area D → Area A)
If we classify an attribute or benefit in Area D, it means that this dimension of value is or was jointly produced by each firm but that it is outside the customer’s circle. It is possible that there still exists value in such retired attributes. Determining whether there might be value there, though, requires some skill in discrimination. There are examples of bringing back values that have been successful, as in car companies bringing back vintage cars or introducing classic design elements in contemporary cars. We might think of a category of value that may have seemed to go out of style but, in fact, is classic enough to have an appeal to certain consumers in every generation—for example, the simplicity and elegance of Frank Lloyd Wright architecture. Kmart created a point of difference by bringing back a layaway capability when difficult economic times set in back in 2008, and it got a great deal of positive press as a result. In a 2008 Wall Street Journal article, Mark Snyder, Kmart’s chief marketing officer, noted, “While not sexy, layaway became the big idea at Kmart these holidays.”Mohammed (2010, March 2). Similarly, in large banks, check cashing has not been a highly demanded service, as consumers typically deposit checks and electronic deposits have become increasingly common. As competition for middle-class and wealthy consumers has heated up, some banks have looked for business elsewhere, discovering a very large segment of “unbanked” or “underbanked” consumers who do not have relationships with banks, yet spend over $11 billion per year at financial institutions that cash checks.Carrns (2007, March). In response, Key Bank has experimented with check-cashing services in a variety of retail bank branches, with specific technology for identifying customers and providing other services for a cash economy in which many customers engage.
Find Hidden Equity in Area E (Area E → Area A)
As noted earlier, there are multiple interpretations of Area E. The first we addressed previously: There are some dimensions of value that may be important and on which we are not meeting expectations. The strategy for such dimensions is to correct obvious problems to negate the disadvantage (a high priority). But the other, more subtle element of Area E (same with D and F) is that it may contain dimensions of value that are currently undervalued by the market. A couple of examples have been mentioned throughout this book. Upon first introduction, the feature “Teflon coated” was quickly relegated to Area E status, as consumers did not connect with the value of fat-free cooking, as the original promotion held. Yet when the feature was connected to a more important value (ease of clean-up, time savings), Teflon coating became an instant strong point of difference. Similarly, earlier we mentioned Tang’s rise to prominence in Asia and other locations as the firm has leveraged the brand’s recognition with packaging innovations that better connected with customer needs.
The general notion here is that the firm may discover in Area E hidden assets that may—with a little extra effort—connect well to customer values. In a classic Harvard Business Review article, Nariman Dhalla and Sonia Yuspeh cite many examples of firms who gave up on certain brand assets under the assumption that they were in the mature phase of the product life cycle.Dhalla and Yuspeh (1976). They cite the case of Ipana toothpaste, for example, given up for dead by its corporate parent and sold off to small investors. The new owners subsequently produced healthy sales for a reformulated product with the same packaging and branding, with later research showing 1.5 million regional users of the brand. More recent examples of the same phenomenon have occurred in fashion, with the successful reintroduction of the brands Vionnet and Marimekko, each long-ago pioneers in the industry and now experiencing new energy through new ownership.Binkley (2009, November 6); Sains (2004, April 26).
At times, an organization may not realize the strength of its current offering. In the earlier cited work on decommoditization, Rangen and Bowman offer up the example of Signode Corporation, a manufacturer of steel strapping for industrial applications.Rangen and Bowman (1992). In customer research, the company discovered that a certain segment of customers put a high value on its bundled offering of strapping equipment, supplies, and engineering service. Essentially, the unique value of the bundling was unknown to the firm, who assumed it was unimportant in the customer’s decision calculus. In the firm’s assessment (prior to the research), this was essentially an Area E item, not believed to be particularly influential in customer decisions. The discovery that this was more important to some customer segments than first thought led to clearer segmentation of the market and more profitable pricing policies.
Exploit the Competition’s Weakness (Area F → Area A)
As noted earlier, there are risks associated with attacking a competitor on a weakness and potentially leveraging that weakness into a strength or point of difference. However, the strategy may be most likely undertaken when the competitor will find it difficult or unprofitable to follow. A recent illustration is Southwest Airline’s taking advantage of the baggage fees introduced by legacy airlines like United, Delta, and Continental. Southwest has countered this move with a steadfast refusal to introduce fees for the first two bags checked and a humorous advertising campaign built around the theme “Bags Fly Free.” While debate has ensued about Southwest’s decision to eschew significant revenue the other airlines are gathering, the company points to its gains in passenger miles and load factor, each surprisingly up 9% and 11%, respectively, in August 2009.Bachman (2009, October 14); Associated Press (2010, May 3). Southwest executive Kevin Krone reflects the company’s resolve to stick with the no fee policy, noting, “If we’re trying to get people to travel, we should probably let people take their suitcase.”
Explore and Leverage the White Space (Area G → Area A)
One of the exciting dimensions of the 3-Circle model is the fact that it graphically illustrates a reality that we often lose sight of on a day-to-day basis: that customers always have unmet needs or needs that have not been fully met. In the nearly $7-billion laundry detergent market, Procter & Gamble (P&G) was able to make significant strides in market share for their brand Gain, originally introduced in 1969 as an enzyme-driven laundry soap for difficult stains. More recently, deeper study of consumer needs uncovered a powerful—if somewhat obvious in hindsight— conclusion that consumers are driven in laundry detergent choice as much by what they smell as by how the detergent cleans. In fact, scent connected especially well for ethnic segments, such as Hispanics.Byron (2007, September 4). The repositioning of the brand around scent was enormously successful, as Gain picked up 3 percentage points in market share, that increment valued at $198 million annually, and the brand became P&G’s 23rd billion-dollar brand. In a similar vein, Crocs shoes had to counter long-standing disequity that its shoes were ugly by bringing attention to the comfort of the shoes with the theme “feel the love” (see Figure 6.9 "Crocs Advertisement"). Croc’s revenue increased 24% in the 1st quarter of 2010, compared to the 2009 results, with a $28-million improvement in net income.Young (2010, April 20); Business Wire (2010, May).
In each of these cases, the firms did not discover needs that they were not already aware of. What is different here is that once the firms understood the importance of these values, in each case, they asked how they could more effectively deliver on or connect with these needs. In short, these efforts were not framed as technology in search of markets but instead were understood to be customer needs in search of solutions. That is a very important distinction.
The topic of brainstorming around unmet needs is quite important (and complex), and there exist a number of helpful sources that dive deeply into the topic.In our view, some of the most helpful frameworks can be found in Eric von Hippel’s (1988) work on innovation by studying lead users; Rao and Steckel’s (1998) insightful chapter on studying unmet customer needs; Christensen et al.’s (2007) framework on customer “jobs”; and MacMillan and McGrath’s (1998) study of the customer’s consumption chain. It is beyond the scope of the current work to overview these approaches, but we will offer a short, concrete insight that builds upon our earlier coverage of understanding deeper customer values. Consider a firm we will call David, Inc., which competes in electronic commerce industry, working with billion-dollar customers in a targeted industry. The competitor is Goliath Corp., inventor of the current technology used in the industry. Our analyst for David, Inc. (let us call him Dave), undertook a 3-Circle growth strategy analysis with a strong predisposition that to win business from Goliath, it would be critical to reduce and allocate the customers’ costs for them, to be compliant with security protocols and governance practices, and to reduce complexity and time. While these expectations are all accurate at a certain level, in-depth interviews with customers had an eye-opening impact on Dave’s thinking:
So, what did we learn in talking to customers? A LOT. News flash—analysts write about features and capabilities, not customer needs. If you want to find out what is really going on, ask a customer—they are happy to tell you…I thought it was all about technology and capabilities. Sure, technology is important, but what customers are really looking for is partnership.
Figure 6.9 Crocs Advertisement

Prospective customers ultimately conveyed, very frankly, that they were tired of being treated like a “captive audience” by Goliath Corp. Frustration was such that when one vice president of finance for a potential customer was asked, “What matters most in a technology vendor?” she replied, “The ability to easily replace them.” A vice president of information technology (IT) unexpectedly answered the same question, “The ability to help us move faster.” Rather than being concerned about features offered by a vendor, he was ultimately concerned with the fact that his reputation was on the line in getting the IT infrastructure to a point where it could keep up with, and not constrain, the speed with which his firm was doing business. These deeper Area G insights and frustrations gave the David, Inc., team new inspiration. Instead of being frustrated by the impossible task of unseating the dominant competitor, the team developed strategy with the belief that there were ways to quietly and effectively partner with customers. Business could be taken from Goliath Corp. not as a pure cost-reduction positioning (although that was important), but more broadly in terms of moving quickly to next-generation solutions and to broaden the types of information that could be electronically moved in the interest of partnering and helping customers maintain the pace of business.
6.6 Chapter Summary
Let us summarize the chapter’s key concepts by returning to the Kindle example from Chapter 5 "Sorting Value". What are the implications of the growth strategy framework for Kindle’s possible outlets for growth? We can get some initial speculative insight—subject, of course, to the need for additional research.
- Kindle’s Area A: Kindle’s positioning as a dedicated electronic reader is very clear, as it was essentially the pioneer. Its features build to the core benefits of focused reading and undistracted immersion, as well as inexpensive access to books.
- Imperative 1: Correct deficiencies. There may be some borderline deficiencies here, particularly related to navigation. While the system moves relatively quickly, the difficulty of using the tiny joystick can be frustrating both in terms of speed and accuracy of navigation.
- Imperative 2: Solidify and update Area B. If book selection is currently roughly equivalent (and limited) between Kindle and iPad, then this may be an area we can expect differences to emerge because it is both important to customers and a function of building and shifting partnerships with publishers, which could quickly add access.
- Imperative 3: Neutralize Area C. There is, of course, some overlap here with Imperative 1. We designated navigation as more of a deficiency because it has an immediate, potentially dissatisfying effect in simple operation of the device. Related, but perhaps not as immediately urgent, is the availability of touch-screen technology and color. The point here is not simply to mimic the iPad but to enable design changes that will improve the user experience for the focused purpose. It is conceivable that no changes should be made regarding the Kindle navigation if most users perceive minimal effects on the user experience or if such changes reduced the speed of the device.
- Imperative 4: Reduce and eliminate nonvalue. Since the Kindle is already believed to have value because of its simplicity and single purpose, it is fair to suggest that there may be few areas in which to reduce the reading-focused capability. However, it is important to note the mantra of “keeping Kindle simple” is strategically very important, as there may be temptation to gravitate toward greater capability.Brown (2010, January 28).
- Imperative 5: Build and expand Area A. To be selective here, we will focus on an Area G item that is important to readers, particular on niche genres or topics. Collectively, readers demand a large book selection. Currently, each competitor in the eReader market is limited to a select number of publishing relationships. Blogger Damon Brown (cf. note 16) offers the following advice:
There are hundreds of medium-sized (or smaller) publishers available within and outside of the United States. Amazon wisely is going after the smaller guys, too, with its recent royalty (and rights!) heavy contract option appealing to self-publishers, a group Apple didn’t acknowledge (during a keynote address).
The development of reading-related applications and more extensive study, which allowed the sizing of benefit and interest segments in the reading market, could be important vehicles for reaching readers more effectively than Apple does.
The importance of the 3-Circle framework is that it allows a systematic walk-through of the dimensions of value currently available on the market and a rigorous review of growth strategy questions with emphasis on all the important value dimensions in the market (but current, known dimensions and those not so well known). The goal is to stay focused on how our organization might build a unique position by developing important value for customers that competitors cannot match. A critical issue in this is the notion of capability—once we develop ideas for building growth strategy, how do we execute them? Capabilities, resources, and assets are the focus of the next chapter.