This is “Building and Managing the Strategic Architecture”, chapter 5 from the book Business Strategy (v. 1.0). For details on it (including licensing), click here.
For more information on the source of this book, or why it is available for free, please see the project's home page. You can browse or download additional books there. To download a .zip file containing this book to use offline, simply click here.


Chapter 5 Building and Managing the Strategic Architecture
Overview
We now have everything we need to develop and use a complete picture of your organization’s performance. This chapter will show you the following:
- how to assemble a complete strategic architecture of your business involving performance, resources, flows, and interdependences
- how to use this architecture to manage the system, understanding past performance, likely developments, and alternative possibilities
- how to control performance into the future
Remember the strategy challenges that we highlighted in Chapter 1 "Performance Through Time"? These were
- Why has performance followed the path that it has?
- Where is it going if we carry on as we are?
- How can we change it for the better?
Now that you understand the way a system of resources works, you are in a position to answer these questions in detail.
5.1 Building the Strategic Architecture
Why Has Performance Followed a Particular Path?
Earlier chapters have given us all the elements we need to develop a complete picture of our business, together with the information that explains why it has performed as it has up to now. These pieces are as follows:
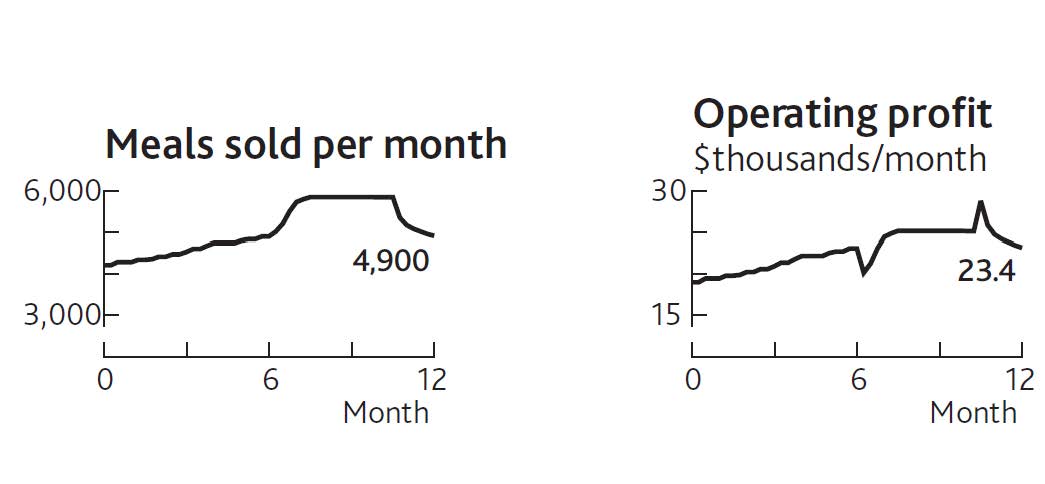
- the time chart of one or more performance measures (e.g., profits, sales, service levels), with scale and timing
- the list of likely resources involved (e.g., customers, clients, staff, products, services, cash, capacity)
- the chain of immediate causes for that performance, often with simple arithmetical relationships (e.g., gross margin, revenue, labor costs, customer demand)
- at the head of those causal chains, the resources driving demand, supply, and performance (e.g., customers, staff, products, services, cash)
- the flows of resource (e.g., customers won and lost per month; staff hired, promoted, or leaving per month; products added or discontinued per year) into, through, and out of the organization’s system
- the immediate causes of these rates of flow, whether your own decisions or other factors
- the dependence of each resource flow on existing resources, either for the same resource or others
To illustrate these stages, let us go back to the performance of your restaurant that you wanted to understand before deciding what to do next. Start by pulling the pieces together.
-
The time chart of one or more performance measures, with scale and timing (Figure 1.4 "Restaurant Performance Example").
-
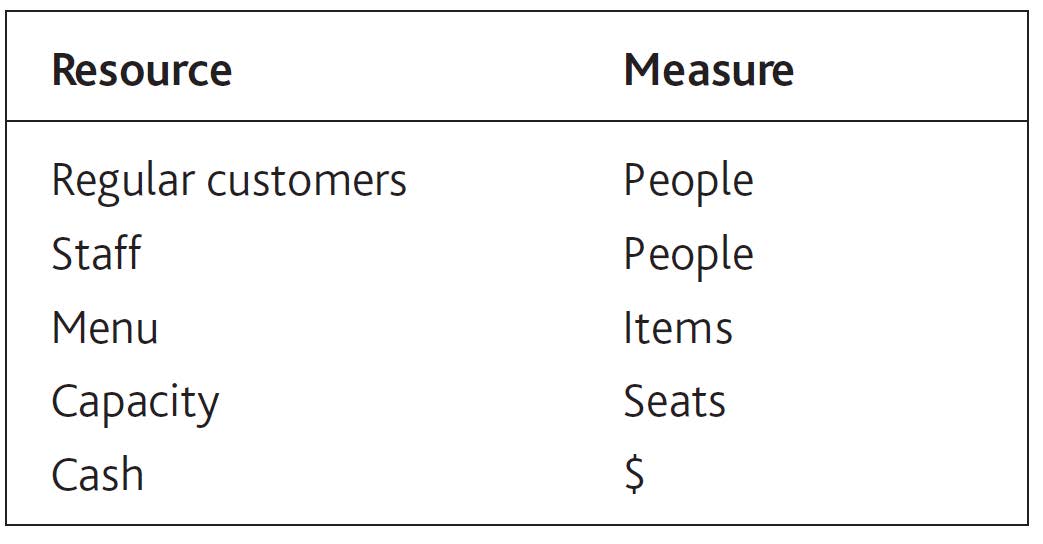
The list of likely resources involved. (Note: Not all of these may be needed to tackle a specific challenge. Subsequent stages will identify those that are involved.)
-
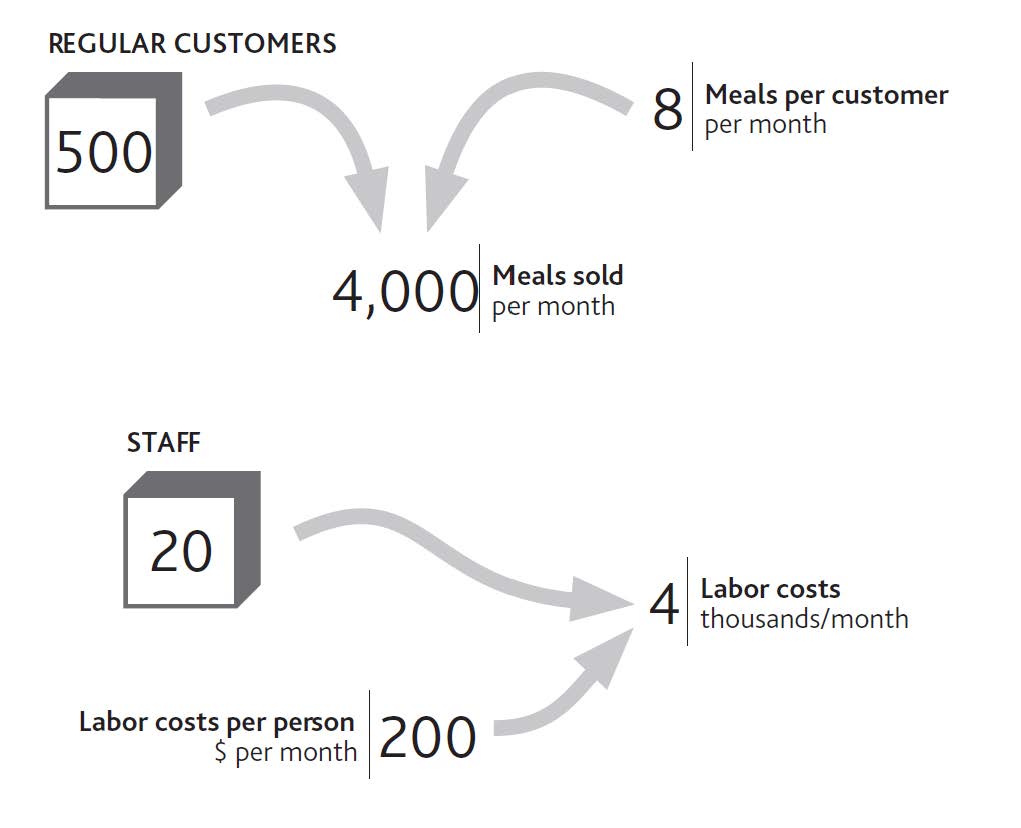
The immediate causes of that performance (Figure 2.1 "The Explanation for Restaurant Sales and Labor Costs").
-
The resources driving demand, supply, and performance (Figure 2.2 "Your Restaurant’s Resources and Operating Profits").
-
The flows of resources into, through, and out of the organization’s system (Figure 3.6 "The Separate Flows of Customers Into and Out of Your Regular Customer Group").
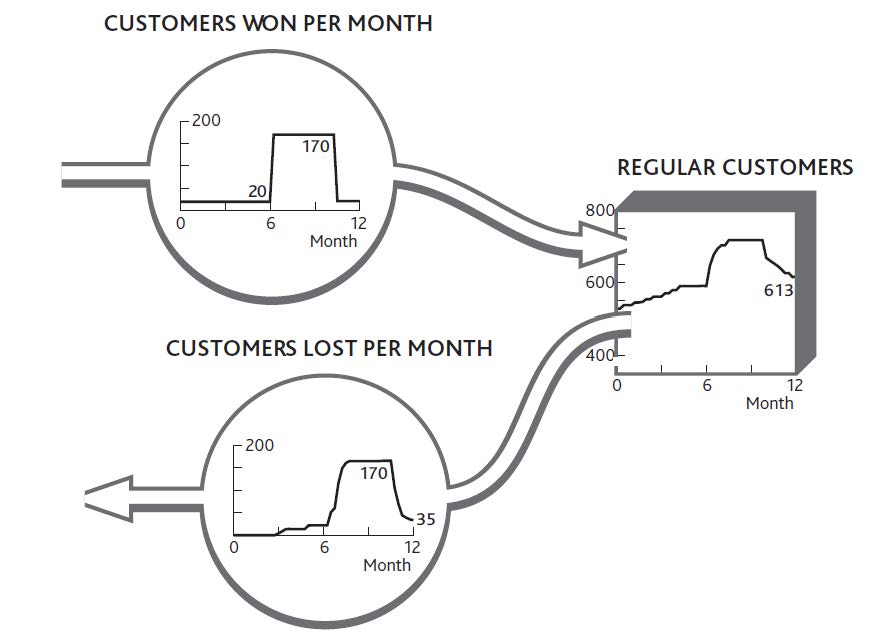
-
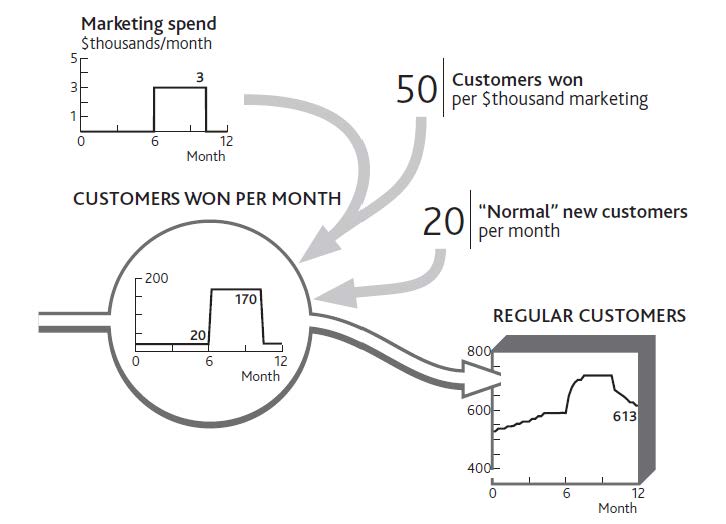
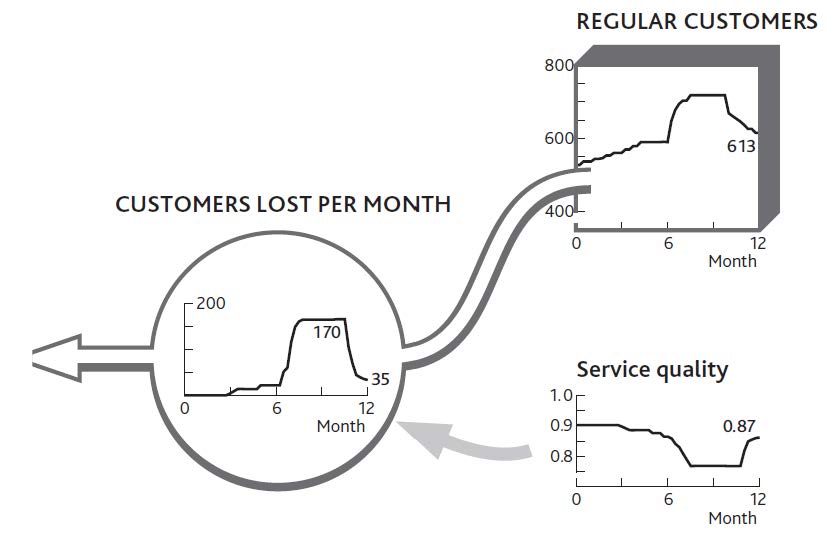
The immediate causes for these flows to be running at the rate they are (a) why customers are being won (Figure 4.1 "Marketing Decisions Change the Inflow of Customers" shows the “normal” rate at which new customers arrive, plus those won from your marketing spending). (b) why customers are being lost (extended version of Figure 4.8 "The History of Service Quality and Customer Losses").
-
The dependence of each flow on existing resource levels (Figure 4.9 "Why Service Quality Suffered Then Recovered").

Doing It Right: Do Not Try to Do Everything
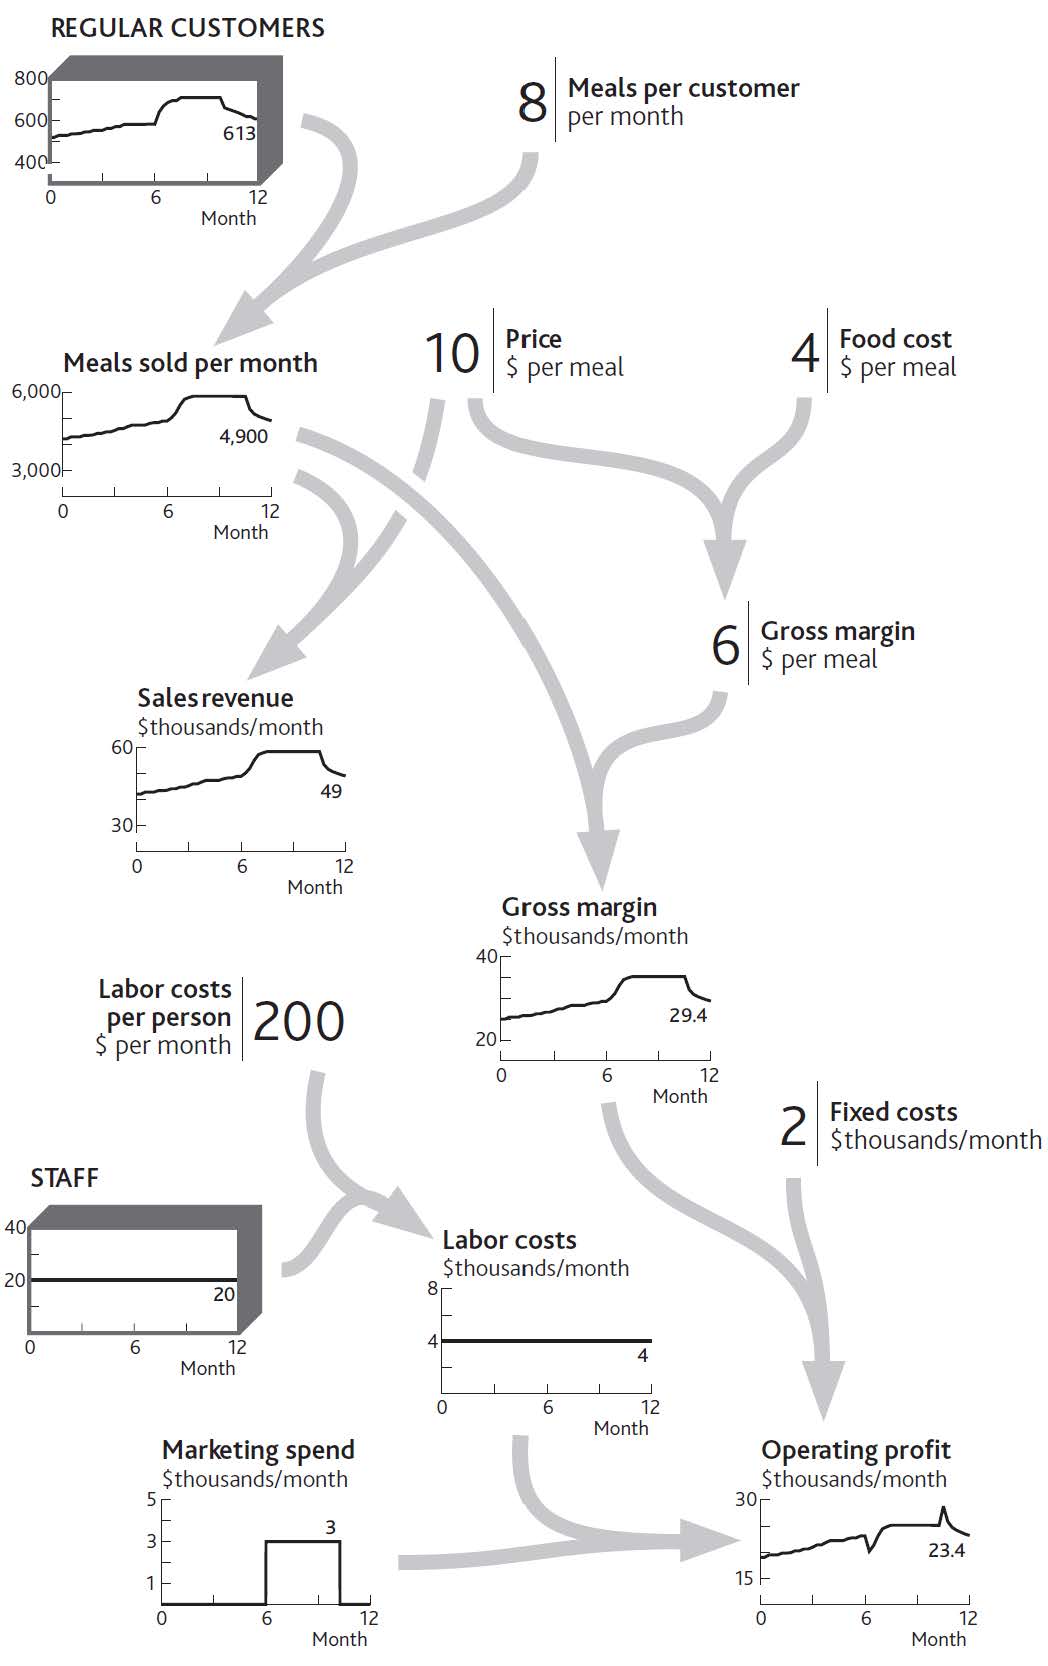
Figure 5.1 "The Strategic Architecture of Your Restaurant, With Data Explaining Recent Performance" is far from a complete architecture of your restaurant. It does not, for example, include certain resources, such as the menu or the seating capacity. Nor does it include potentially important factors that could drive changes in performance, such as price or competitors’ actions. The best approach is to include as much of the architecture as is necessary to create a plausible explanation of performance over time.
This needs great care!
- First, do not do unnecessary work, such as collecting data on things that are not relevant. Keep the pictures to a minimum, so you can show people what is happening and why.
- Conversely, check you do not leave out factors that are (or could be) important. This is especially tricky when looking forward rather than just trying to explain the past.
- Finally, when you have an architecture that explains performance, ask whether you have missed anything that may be important to the question you set out to answer.
Figure 5.1 The Strategic Architecture of Your Restaurant, With Data Explaining Recent Performance
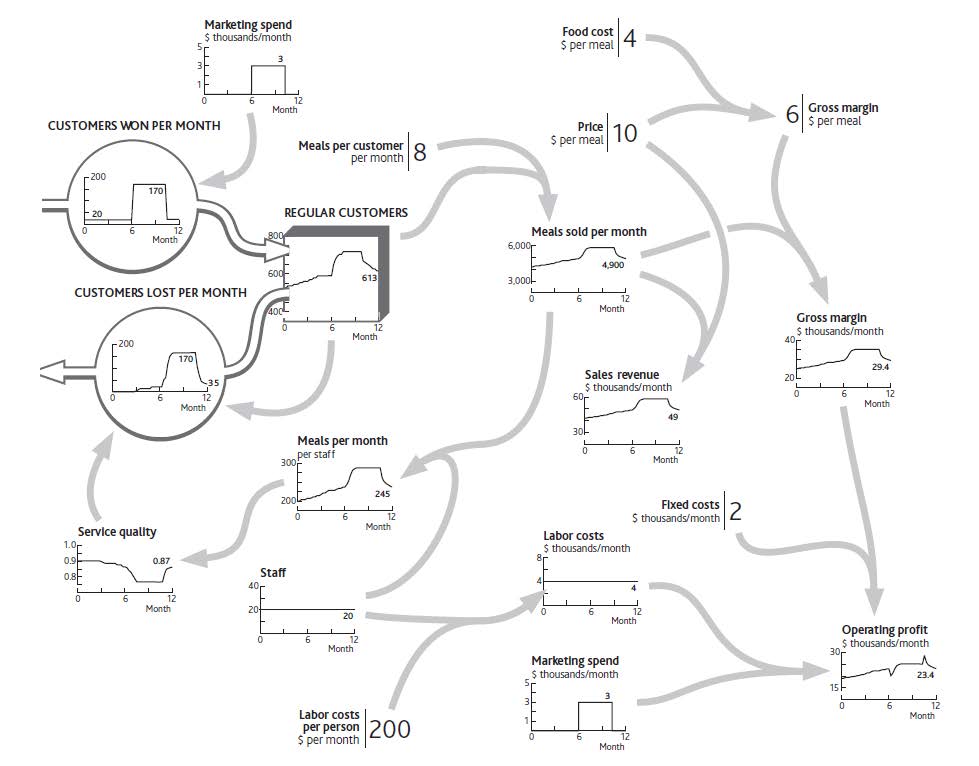
These elements connect together to provide a complete explanation of recent performance and future challenges (Figure 5.1 "The Strategic Architecture of Your Restaurant, With Data Explaining Recent Performance").
5.2 Using the Architecture
How Have We Come to This Position?
A strategic architectureA tool used to resolve specific issues and guide the performance of an entire strategy. The strategic architecture should be focused on flow rates. provides a living reference for a firm’s structure and behavior. A critical part of top management’s job is to understand that structure, ensure that it is well designed, and steer its performance (Keough & Doman, 1992). Diagrams such as Figure 5.1 "The Strategic Architecture of Your Restaurant, With Data Explaining Recent Performance" are a common way of understanding and controlling complex systems. Even if you have never visited a chemicals plant or power station, flown an aircraft, or managed a rail network, you will have seen pictures of “control panels” that give management continuous information on the states of key variables. Their control panels look like the system they are managing.
We are trying to achieve the same analog-style diagram for your organization. To make best use of such a picture, you need to have it available and accessible to your whole team, perhaps on a large wallboard in the main meeting room. It may be helpful to have other diagrams in other meeting rooms to show more detail about the architecture of key parts of the system: a diagram of customer segment details in the marketing area, a diagram of people flows in the human resource (HR) department, and so on.
You may not get it right the first time. However, any inaccuracies will become apparent as you learn whether the relationships you have sketched between the connected data provide a good explanation of what is happening. If not, you can readily identify what may be missing or inaccurate and revise the architecture diagram accordingly.
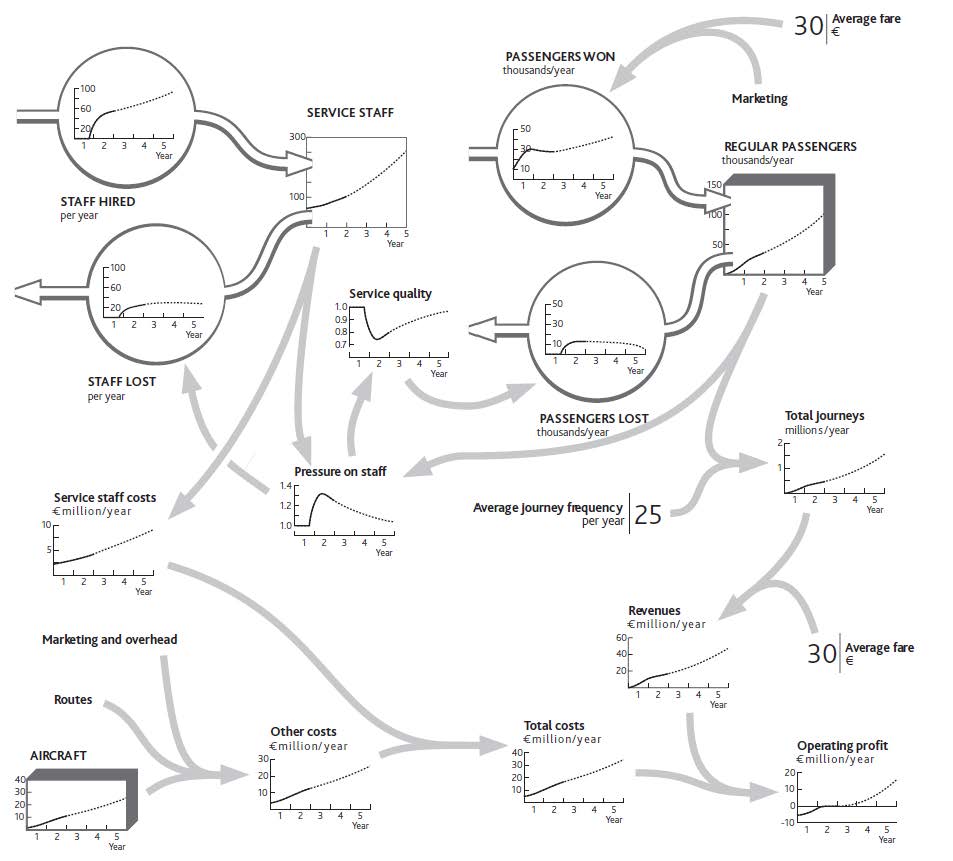
A well-developed strategic architecture is a powerful tool, both to resolve specific issues and to guide the performance of the entire enterprise strategy. To understand this, consider a rather more extensive example than your restaurant: the architecture of a low-fare airline (similar to Ryanair, which is featured in Chapter 2 "Resources: Vital Drivers of Performance"). Figure 5.2 "Growth Slowdown for a Low-Fare Airline" shows the first 2 years of operation, followed by a possible 3-year future, denoted by the dotted portion of the lines.
Figure 5.2 Growth Slowdown for a Low-Fare Airline
Doing It Right: Whole Numbers
The chart for aircraft in this example shows a smooth line, even though this resource comes in batches; operating 7.5 planes, as it seems you did at one point in year 2, does not make sense. Strictly, we should have a stepped chart over time for aircraft, with a jump to a new number each time a batch of ordered aircraft is received. But for a strategic view of what is happening you do not need to worry about this picky detail.
It looks complicated, but if you take it in sections, you can see how the stages come together:
- Issues of concern by the end of year 2 are operating profit (bottom right), which seems to have stalled, and total journeys (middle right), where growth has slowed.
- The core resources are aircraft, passengers, and staff (routes, too, but we can add these later).
- The immediate factors driving operating profits can be traced back through revenues to total journeys, and through total costs to staff and other cost drivers (in practice, these would be split further).
- The flows of resources into, through, and out of the organization’s system are the gains and losses of passengers, the hiring and loss of staff, and the acquisition of planes. Since buying and selling planes is a simple decision, directly under management control, we do not need to show that on the diagram.
- The problematic flows are the loss of passengers, which appears to be due to a sharp drop in service quality, and the loss of staff, which arose from a steep increase in work pressure.
- The pressure on staff appears to be due to the imbalance between passenger volumes and staff numbers.
- The entire picture explains recent history. Growth in passengers and journeys exceeded the staff’s ability to cope, causing them to leave and thus damaging service quality, which in turn increased the loss of passengers.
Valuable insights can arise simply from the team activity involved in developing this picture, as it will typically prompt substantial debate and analysis. Two elements will ensure that insights are accurate and address the correct issues:
- The time charts for core resources, flow drivers, and performance keep discussion focused on the best-known facts of the situation. Do not give up if you do not know precise data; instead, estimate what the facts might have been, then use judgment to fill in unknowns. For example, you may not have records of staff attrition rates, but if you know hiring rates and total staff numbers, the history of attrition is easy to calculate.
- You will have quantified how each resource flow depends on the factors driving it. Again, if you do not know for sure what is happening, think through your best explanation and check that it fits with the facts. Do not tolerate unsubstantiated assertions like “Everyone knows staff are leaving because our competitor offers better pay” unless there is factual evidence to back it up.
Where Is Performance Heading if We Go on Like This?
Figure 5.2 "Growth Slowdown for a Low-Fare Airline" goes further than explaining recent history. It sketches out the team’s best estimate of where performance is heading into the future. The dashed lines show the estimate that you and your team came up with about the way things are likely to develop if you continue with present policies.
You will continue running a tight operation. This means continuing to hire staff at a steady rate. They may be under pressure, and service quality may not be great, but the business is satisfactory, passengers and journeys are growing, and your company is profitable. You expect that by increasing staff numbers ahead of growth in passengers and journeys, you will gradually bring down the pressure on your staff. In time, service quality will recover enough to slow the loss of passengers and overall growth will pick up.
How Can We Act to Improve Future Performance?
The strategic architecture you develop will enable your team to evaluate a range of possible future strategies—the final stage of the process. You again need an organized approach:
- Start with the points in the business architecture where step 6 showed the challenge to lie: where flows are not running as you would like.
- Focus on the links into that part of the architecture that management can influence. For the airline in Figure 5.2 "Growth Slowdown for a Low-Fare Airline", these would be price changes, marketing, and hiring.
- Estimate the scale of policy revision and the likely scale and timing of its results. For example, if you cut fares by 10%, how much would the passenger win rate change? If you double the hiring rate, how quickly will staff numbers rise to your target level?
- Follow the consequences of these policy changes. If you cut fares and bring in more passengers, how much will this change total journeys and pressure on staff? How much impact will this have on passenger losses and staff turnover? If you boost hiring, how much will that change pressure on staff, and what impact will that have on passenger losses and staff turnover?
- Anticipate any issues that might arise from altering the part of the system where the current problem is focused. Cutting your fares will clearly cut revenue per journey, and increasing staff will increase costs, both resulting in a short-term drop in profits. How long will it take before the improved resource flows you stimulated work through to generate revenues and profit improvements that overcome this short-term penalty?
- Finally, work through how any performance outcomes might evolve over time because of the proposed changes. The cut in fares might very quickly bring in more passengers and boost revenues and profits, although the further consequence would be increased workloads for staff, faster passenger losses, and hence a later decrease in passengers, journeys, revenues, and profits. Alternatively, increasing hiring should reduce the pressure staff are under, reduce turnover, improve service quality, and cut passenger losses, thus increasing total passengers even if there is no change in passenger win rates. More passengers means more journeys and revenues, which will more than pay for the higher staff costs.
Let us work through an example. One of your colleagues believes that poor service quality is unacceptable: It risks building up a poor reputation among potential passengers, which could hurt future growth. This colleague feels you should immediately hire enough staff to remove the overload.
Together, your team works through what might happen (Figure 5.3 "Relieving Staff Pressure to Improve Service", heavy dotted lines). One risk in the proposed solution is that these newcomers will not know what they are doing at first, so they will be deployed on simple tasks, and hiring rates can be reduced for a while so they can acquire more skill. Your colleague feels that this simple step will immediately relieve some of the pressure and give your people the ability to improve service quality quickly—especially if you tell them that this is your plan!
Figure 5.3 Relieving Staff Pressure to Improve Service
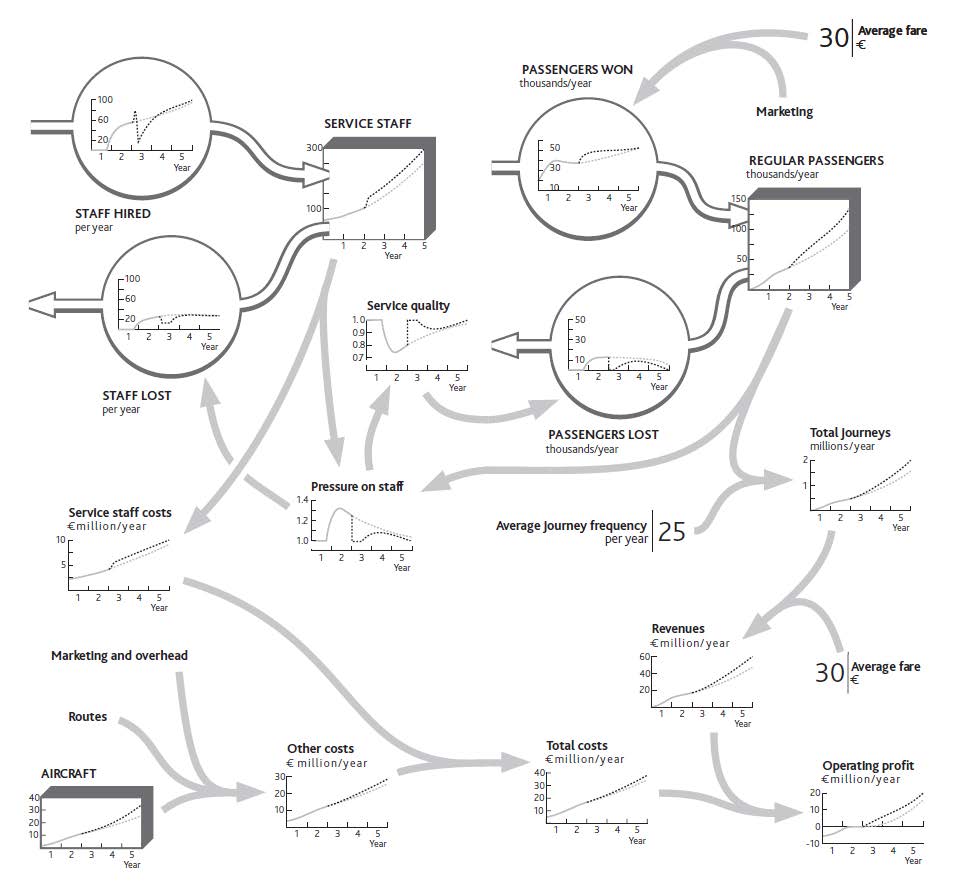
You are reasonably confident that the improvements to workload and quality will materialize, so you estimate that passenger growth will accelerate once more, provided you continue adding routes and aircraft. You feel there is a small risk that this will again put staff under pressure some time during year 3. You resolve to keep track of this issue and revisit the hiring policy if it looks as though the problem is recurring.
5.3 Take Control: Looking for Fixes
The airline’s one-off hiring effort is just one example of a management response to improve performance. There are other common types of response, and it is important to look for and evaluate these in the right order, otherwise you risk undermining one fix by missing unintended consequences:
Minimize Leakages in the Resource System
Many organizations focus on cost-effectively acquiring resources and building them but pay much less attention to keeping them. However, there is little advantage in trying to increase the stock of resources in the system if the organization simply loses them again. Too often, customers are won, only to be lost again by poor products or service; staff are hired and trained, only to leave again for any of a host of reasons; new brands are established, only to become uncompetitive as the excitement of the launch fades; distribution agreements are set up, but stall when the company proves unable to sustain the relationship. Of course, there may be situations where the organization has good reason to reduce resources deliberately: for example, cutting back on sales efforts as you progress toward fully exploiting a market opportunity.
Improve Resource Acquisition and Development
Once you have ensured there are no leaks in your bath, you can think about filling it!
- Examine each resource inflow, ensuring that other necessary resources, mechanisms, and policies are in place to enable growth. Is the marketing budget sufficient to reach potential customers to make the desired win rate feasible? Is the product’s functionality adequate to win customers and are the production, delivery, and installation resources in place to turn orders into completed sales? Is the hiring and training capacity in place to bring in staff at the rate required and make them productive quickly?
- Apply the same principle to ensure that existing resources, mechanisms, and policies are in place to allow resource development to occur: turning prototype products into marketable goods, developing sufficient numbers of experienced people, and so on.
Eliminate Self-Imposed Limits
The development of one resource can be hampered by inadequacies in other resources. The team should therefore examine the strategic architecture, focusing on each resource in turn and ascertaining whether its own growth may cause imbalances that restrict its further progress. A valuable question to trigger insight is, “If we are successful in winning these customers (or finding these staff, or launching these products), what are all the things that could go wrong or get in the way?”
Look for Reinforcing Mechanisms to Drive Growth
Only after steps 1 through 3 have been completed should you turn to the tempting task of finding reinforcing mechanisms to drive growth. By this point it should be safe to look for ways in which existing resources can be leveraged to drive their own growth or that of others. Can you, for example, leverage existing customers and your resulting reputation to drive faster acquisition of further new customers or to increase your ability to hire the best people?
Evaluate Step Solutions to Shift the System to a New State
In cases where resource limits and imbalances are serious, it may be impractical or take too long to grow, develop, or reduce the necessary resources. Instead, step changes may be appropriate. These may be limited to actions in a single part of the business or affect many resources simultaneously:
- Action may be needed to bring a single resource into line with the rest of the system, either as it is or as it is planned to become. Signing up a large new dealership can provide rapid access to a new customer base; licensing products from other firms can quickly fill out a weak product range; and taking on contractors can rapidly relieve staff pressure. Beware, though: Such actions may themselves place new demands on the organization, so make sure they can be absorbed.
- Larger actions may be required to take the business to a whole new level, with better balance and stronger growth potential. Acquisition is one of the clearest examples of such a shift for the whole organization and featured strongly, for example, in the growth of Blockbuster Inc. in its drive to become the dominant movie rental business in the United States and other countries. Each acquisition brought a bucket full of new stores, new customers, and new staff, which were assimilated into the established Blockbuster system. On the other hand, rationalization of several parts of a system may be necessary to bring an ineffective organization back to a core of activity that can be sustained into the future. This may entail rationalizing the product range, removing poor-quality customers, reducing capacity, and cutting staff, all in a coherent move over a short period.
Although step solutions are hardly a new approach to improving an organization’s performance, a sound architecture of the situation will provide important safeguards for their implementation. Above all, the rest of the system needs to able to absorb the new or increased resource. It may be necessary to develop complementary resources, or at least start them on an increasing trajectory so that they quickly become able to cope with the influx. Without such precautions, the very solution itself may trigger some new resource losses that undermine your hoped-for improvement.
It is common, for example, for staff to resign after new people arrive. Losses may also arise among other resource categories: For example, inward licensing of new products may cause product development staff to become disillusioned and resign, and the opening of new direct customer relationships may cause dealers to defect to rivals.
5.4 Maintain Control: Managing the System
A clear picture of the organization’s overall performance and underlying strategic architecture provides valuable insights into how decisions should be guided. The first observation is that using financial outcomes to guide decisions is likely to be hopeless. Clearly, the immediate consequences must make sense: You do not want to spend what you cannot afford, or price your product so high as to kill current sales or so low as to destroy margin. But this is not strategic control.
A simple principle guides how strategic decisions should be viewed: Strategic managementA process concerned with the key objectives of an organization, the use of its resources, and enhancing the organization's performance in its environments. Flow rates are key aspects of an organization's strategies. is all about flow rates!
To appreciate the implications of this view, think about how our airline team might set a rule of thumb for its marketing spending. Some of the possibilities from which to choose include:
- Marketing spending should not exceed a set fraction of revenue.
- If profits dip too low, cut marketing by a fraction.
- Check that marketing does not exceed a specified cost per passenger journey sold.
- Spend more on marketing if planes are not full.
- Spend more on marketing if regular customers are being lost.
However, marketing directly affects just two main items: the frequency with which existing passengers travel with your airline and the rate at which new passengers are won. Marketing is not the only factor driving these values, but these values are the only significant things being driven by marketing! These, then, should be the focus of the decision rule for marketing because they are closely coupled to the decision variable.
The further you move away from this principle, the more likely it becomes that your decision rule will cause serious problems. It is astonishing, for example, how many organizations stick to “percent of sales” ratios to decide their spending on everything from research and development (R&D) to marketing, training, and maintenance. Just think how this would work for your restaurant:
- Labor cost must not exceed 15% of sales.
- So, if sales fall for some reason, you cut staff.
- So service quality drops, and sales decline.
- So you cut staff again to keep within your 15%!
You become trapped in a cycle of decline. This makes no sense, and in practice, managers usually avoid such foolish consequences. But why start with a decision guide that makes no sense in the first place? Pressure from investors who may not understand the structure of the strategic architecture often does not help.
So which performance metricsMeasures of the difference between an organization's targeted and actual performance. guide decisions best? Many organizations now use some form of balanced scorecard: an integrated approach to performance measurement and management (Kaplan & Norton, 1996). This recognizes that financial factors alone provide inadequate targets and incentives and so adds measures relating to
- customers: satisfaction, retention, market share, and share of business;
- internal performance: quality, response times, cost, and new product introductions;
- learning and growth: employee satisfaction and availability of information systems.
Only if these additional factors are in good shape will the firm deliver strong financial performance. The balanced scorecard offers important advances over traditional reporting approaches in recognizing the interconnectedness within the business and the importance of measuring and managing “soft” issues. Increasing training of staff about products, for example, will improve sales effectiveness, which in turn will improve sales and margins.
There are limits, though, to the control that a balanced scorecard can achieve if it is not designed to take account of the dynamic interactions that run through the organization’s architecture. There are two particularly common failings:
- What may be good for an indicator under one condition may be bad under other situations. A common example is the winning of new business when the organization cannot cope with what it already has.
- The optimum balance between different parts of the architecture often shifts substantially as situations develop. Early in the growth of a business, service capacity may need to be a rather minor part of the organization’s total activity, but later it can come to dominate as business builds up. Similarly, you may want to keep staff turnover very low when trying to build capability in a rapidly developing organization, but some rate of staff losses may be positively helpful when growth slows in order to make room for new people to develop.
Doing It Right: Avoiding Disappointment With Strategic Architecture
Management techniques often fail or fall from favor not because they are wrong, but because they are not used properly. Superficial work, done in the hope of a quick fix, is a common culprit. The extensive effort required by many otherwise sound methods is often not sustained. As senior managers instruct their people to undertake one initiative after another, none is carried to fruition before the next is begun. Initiative overload is a common cause of poorly implemented strategies.
Strategy dynamics—the basis of the approach in this book—will not work either if badly applied. It is a powerful but demanding approach that needs to be done professionally and thoroughly if accurate findings and good managerial responses are to be obtained. However, it is not typically more time-consuming or analysis-intensive than many planning processes that organizations put themselves through. Indeed, it often eliminates much activity, data processing, and analysis that would otherwise have been carried out.
Who should do this work? You and your team. Continuing management of today’s dynamically complex organizations in today’s dynamically complex markets and environments is not intuitively easy. For this reason, beware of consultants. Though many excellent professionals can carry out all kinds of demanding analysis and give exceedingly sound advice, few have had a thorough education or training in dynamic analysis. This is a tricky skill, and amateurs will usually get it wrong. Moreover, the need to review your performance dynamics will never go away. You cannot subcontract strategic leadership and you cannot subcontract strategic understanding.
Action Checklist: Building and Managing the Strategic Architecture
The action checklist for this topic was already outlined, so in summary:
- Follow the steps explained in Section 5.1 "Building the Strategic Architecture" to develop the strategic architecture of your organization or for an issue it is facing.
- Using that architecture, follow steps 1 to 5 in Section 5.3 "Take Control: Looking for Fixes" to identify how to enable improved and sustainable performance.
Note that this short book can only provide a summary of how this approach works for some simple business examples. For more extensive guidance on more complex situations, see Warren (2008) and http://www.strategydynamics.com.