This is “Construction of Financial Statements Beginning with the Income Statement”, section 3.1 from the book Business Accounting (v. 2.0). For details on it (including licensing), click here.
For more information on the source of this book, or why it is available for free, please see the project's home page. You can browse or download additional books there. To download a .zip file containing this book to use offline, simply click here.


3.1 Construction of Financial Statements Beginning with the Income Statement
Learning Objectives
At the end of this section, students should be able to meet the following objectives:
- Understand that financial statements provide the physical structure for the financial information reported to decision makers by businesses and other organizations.
- Identify each of the four financial statements typically produced by a reporting entity.
- List the normal contents of an income statement.
- Define “gains” and “losses” and explain how they differ from “revenues” and “expenses.”
- Explain the term “cost of goods sold.”
- Compute gross profit and the gross profit percentage.
Financial Statements Provide Physical Structure for Financial Reporting
Question: The revenues, expenses, assets, and liabilities reported by an organization provide essential data for decision making. These figures and related information enable a thorough analysis and evaluation of the organization’s financial health and future prospects. How do outsiders learn of these amounts? How do decision makers obtain this data? How is financial information actually conveyed to interested parties?
For example, a company such as Marriott International Inc. (the hotel chain) has millions of current and potential shareholders, creditors, and employees. How does such a business communicate vital financial information to all of the groups and individuals that might want to make some type of evaluation?
Answer: Businesses and other organizations periodically produce financial statements that provide a formal structure for conveying financial information to decision makers. Smaller organizations distribute such statements each year, frequently as part of an annual report prepared by management. Larger companies, like Marriott International, issue yearly statements but also prepare interim statements, usually on a quarterly basis.Financial statements for many of the businesses that have their capital stock traded publicly on stock exchanges are readily available on corporate Web sites. For example, the statements released by Marriott International can be located through the following path. The financial statements issued by most large companies will be found by using similar steps.•
Regardless of the frequency, financial statements serve as the vehicle to report all monetary balances and explanatory information required according to the rules and principles of U.S. GAAP (or IFRS, if applicable). When based on these standards, such statements create a fairly presented portrait of the organization—one that contains no material misstatements. In simple terms, an organization’s revenues, expenses, assets, liabilities, and other balances are reported to outsiders by means of financial statements.
Typically, a complete set of financial statements produced by a business includes four separate statements along with pages of comprehensive notes. When financial statements and the related notes are studied with knowledge and understanding, a vast array of information is available to decision makers who want to predict future stock prices, cash dividend payments, and cash flows.
Financial Statements and Accompanying Notes
Because final figures shown on the income statement and the statement of retained earnings are necessary to produce subsequent statements, the preparation of financial statements is carried out in the sequential order shown here.
- Income statementA listing of all revenues earned and expenses incurred during a specific period of time as well as all gains and losses; also called statement of operations or statement of earnings. (also called a statement of operations or a statement or earnings)As will be discussed in a later chapter of this textbook, a statement of comprehensive income is also sometimes attached to or presented with an income statement.
- Statement of retained earningsA financial statement that reports the change in a corporation’s retained earnings account from the beginning of a period to the end; the account is increased by net income and decreased by a reported net loss and/or any dividends declared. (or the more inclusive statement of stockholders’ equity)
- Balance sheetA listing of all asset, liability, and stockholders’ equity accounts at a specific point in time; also called statement of financial position. (also called a statement of financial position)
- Statement of cash flowsA listing of all cash inflows (sources) and cash outflows (uses) during a specific period of time categorized as operating activities, investing activities, and financing activities.
- Notes to clarify and explain specified information further
The financial statements prepared by Marriott International as of December 31, 2010, and the year then ended were presented in just five pages of its annual report (pages 45 through 49) whereas the notes accompanying those statements made up the next twenty-eight pages. Although decision makers often focus, almost obsessively, on a few individual figures easily located in a set of financial statements, the vast wealth of information provided by the notes should never be ignored.
Test Yourself
Question:
The Winston Corporation has prepared an annual report for the past year that includes a complete set of financial statements. Which of the following is not likely to be included?
- Statement of changes in liabilities
- Balance sheet
- Income statement
- Statement of cash flows
Answer:
The correct answer is choice a: Statement of changes in liabilities.
Explanation:
The balance sheet reports assets and liabilities at the end of the year. The income statement shows the revenues and expenses incurred during the year. The statement of retained earnings explains the change in the reported retained earnings figure for the year. The statement of cash flows indicates how the organization gained cash during this period and how it was used. There is no statement of changes in liabilities, although information about liabilities is available on the balance sheet.
Reporting Revenues and Expenses on an Income Statement
Question: Assume that an individual is analyzing the most recent income statement prepared by a business in hopes of deciding whether to buy its capital stock or, possibly, grant a loan application. Or, perhaps, this person is a current employee who must decide whether to stay with the company or take a job offer from another organization. Regardless of the reason, the decision maker wants to assess the company’s financial health and future prospects. Certainly, all of the available financial statements need to be studied but, initially, this individual is looking at the income statement. What types of financial data will be available on a typical income statement such as might be produced by a business like IBM, Apple, Papa John’s, or Pizza Hut?
Answer: The main contents of an income statement are rather straightforward: a listing of all revenues earned and expenses incurred by the reporting organization during the period specified. As indicated previously in Chapter 2 "What Should Decision Makers Know in Order to Make Good Decisions about an Organization?", revenue figures disclose increases in net assets (assets minus liabilities) that were created by the sale of goods or services. For IBM, revenues are derived from the sale and servicing of computers (a total of $99.9 billion in 2010) while, for Papa John’s International, the reported revenue figure for 2010 (a bit over $1.1 billion) measures the increase in net assets created by the sale of pizzas and related items.
Conversely, expenses are decreases in net assets incurred by a reporting organization in hopes of generating revenues. For example, salaries paid to sales people for the work they have done constitute an expense. The cost of facilities that have been rented is also an expense as is money paid for utilities, such as electricity, heat, and water.
For example, IBM reported selling, general, and administrative expenses during 2010 of $21.8 billion. That was just one category of expenses disclosed within the company’s income statement for this period.Financial information reported by large publicly traded companies tends to be highly aggregated. Thus, the expense figure shown by IBM is a summation of several somewhat related expenses. Those individual balances would be available within the company for internal decision making. During the same year, Papa John’s reported salaries and benefits as an expense for its domestic company-owned restaurants of $137.8 million. Financial accounting focuses on providing useful information about an organization, and both of these figures will help decision makers begin to glimpse a portrait of the underlying business.
Accounting is often said to provide transparency—the ability to see straight through the words and numbers to gain a vision of the actual company and its operations.
Reporting Gains and Losses
Question: Is nothing else presented on an income statement other than revenues and expenses?
Answer: An income statement also reports gains and losses for the same period of time. A gain is an increase in the net assets of an organization created by an occurrence that is outside its primary or central operations. A loss is a decrease in net assets from a similar type of incidental event.
When Apple sells or repairs a computer, it reports revenue because that is the sale of a good or service provided by this company. However, if Apple disposes of a piece of land adjacent to a warehouse, a gain is reported (if sold above cost) or a loss (if sold below cost). Selling computers falls within Apple’s primary operations whereas selling land does not.
If Pizza Hut sells a pepperoni pizza, the transaction increases net assets. Revenue has been earned and should be reported. If the company disposes of one of its old ovens, the result is reflected as either a gain or loss. Pizza Hut is not in the business of selling appliances. This classification split between revenues/expenses and gains/losses helps provide decision makers with a clearer portrait of what actually happened during the reporting period.
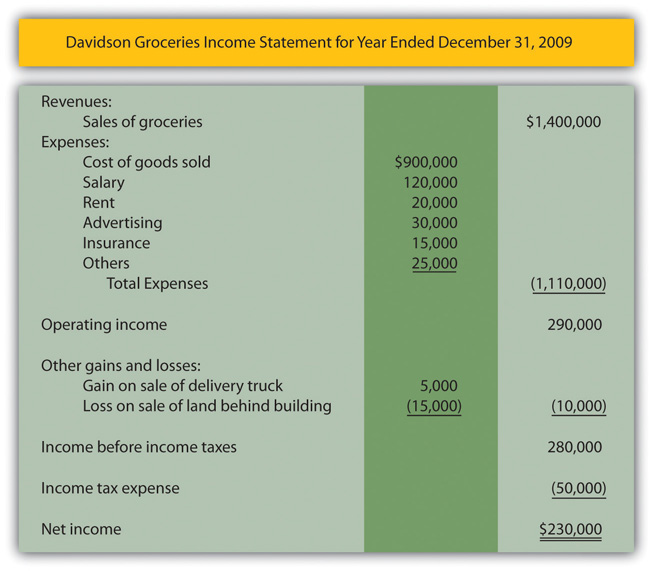
An example of an income statement for a small convenience store (Davidson Groceries) is shown in Figure 3.1 "Income Statement". Note that the name of the company, the identity of the statement, and the period of time reflected are apparent. Although this is an illustration, it is quite similar structurally to the income statements created by virtually all business organizations in the United States and most other countries.
Figure 3.1 Income Statement
Test Yourself
Question:
The Bartolini Company has recently issued a set of financial statements. The company owns several restaurants that serve coffee and donuts. Each of the following balances appears in the company’s financial statements. Which was not included in the company’s reported income statement?
- Loss from fire in warehouse—$4,000
- Rent expense—$13,000
- Cash—$9,000
- Gain on sale of refrigerator—$1,000
Answer:
The correct answer is choice c: Cash—$9,000.
Explanation:
Revenues, expenses, gains, and losses all appear in a company’s income statement. Cash is an asset, and assets are shown on the balance sheet.
Cost of Goods Sold and Gross Profit
Question: A review of the sample income statement in Figure 3.1 "Income Statement" raises a number of questions. The meaning of balances such as salary expense, rent expense, advertising expense, and the like are relatively clear. These figures measure specific outflows or decreases in net assets that were incurred in attempting to generate revenue. However, the largest expense reported on this income statement is referred to as cost of goods sold. What does the cost of goods sold figure represent? What information is communicated by this $900,000 balance?
Answer: This convenience store generated sales of $1.4 million in Year 2XX4. Customers came in during that period and purchased merchandise for that amount. That is the first step in the sale and is reflected within the revenue balance. The customers then take their goods and leave the store. This merchandise no longer belongs to Davidson Groceries. In this second step, a decrease occurred in the company’s net assets; the goods were removed. Thus, an expense has occurred. As the title implies, “cost of goods sold” (sometimes referred to as “cost of sales”) is an expense reflecting the cost of the merchandise that customers purchased during the period. It is the amount that Davidson paid for inventory items—such as apples, bread, soap, tuna fish, and cheese—that were then sold. In the language of accounting, that is the meaning of “cost of goods sold.”
Note that the timing of expense recognition is not tied to the payment of cash but rather to the loss of the asset. As a simple illustration, assume Davidson Groceries pays $2 in cash for a box of cookies on Monday and then sells it to a customer for $3 on Friday. The income statement will recognize revenue of $3 (the increase in the net assets created by the sale) and cost of goods sold of $2 (the decrease in net assets resulting from the sale). Both the revenue and the related expense are recorded on Friday when the sale took place and the inventory was removed. That is when the change in net assets occurred. Apple, Pizza Hut, and thousands of other American businesses report the sale of merchandise in this manner because they all follow the same set of rules: U.S. GAAP.
The difference in revenue and cost of goods sold is often referred to as the company’s gross profitDifference between sales and cost of goods sold; also called gross margin or markup., gross marginDifference between sales price and cost of goods sold; also called gross profit or markup., or markupDifference between sales price and cost of goods sold on an item of inventory; also called gross profit or gross margin.. It is one of the reported figures studied carefully by decision makers. If a business buys inventory for $50 or $5,000, how much revenue can be generated by its sale? That difference is the gross profit.
As an example, assume that an investor or creditor is comparing two large home improvement companies: Lowe’s and Home Depot. For the year ended January 28, 2011, Lowe’s reported net sales revenues of $48.8 billion along with cost of goods sold of $31.7 billion. Thus, Lowe’s earned gross profit during that period of $17.1 billion. Sales of merchandise and services ($48.8 billion) exceeded the cost of those goods ($31.7 billion) by that amount. Lowe’s reported a gross profit that was 35.0 percent of sales ($17.1 million/$48.8 million). Thus, on the average, when a customer bought goods at Lowe’s for $100 during this period the markup above cost earned by the company was $35.00 (35.0 percent of $100 sales price). Any decision maker will find such numbers highly informative especially when compared with the company’s prior years or with competing enterprises.
For the year ended January 30, 2011, Home Depot reported net sales of $68.0 billion, cost of sales of $44.7 billion, and gross profit of $23.3 billion. Its gross profit percentage was 34.3 percent ($23.3 million/$68.0 million). On the average, when a customer bought goods at Home Depot for $100 during this period the markup above cost earned by the company was $34.30 (34.3 percent of $100 sales price). Home Depot is clearly a bigger business than Lowe’s, but during this year it earned a slightly smaller profit on each sales dollar than did its competitor.
Such reported information is studied carefully and allows decision makers to compare these two companies and their operations.
Test Yourself
Question:
The Hayes Corporation is a car dealer. A new car is received from the manufacturer during September at a cost of $33,000. This vehicle is sold in October to a customer for $42,000. In connection with this transaction, which of the following statements is correct?
- The company will report cost of goods sold of $42,000.
- The company will report gross profit of $42,000.
- The company will report cost of goods sold of $33,000.
- The company will report gross profit of $33,000.
Answer:
The correct answer is choice c: The company will report cost of goods sold of $33,000.
Explanation:
On the company’s income statement, revenue of $42,000 (the sales price) and cost of goods sold of $33,000 (the cost paid to acquire the inventory) will be reported. Gross profit is the difference in these two figures, or $9,000.
Placement of Income Taxes on an Income Statement
Question: In Figure 3.1 "Income Statement", revenues and expenses are listed first to arrive at an operating income figure. That is followed by gains and losses. This sequencing is appropriate since revenues and expenses relate to the primary or central operations of the business and gains and losses are created by more incidental events. Why then is income tax expense listed last, by itself, on the bottom of the income statement and not with the other expenses?
Answer: State, federal, and international income taxes cost businesses considerable sums of money each year. Exxon Mobil Corp. reported income taxes of $21.6 billion at the bottom of its 2010 income statement. The income tax figure is segregated in this manner because it is not an expense in a traditional sense. As previously described, an expense—like cost of goods sold, advertising, or rent—is incurred in order to generate revenues. Income taxes do not create revenues. Instead, they are caused by a company’s revenues and related profitability.
Because the financial impact is the same as an expense (an outflow or decrease in net assets), “income tax expense” is often used for labeling purposes. A more appropriate title would be something like “income taxes assessed by government.” Because the nature of this “expense” is different, the income tax figure is frequently isolated at the bottom of the income statement, separate from true expenses.
Key Takeaway
Financial information is gathered about an organization, but the resulting figures must then be structured in some usable fashion that can be conveyed to interested decision makers. Financial statements serve this purpose. A typical set of financial statements is made up of an income statement, statement of retained earnings, balance sheet, statement of cash flows, and explanatory notes. The income statement reports revenues from the sale of goods and services as well as expenses such as rent and advertising. Gains and losses that arise from incidental activities are also included on the income statement but separately so that the income generated from primary operations is apparent. Cost of goods sold is an expense that reflects the cost of all inventory items acquired by customers. Income tax expense is reported at the bottom of the income statement because it is actually a government assessment rather than a true expense.