This is “Graphing Lines”, chapter 3 from the book Beginning Algebra (v. 1.0). For details on it (including licensing), click here.
For more information on the source of this book, or why it is available for free, please see the project's home page. You can browse or download additional books there. To download a .zip file containing this book to use offline, simply click here.


Chapter 3 Graphing Lines
3.1 Rectangular Coordinate System
Learning Objectives
- Plot points using the rectangular coordinate system.
- Calculate the distance between any two points in the rectangular coordinate plane.
- Determine the midpoint between any two points.
Rectangular Coordinate System
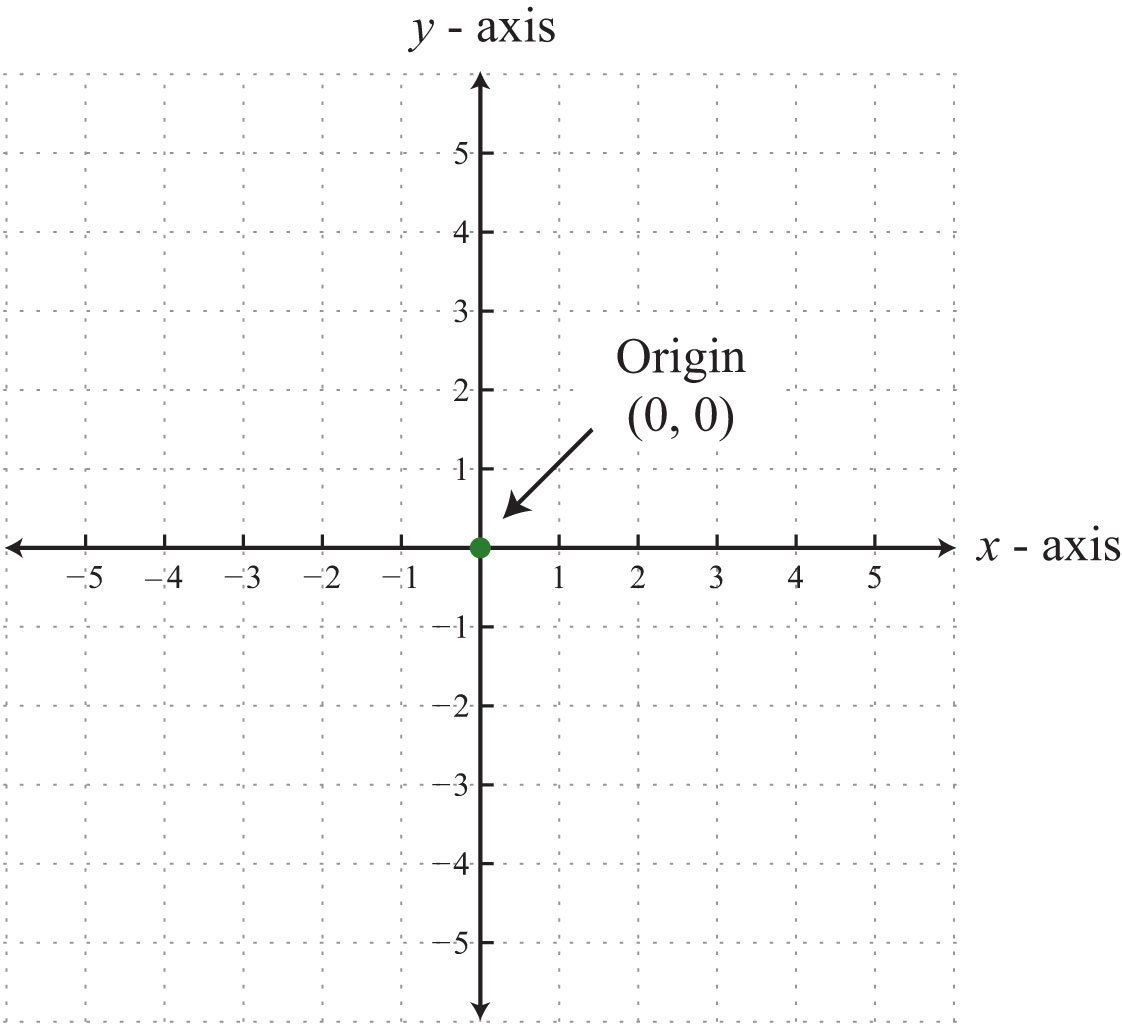
The rectangular coordinate systemA system with two number lines at right angles uniquely specifying points in a plane using ordered pairs (x, y). consists of two real number lines that intersect at a right angle. The horizontal number line is called the x-axisThe horizontal number line used as reference in the rectangular coordinate system., and the vertical number line is called the y-axisThe vertical number line used as reference in the rectangular coordinate system.. These two number lines define a flat surface called a planeThe flat surface defined by the x- and y-axes., and each point on this plane is associated with an ordered pairA pair (x, y) that identifies position relative to the origin on a rectangular coordinate plane. of real numbers (x, y). The first number is called the x-coordinate, and the second number is called the y-coordinate. The intersection of the two axes is known as the originThe point where the x- and y-axes cross, denoted by (0, 0)., which corresponds to the point (0, 0).
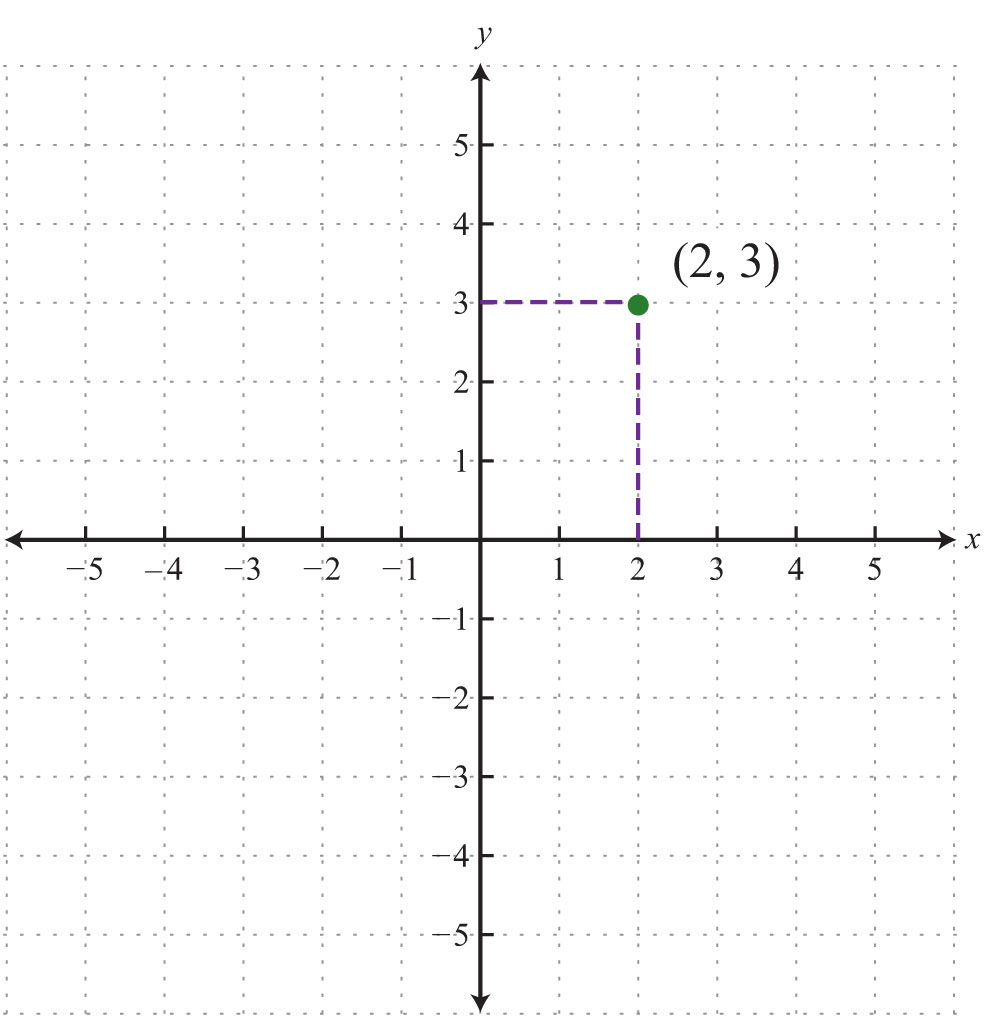
An ordered pair (x, y) represents the position of a point relative to the origin. The x-coordinate represents a position to the right of the origin if it is positive and to the left of the origin if it is negative. The y-coordinate represents a position above the origin if it is positive and below the origin if it is negative. Using this system, every position (point) in the plane is uniquely identified. For example, the pair (2, 3) denotes the position relative to the origin as shown:

Portrait of René Descartes (1596–1650) after Frans Hals, from http://commons.wikimedia.org/wiki/File:Frans_Hals_-_Portret_van_Ren%C3%A9_Descartes.jpg.
This system is often called the Cartesian coordinate systemUsed in honor of René Descartes when referring to the rectangular coordinate system., named after the French mathematician René Descartes (1596–1650).
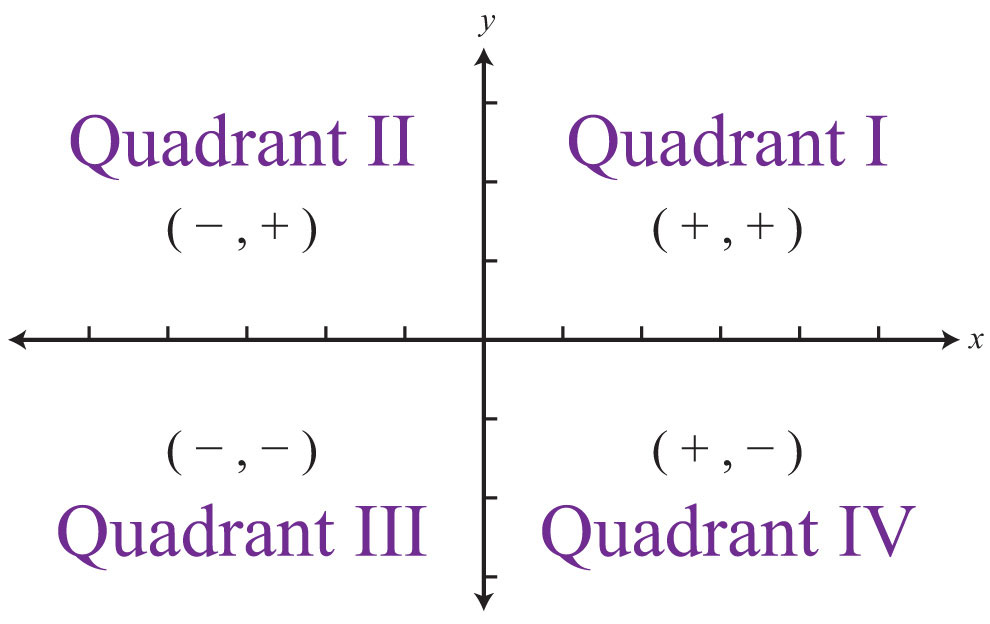
The x- and y-axes break the plane into four regions called quadrantsThe four regions of a rectangular coordinate plane partly bounded by the x- and y-axes and numbered using the roman numerals I, II, III, and IV., named using roman numerals I, II, III, and IV, as pictured. In quadrant I, both coordinates are positive. In quadrant II, the x-coordinate is negative and the y-coordinate is positive. In quadrant III, both coordinates are negative. In quadrant IV, the x-coordinate is positive and the y-coordinate is negative.
Example 1: Plot the ordered pair (−3, 5) and determine the quadrant in which it lies.
Solution: The coordinates and indicate a point 3 units to the left of and 5 units above the origin.
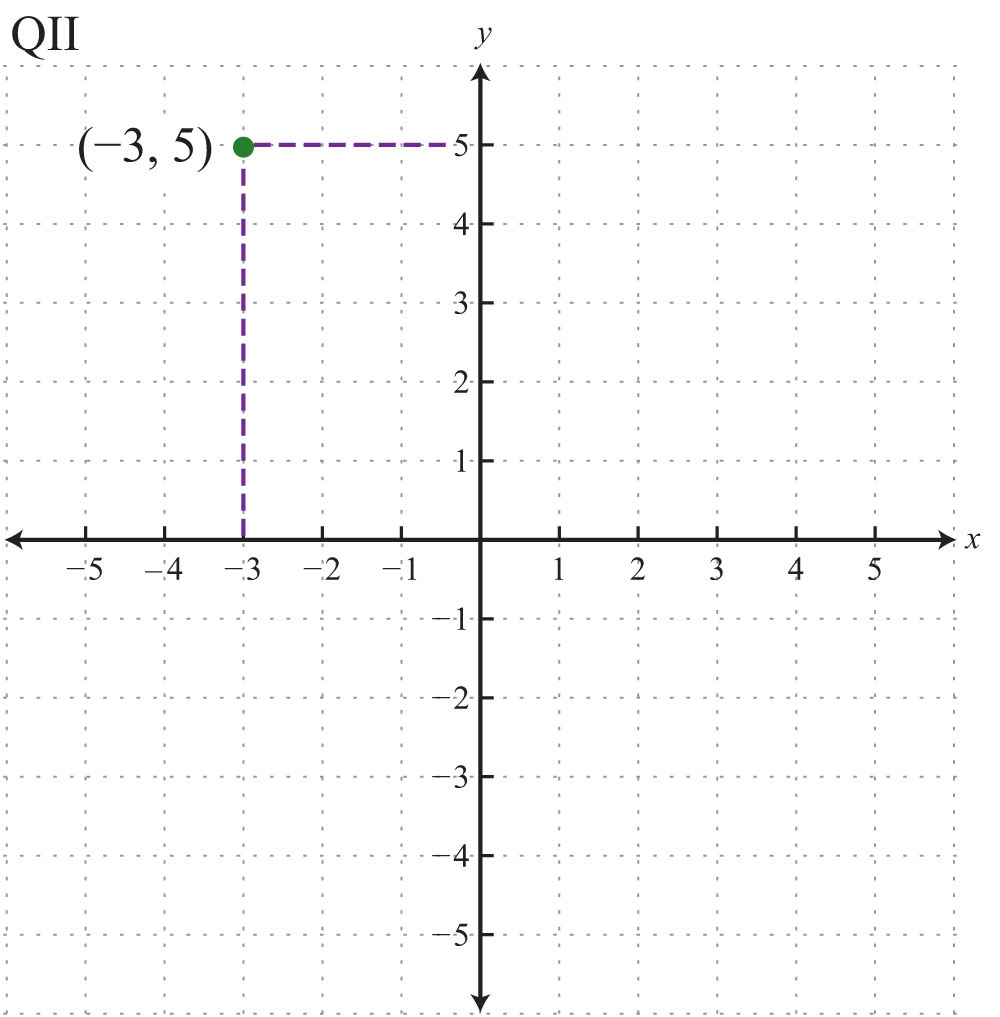
Answer: The point is plotted in quadrant II (QII) because the x-coordinate is negative and the y-coordinate is positive.
Ordered pairs with 0 as one of the coordinates do not lie in a quadrant; these points are on one axis or the other (or the point is the origin if both coordinates are 0). Also, the scale indicated on the x-axis may be different from the scale indicated on the y-axis. Choose a scale that is convenient for the given situation.
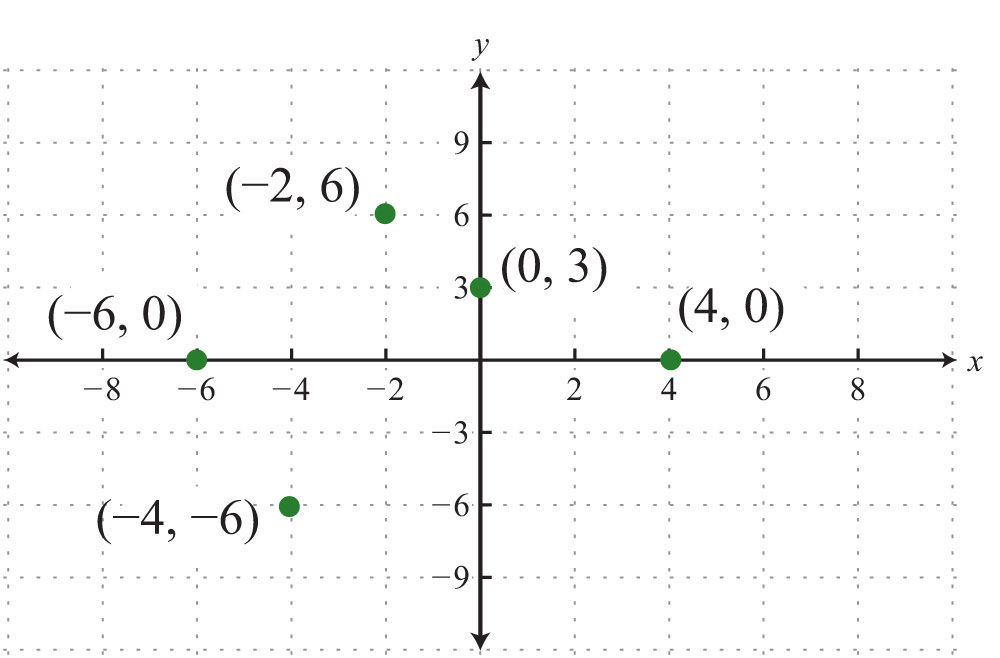
Example 2: Plot this set of ordered pairs: {(4, 0), (−6, 0), (0, 3), (−2, 6), (−4, −6)}.
Solution: Each tick mark on the x-axis represents 2 units and each tick mark on the y-axis represents 3 units.
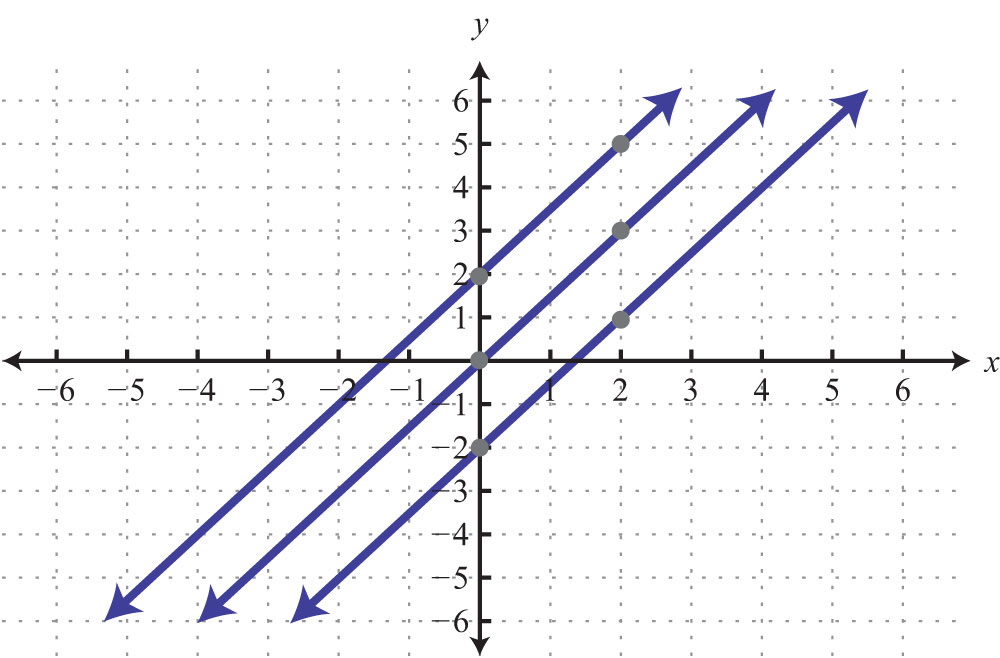
Example 3: Plot this set of ordered pairs: {(−6, −5), (−3, −3), (0, −1), (3, 1), (6, 3)}.
Solution:
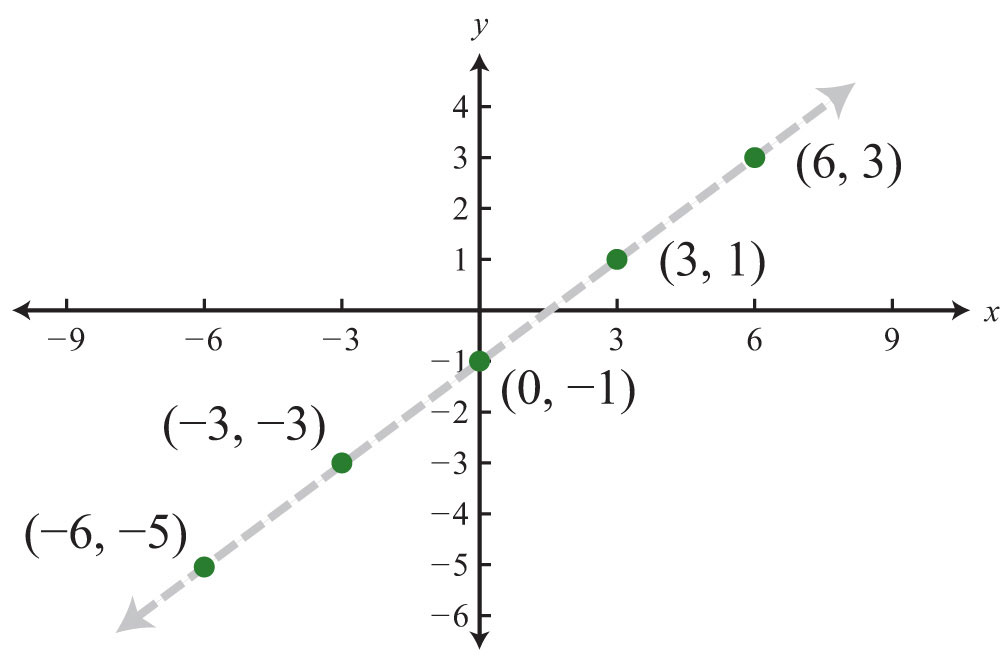
In this example, the points appear to be collinearDescribes points that lie on the same line., or to lie on the same line. The entire chapter focuses on finding and expressing points with this property.
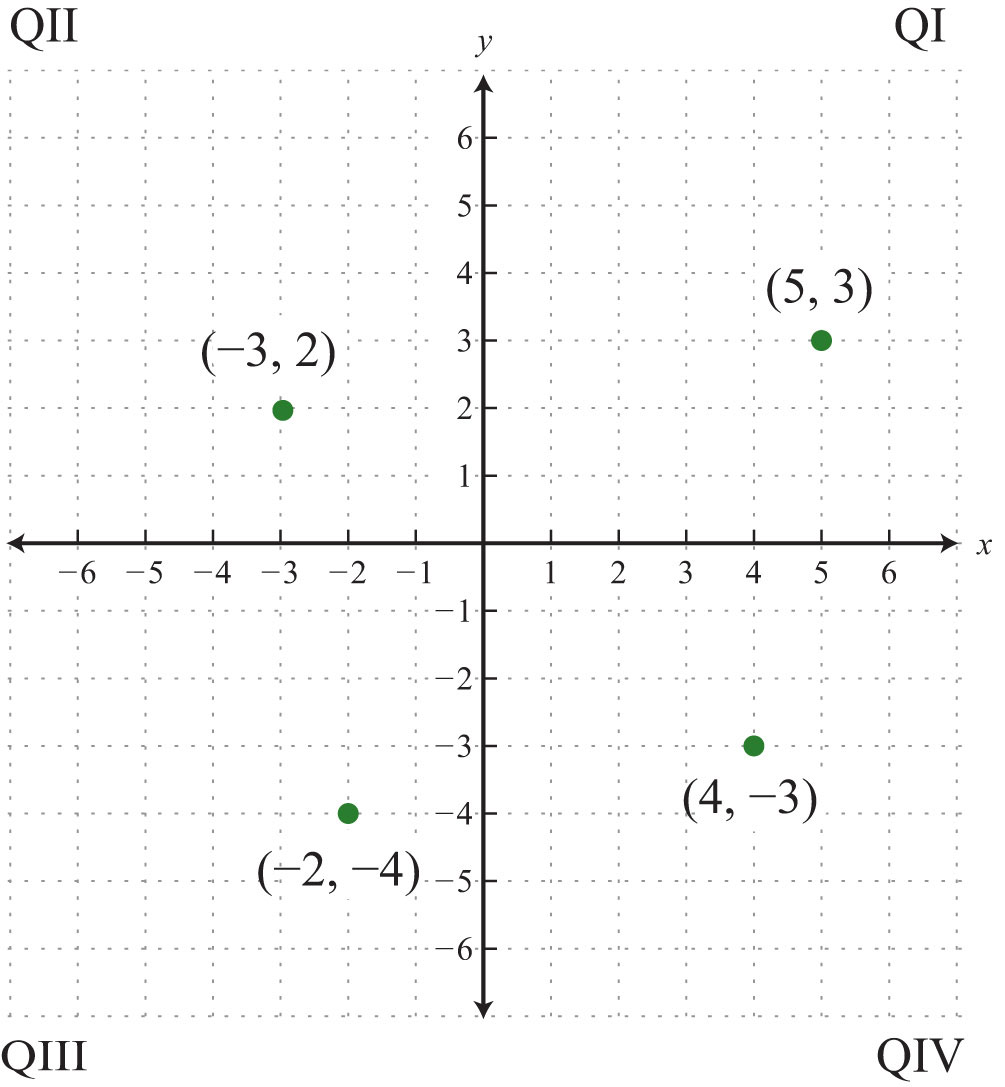
Try this! Plot the set of points {(5, 3), (−3, 2), (−2, −4), (4, −3)} and indicate in which quadrant they lie. ([Link: Click here for printable graph paper in PDF.])
Answer:
Video Solution
(click to see video)Graphs are used in everyday life to display data visually. A line graphA set of related data values graphed on a coordinate plane and connected by line segments. consists of a set of related data values graphed on a coordinate plane and connected by line segments. Typically, the independent quantity, such as time, is displayed on the x-axis and the dependent quantity, such as distance traveled, on the y-axis.
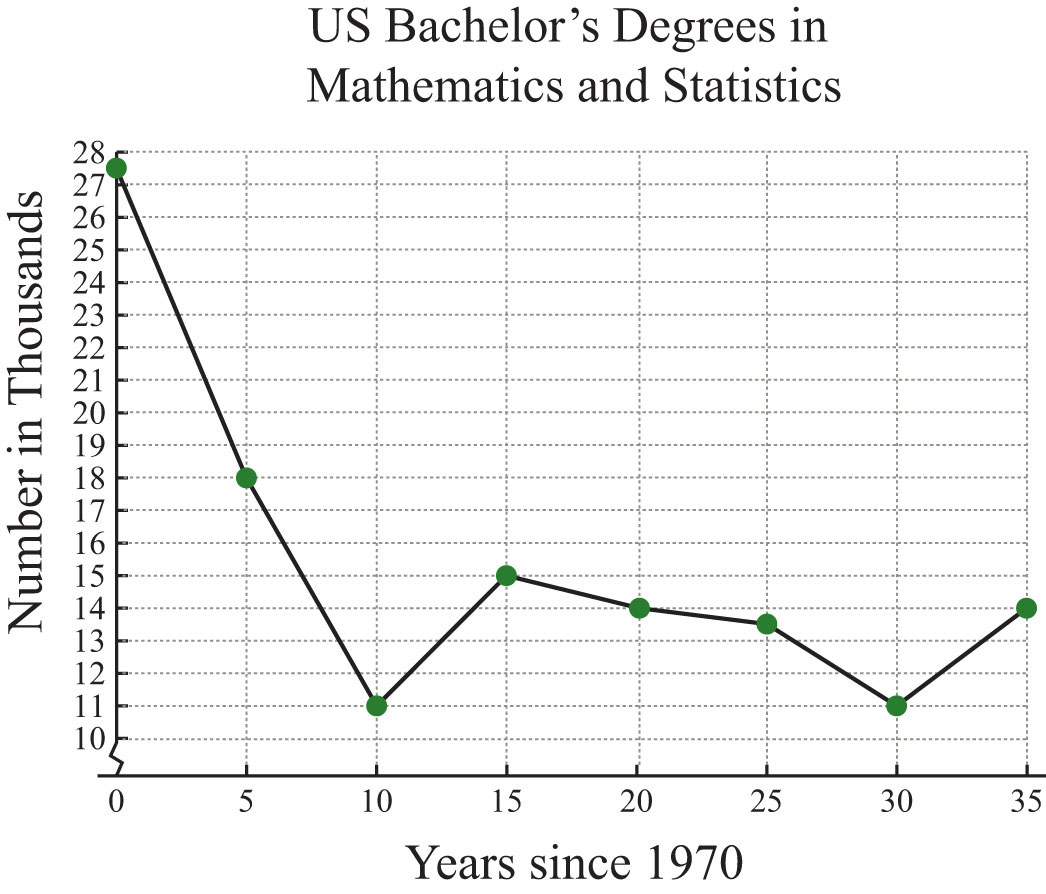
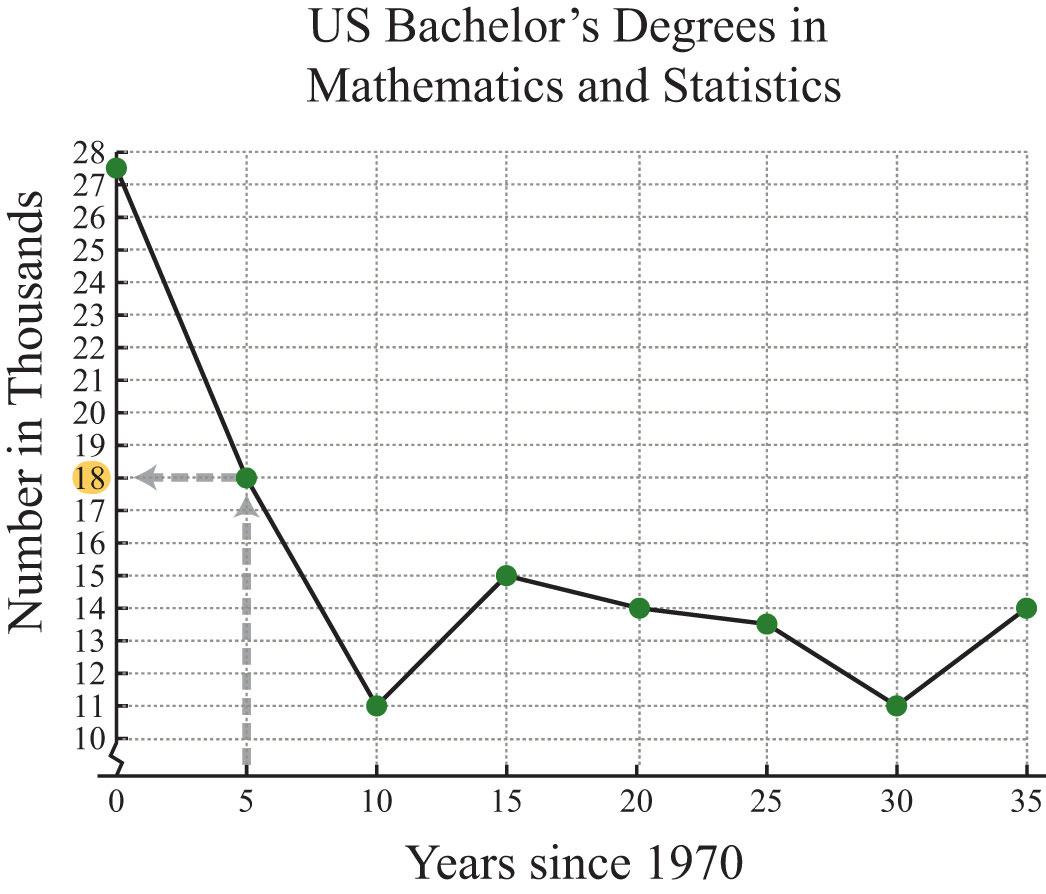
Example 4: The following line graph shows the number of mathematics and statistics bachelor’s degrees awarded in the United States each year since 1970.
Source: Digest of Education Statistics.
a. How many mathematics and statistics bachelor’s degrees were awarded in 1975?
b. In which years were the number of mathematics and statistics degrees awarded at the low of 11,000?
Solution:
a. The scale on the x-axis represents time since 1970, so to determine the number of degrees awarded in 1975, read the y-value of the graph at x = 5.
Source: Digest of Education Statistics.
The y-value corresponding to x = 5 is 18. The graph indicates that this is in thousands; there were 18,000 mathematics and statistics degrees awarded in 1975.
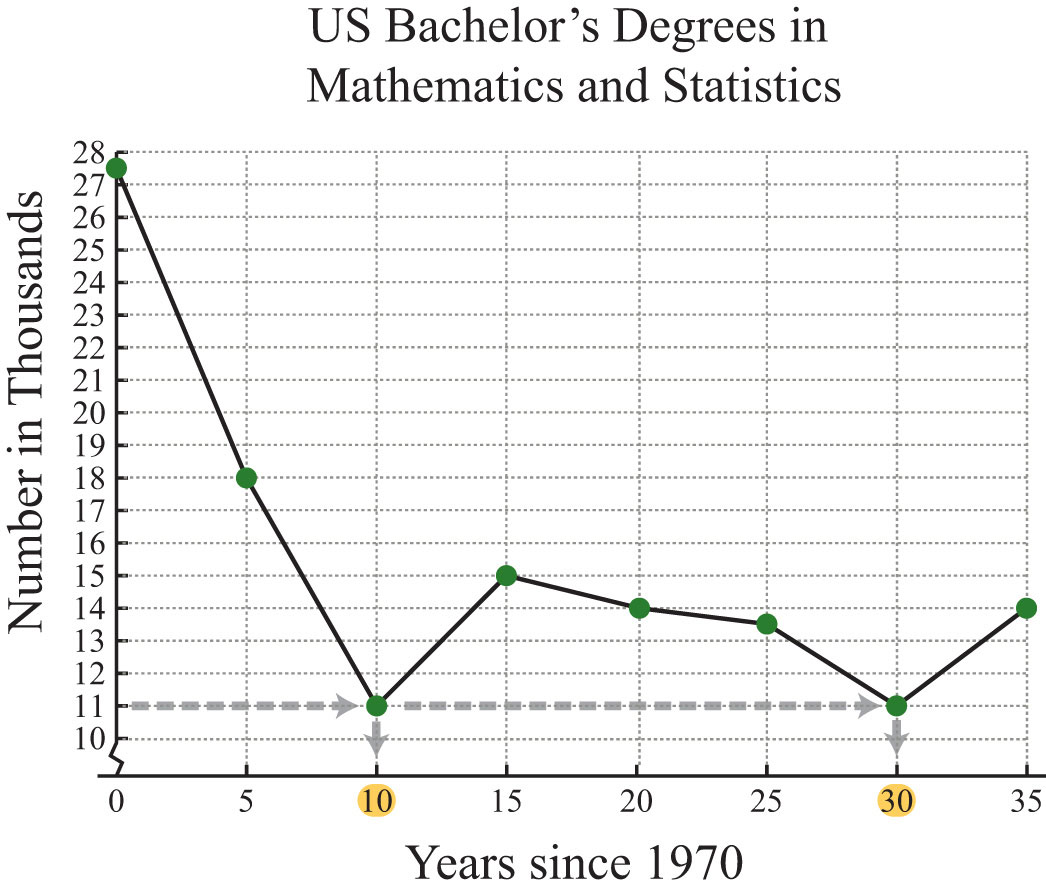
b. To find the year a particular number of degrees was awarded, first look at the y-axis. In this case, 11,000 degrees is represented by 11 on the y-axis; look to the right to see in which years this occurred.
Source: Digest of Education Statistics.
The y-value of 11 occurs at two data points, one where x = 10 and the other where x = 30. These values correspond to the years 1980 and 2000, respectively.
Answers:
a. In the year 1975, 18,000 mathematics and statistics degrees were awarded.
b. In the years 1980 and 2000, the lows of 11,000 mathematics and statistics degrees were awarded.
Distance Formula
Frequently you need to calculate the distance between two points in a plane. To do this, form a right triangle using the two points as vertices of the triangle and then apply the Pythagorean theorem. Recall that the Pythagorean theoremGiven any right triangle with legs measuring a and b units and hypotenuse measuring c units, then . states that if given any right triangle with legs measuring a and b units, then the square of the measure of the hypotenuse c is equal to the sum of the squares of the legs: . In other words, the hypotenuse of any right triangle is equal to the square root of the sum of the squares of its legs.

Example 5: Find the distance between (−1, 2) and (3, 5).
Solution: Form a right triangle by drawing horizontal and vertical lines through the two points. This creates a right triangle as shown below:
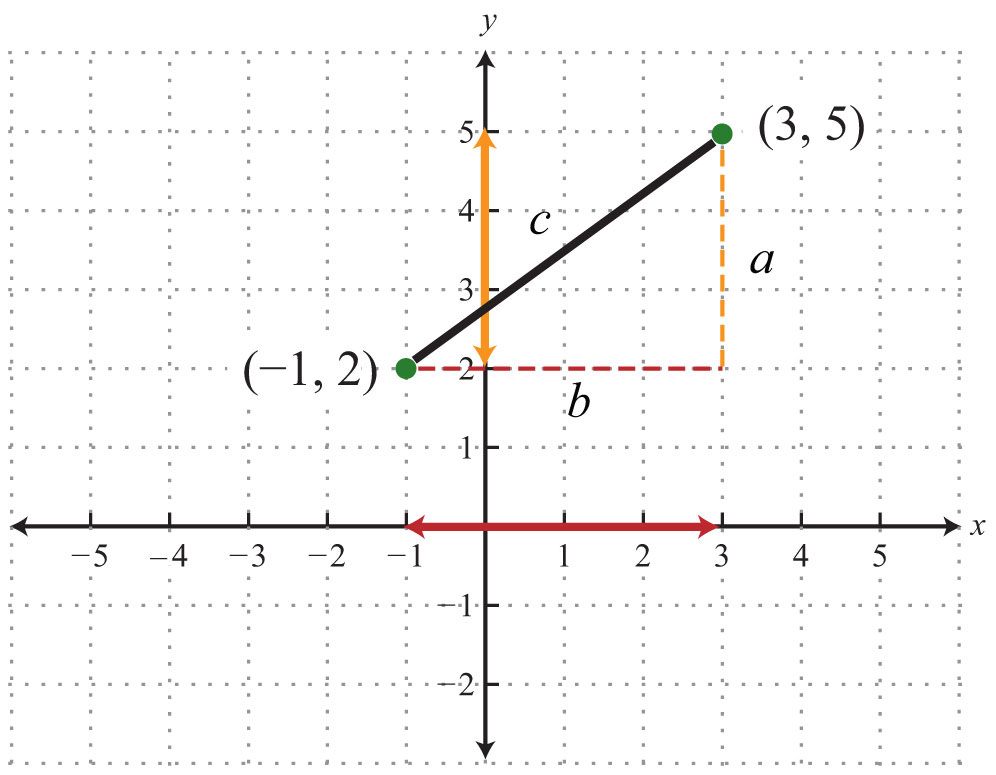
The length of leg b is calculated by finding the distance between the x-values of the given points, and the length of leg a is calculated by finding the distance between the given y-values.

Next, use the Pythagorean theorem to find the length of the hypotenuse.

Answer: The distance between the two points is 5 units.
Generalize this process to produce a formula that can be used to algebraically calculate the distance between any two given points.

Given two points, and , then the distance, d, between them is given by the distance formulaGiven two points and , calculate the distance d between them using the formula :
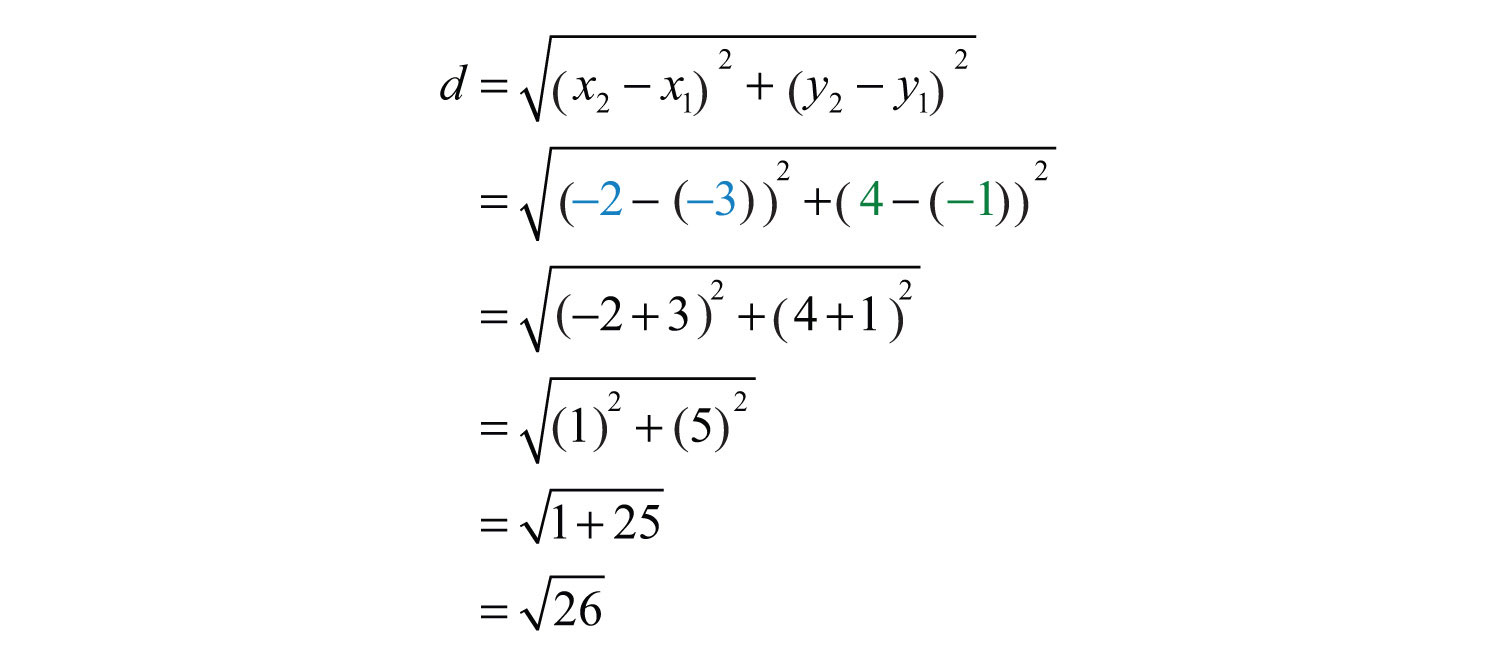
Example 6: Calculate the distance between (−3, −1) and (−2, 4).
Solution: Use the distance formula.

It is a good practice to include the formula in its general form as a part of the written solution before substituting values for the variables. This improves readability and reduces the chance for errors.
Answer: units
Try this! Calculate the distance between (−7, 5) and (−1, 13).
Answer: 10 units
Video Solution
(click to see video)
Example 7: Do the three points (1, −1), (3, −3), and (3, 1) form a right triangle?
Solution: The Pythagorean theorem states that having side lengths that satisfy the property is a necessary and sufficient condition of right triangles. In other words, if you can show that the sum of the squares of the leg lengths of the triangle is equal to the square of the length of the hypotenuse, then the figure must be a right triangle. First, calculate the length of each side using the distance formula.
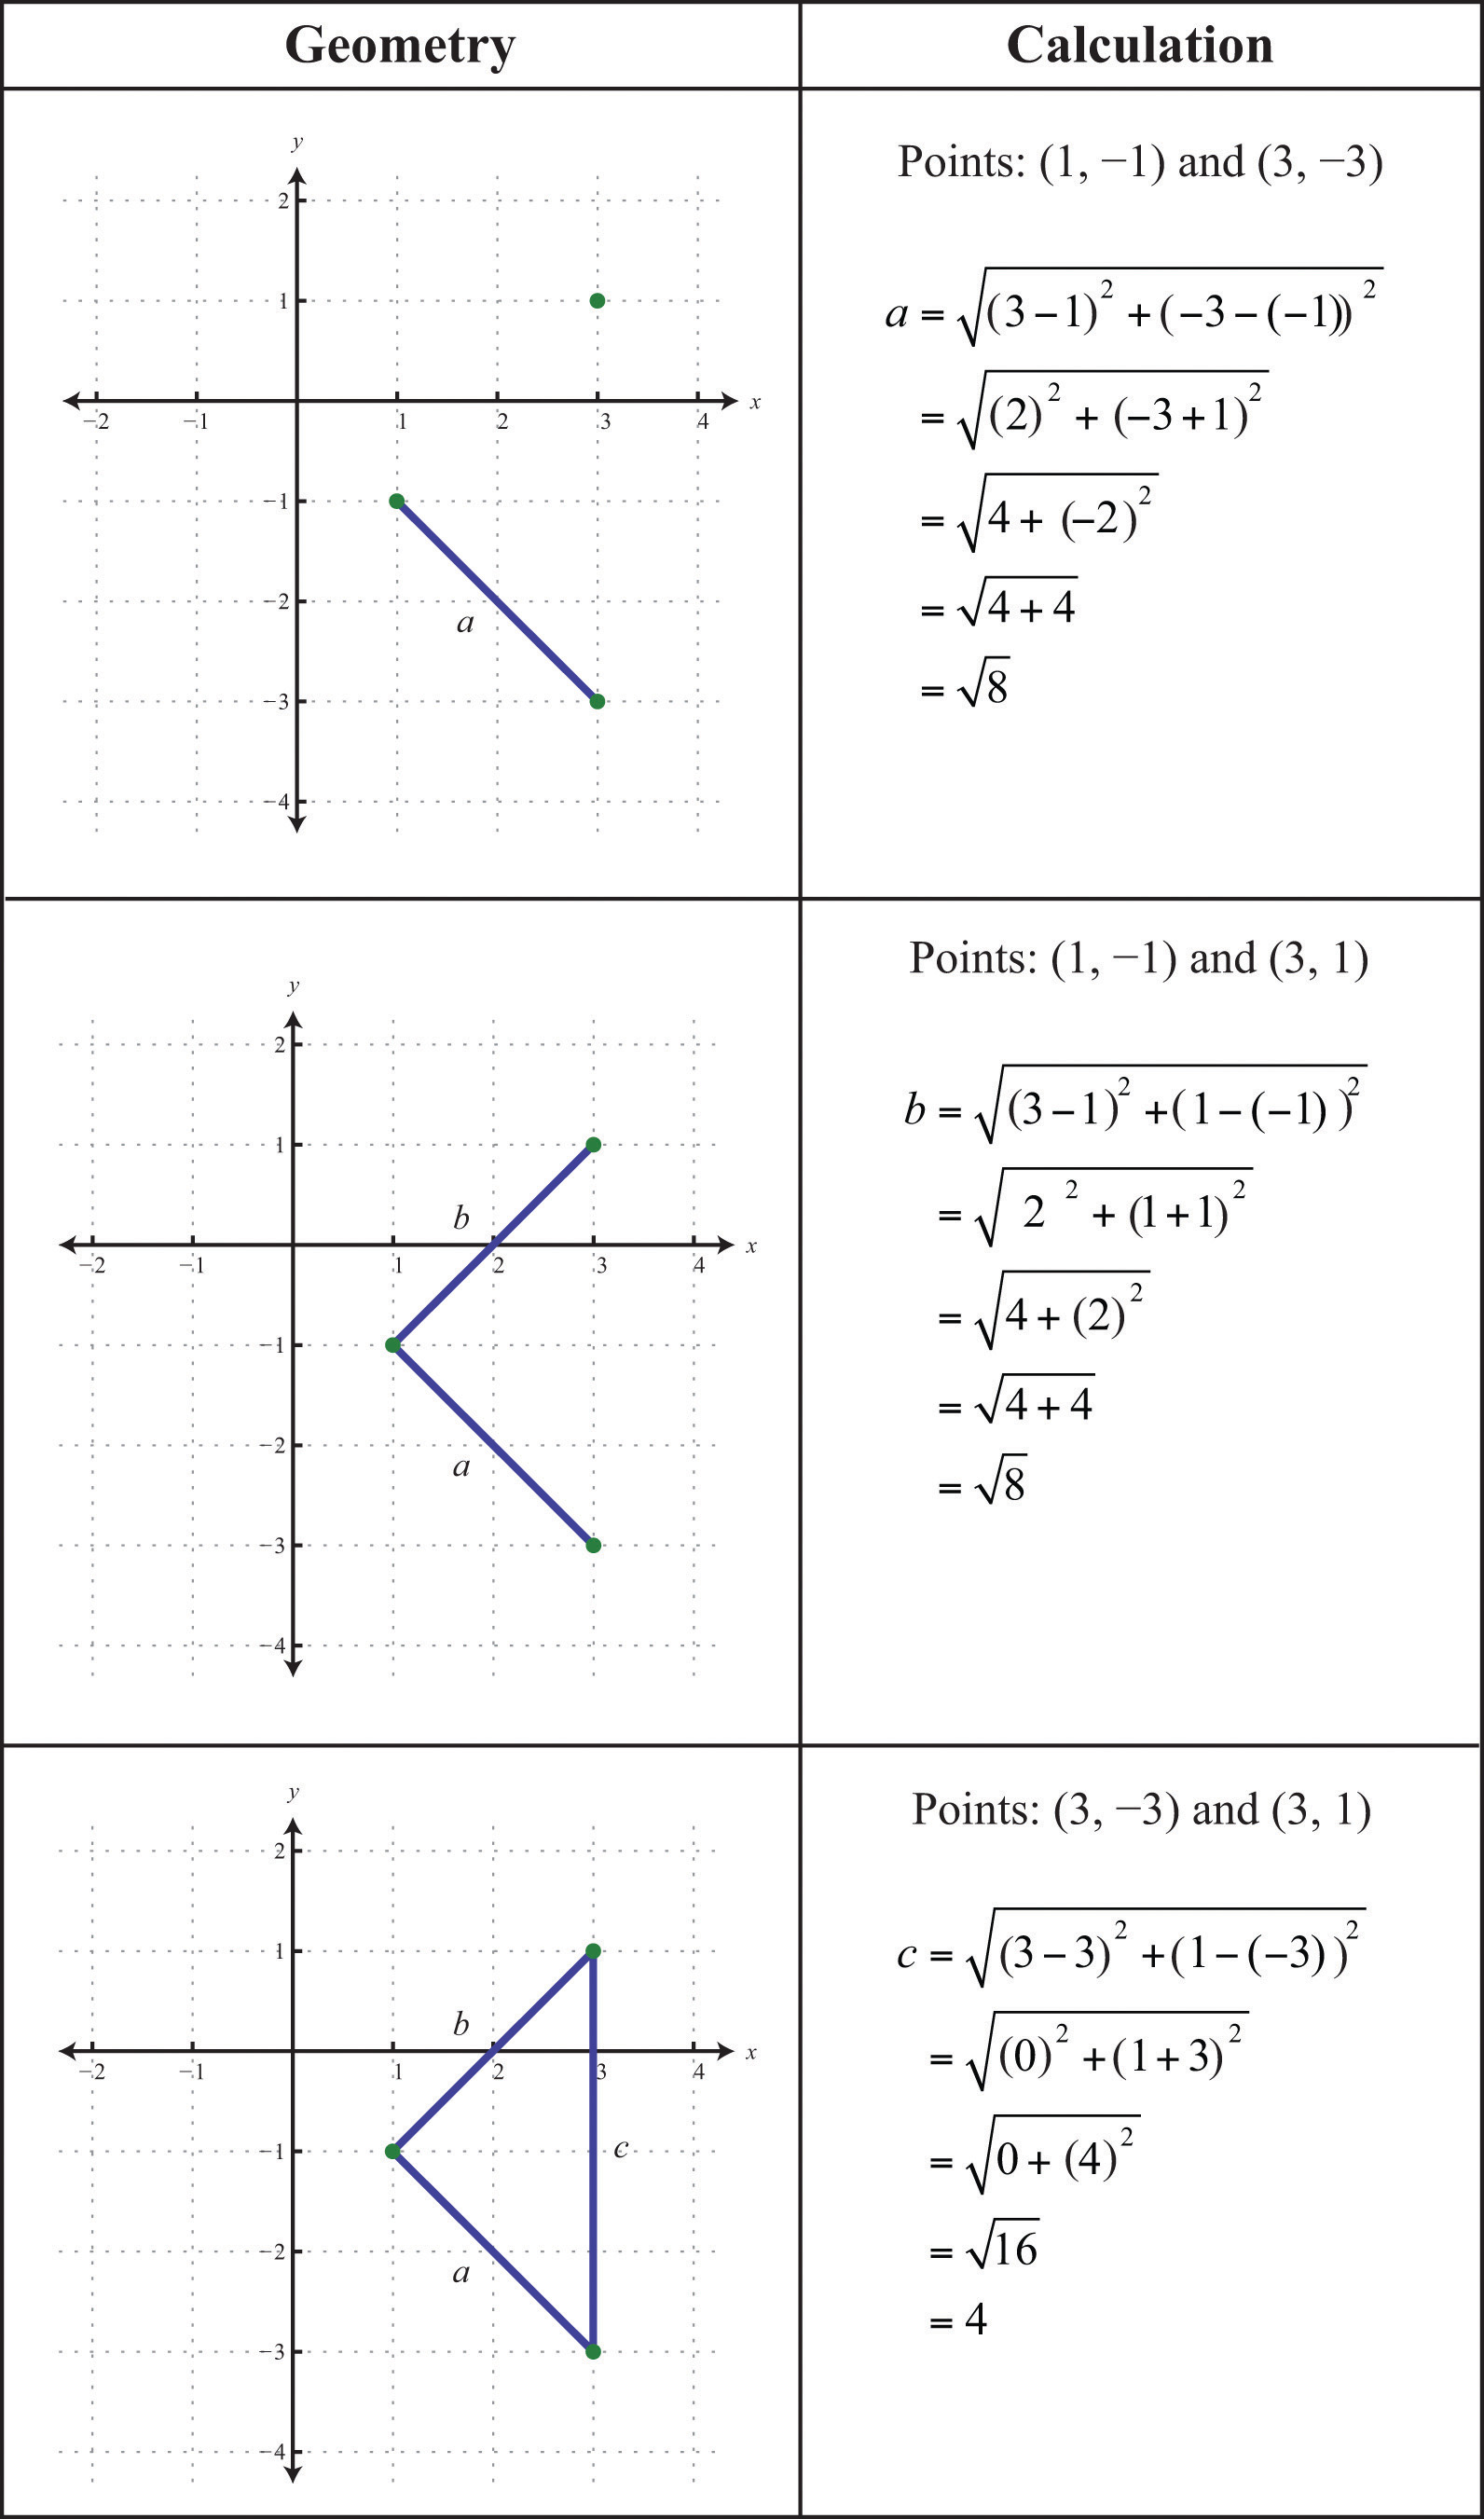
Now we check to see if .

Answer: Yes, the three points form a right triangle. In fact, since two of the legs are equal in length, the points form an isosceles right triangle.
Midpoint Formula
The point that bisects the line segment formed by two points, and , is called the midpointGiven two points, and , the midpoint is an ordered pair given by . and is given by the following formula:

The midpoint is an ordered pair formed by finding the average of the x-values and the average of the y-values of the given points.
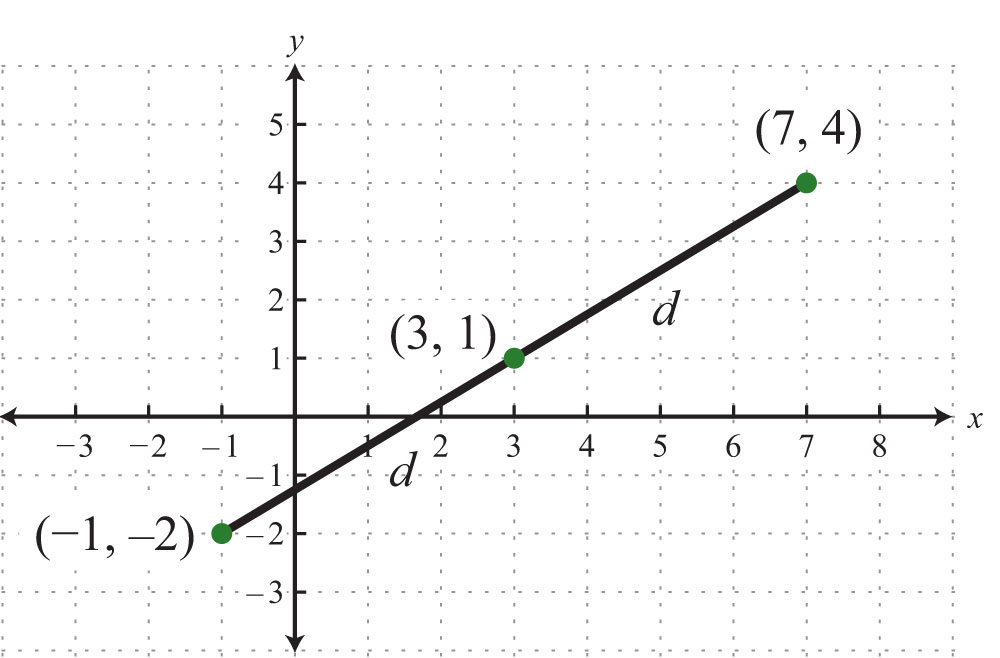
Example 8: Calculate the midpoint between (−1, −2) and (7, 4).
Solution: First, calculate the average of the x- and y-values of the given points.
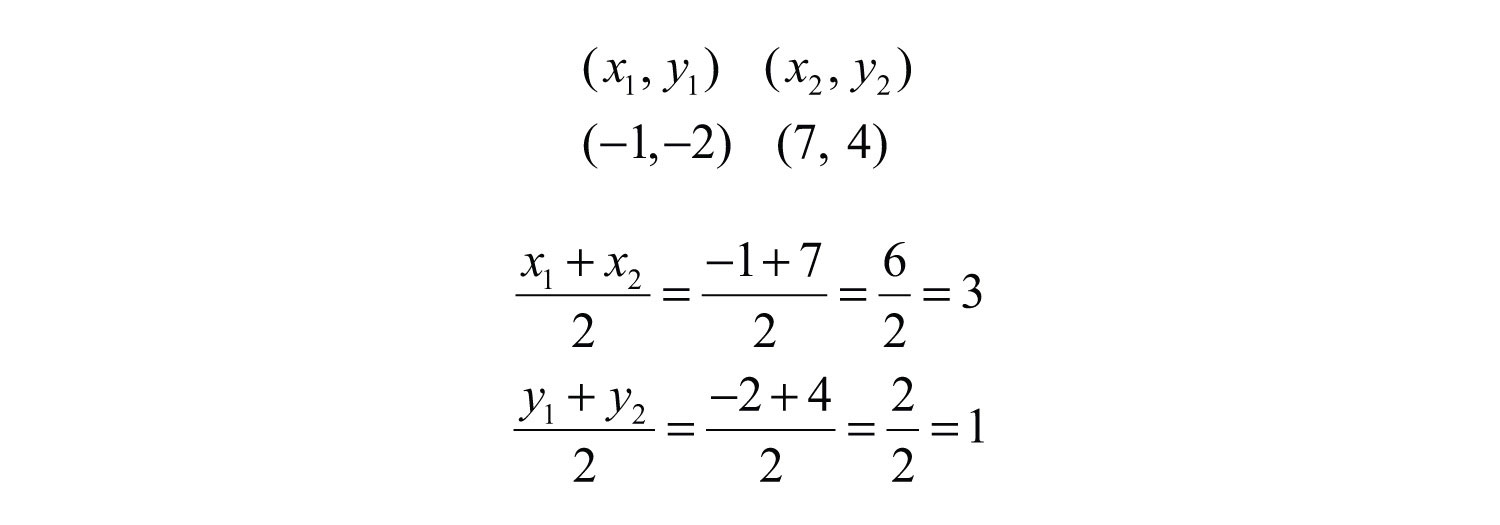
Next, form the midpoint as an ordered pair using the averaged coordinates.

Answer: (3, 1)
To verify that this is indeed the midpoint, calculate the distance between the two given points and verify that the result is equal to the sum of the two equal distances from the endpoints to this midpoint. This verification is left to the reader as an exercise.
Try this! Find the midpoint between (−6, 5) and (6, −11).
Answer: (0, −3)
Video Solution
(click to see video)Key Takeaways
- Use the rectangular coordinate system to uniquely identify points in a plane using ordered pairs (x, y). Ordered pairs indicate position relative to the origin. The x-coordinate indicates position to the left and right of the origin. The y-coordinate indicates position above or below the origin.
- The scales on the x-axis and y-axis may be different. Choose a scale for each axis that is appropriate for the given problem.
- Graphs are used to visualize real-world data. Typically, independent data is associated with the x-axis and dependent data is associated with the y-axis.
- The Pythagorean theorem gives us a necessary and sufficient condition of right triangles. Given a right triangle, then the measures of the sides satisfy . Conversely, if the sides satisfy , then the triangle must be a right triangle.
- The distance formula, , is derived from the Pythagorean theorem and gives us the distance between any two points, and , in a rectangular coordinate plane.
- The midpoint formula, , is derived by taking the average of each coordinate and forming an ordered pair.
Topic Exercises
Part A: Ordered Pairs
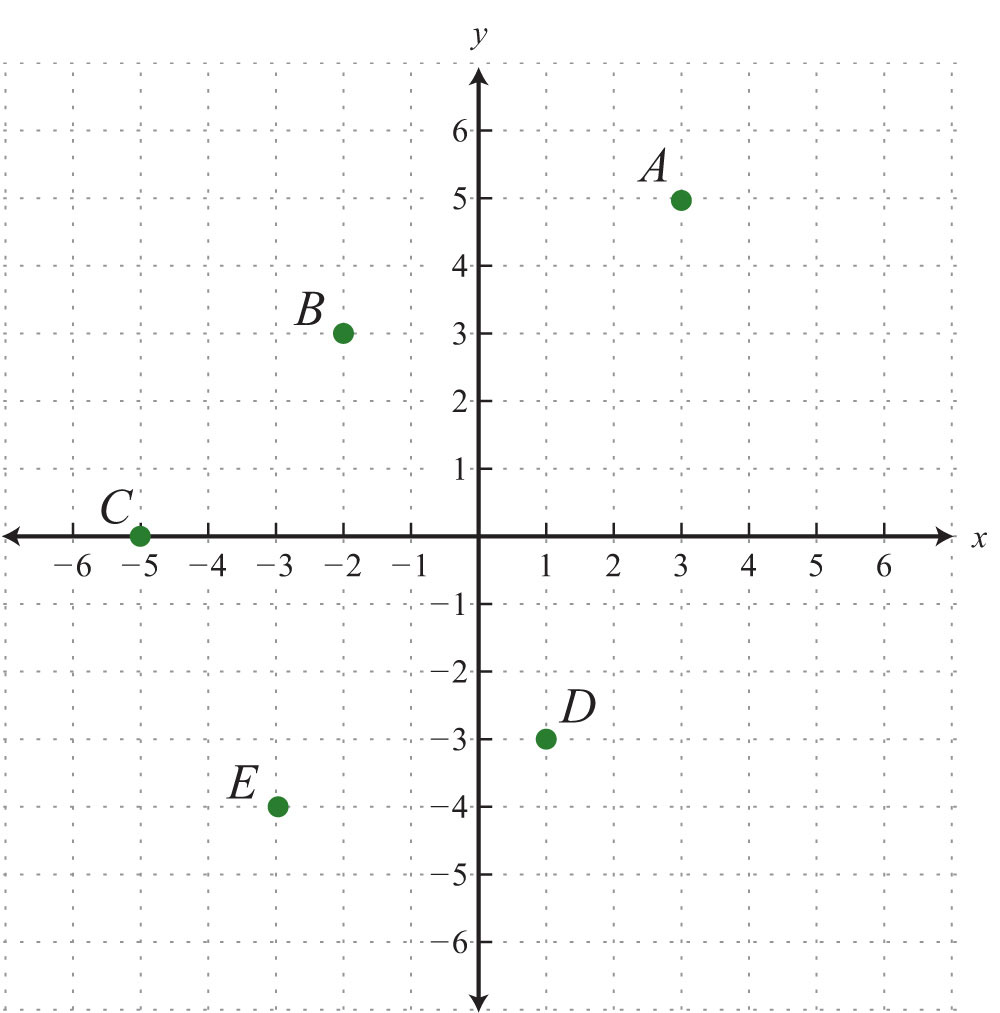
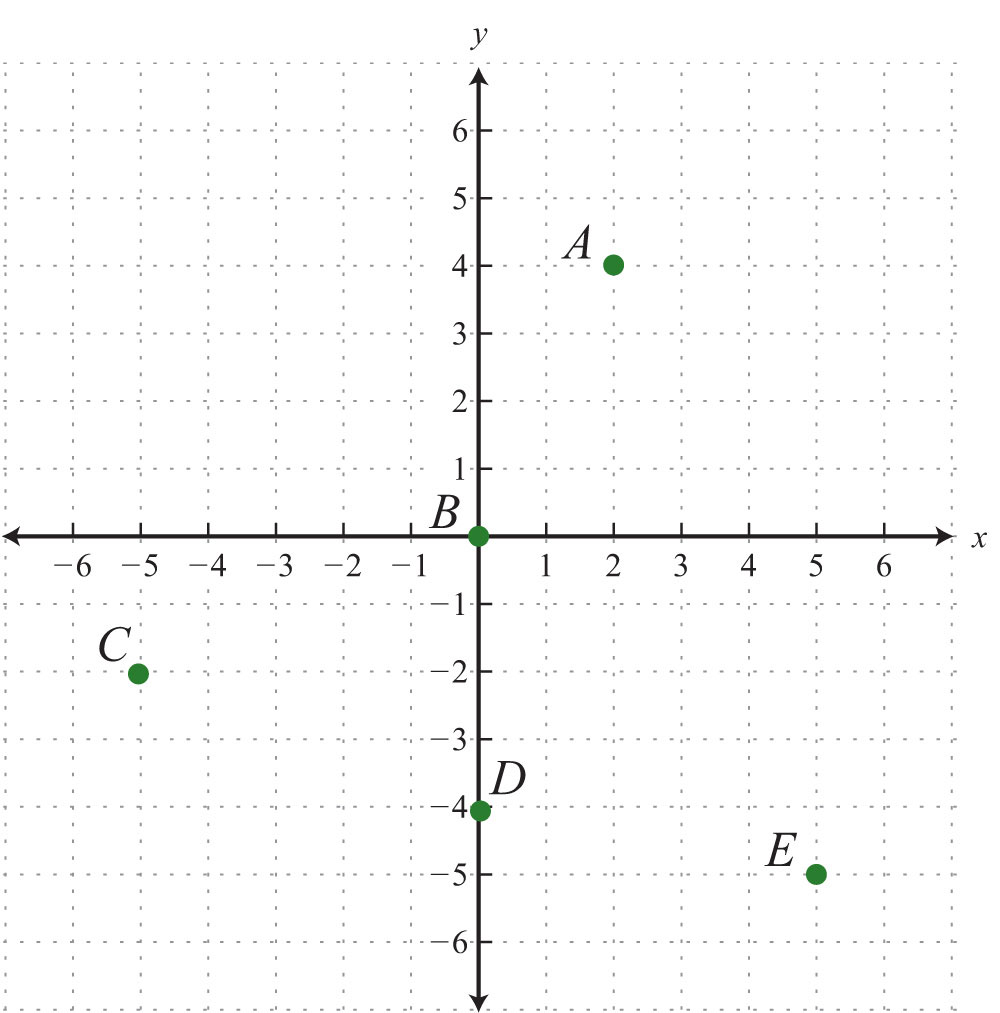
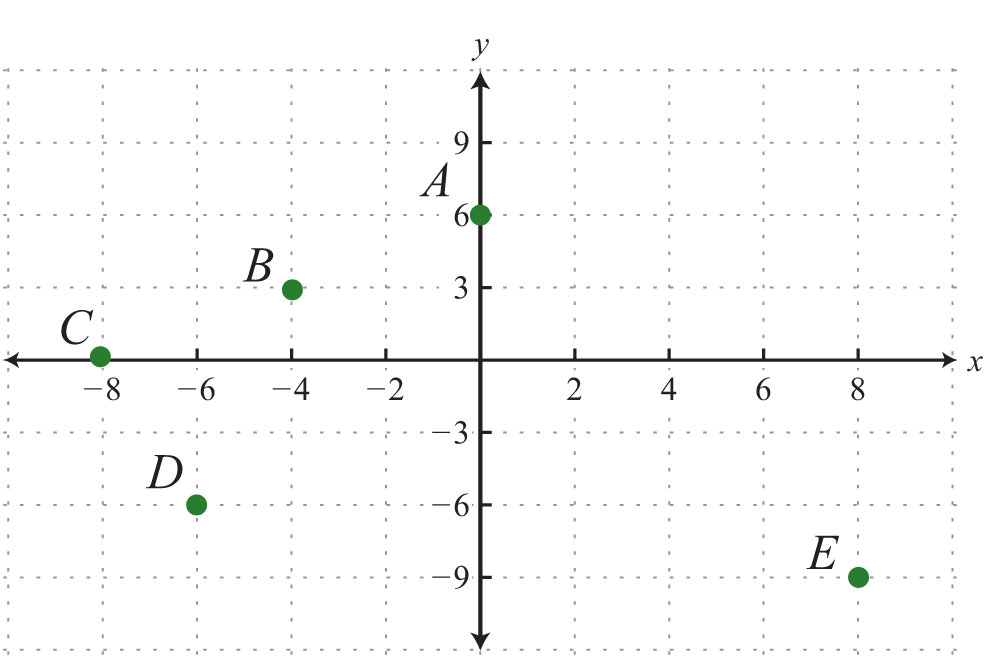
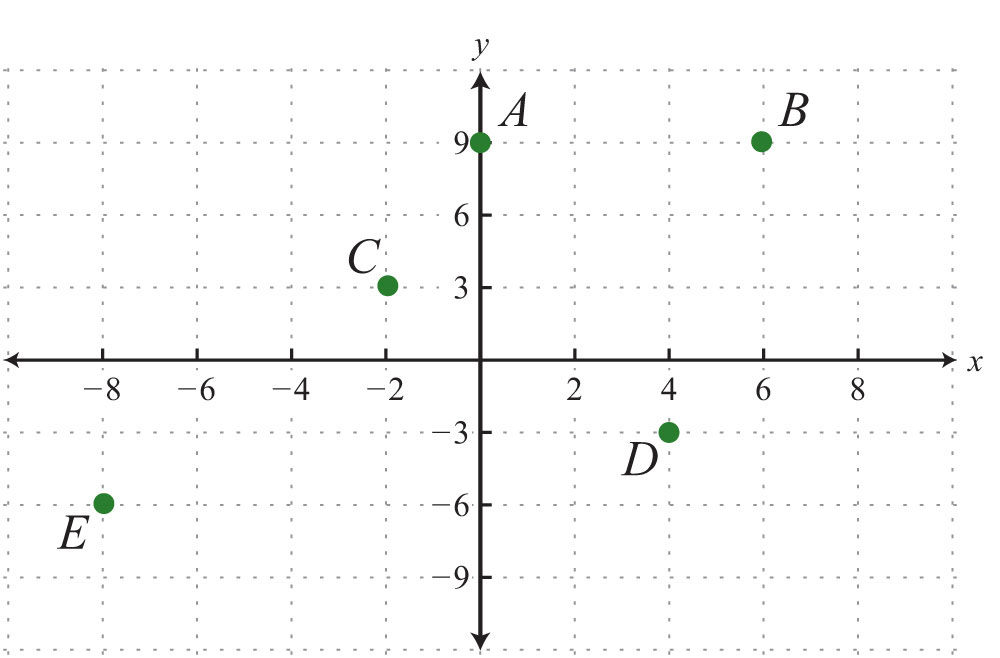
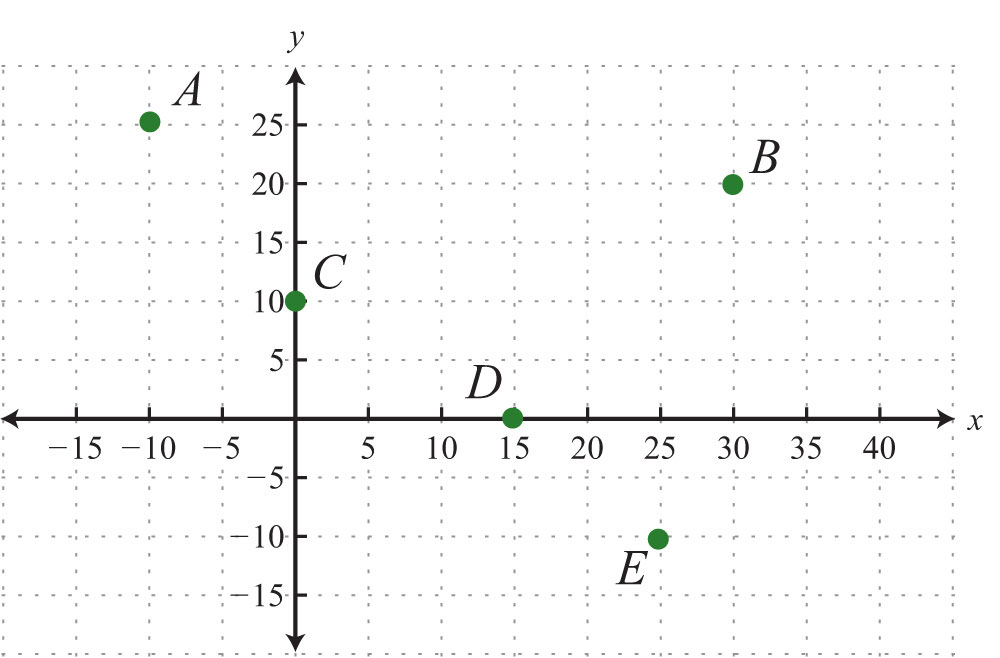
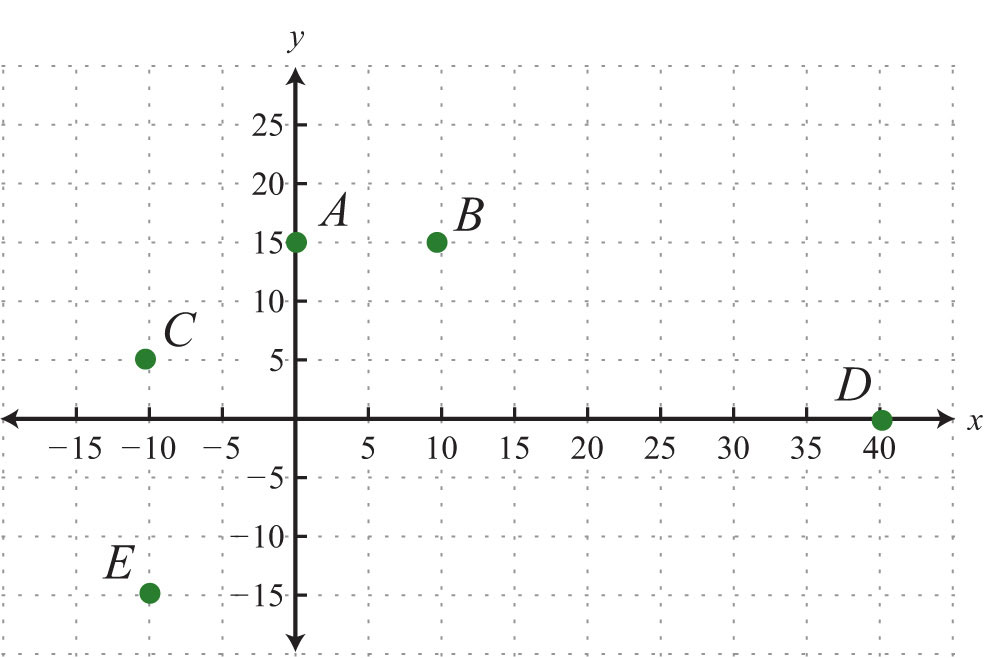
Give the coordinates of points A, B, C, D, and E.
1.
2.
3.
4.
5.
6.
Graph the given set of ordered pairs.
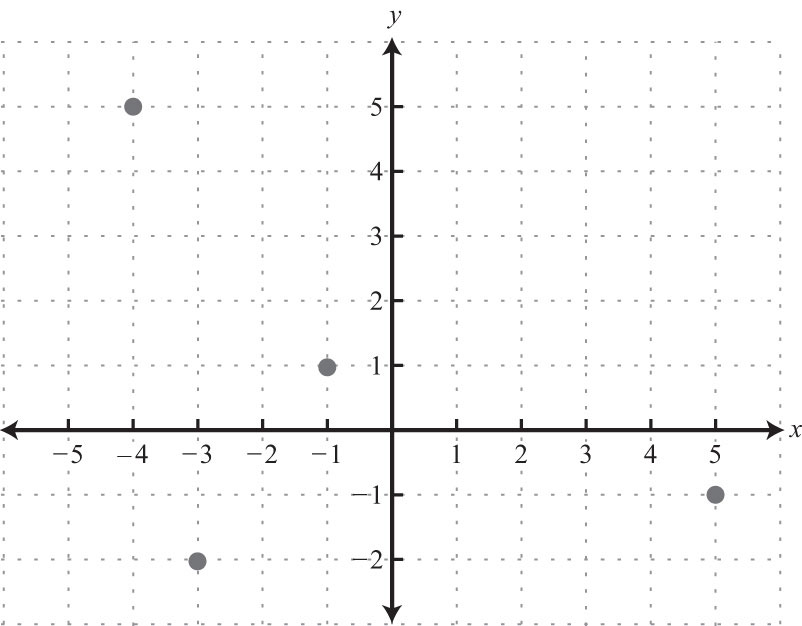
7. {(−4, 5), (−1, 1), (−3, −2), (5, −1)}
8. {(−15, −10), (−5, 10), (15, 10), (5, −10)}
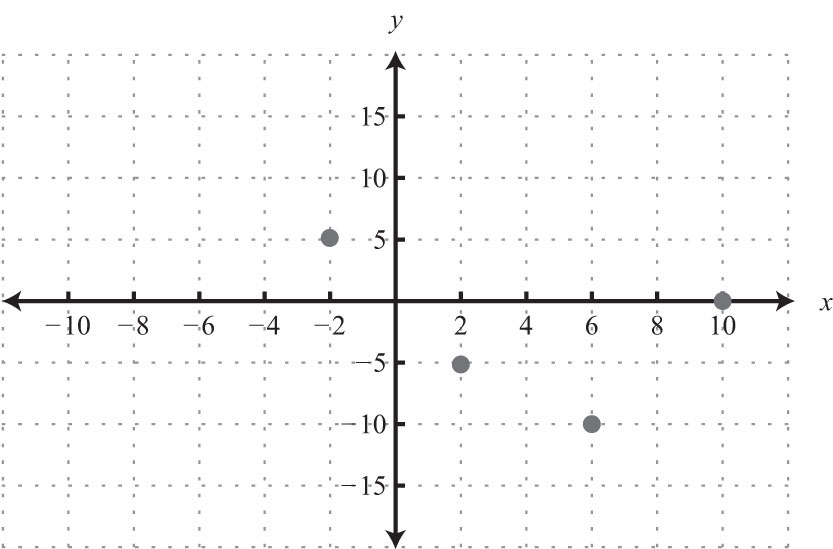
9. {(−2, 5), (10, 0), (2, −5), (6, −10)}
10. {(−8, 3), (−4, 6), (0, −6), (6, 9)}
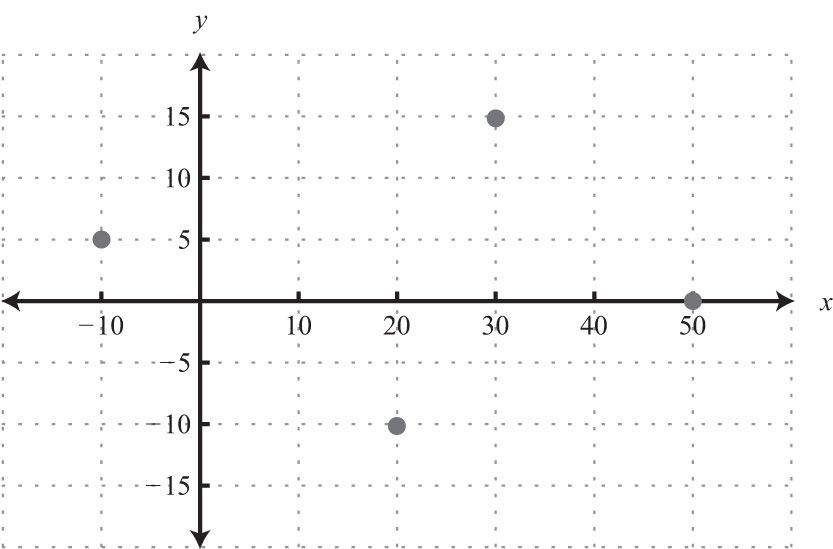
11. {(−10, 5), (20, −10), (30, 15), (50, 0)}
12.
13.
14. {(−3.5, 0), (−1.5, 2), (0, 1.5), (2.5, −1.5)}
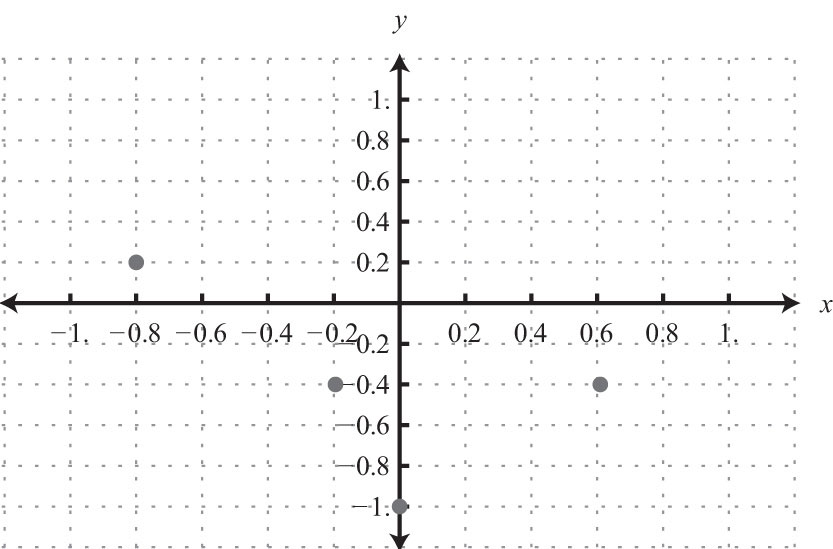
15. {(−0.8, 0.2), (−0.2, −0.4), (0, −1), (0.6, −0.4)}
16. {(−1.2, −1.2), (−0.3, −0.3), (0, 0), (0.6, 0.6), (1.2, 1.2)}
State the quadrant in which the given point lies.
17. (−3, 2)
18. (5, 7)
19. (−12, −15)
20. (7, −8)
21. (−3.8, 4.6)
22. (17.3, 1.9)
23.
24.
25.
26.
27.
28.
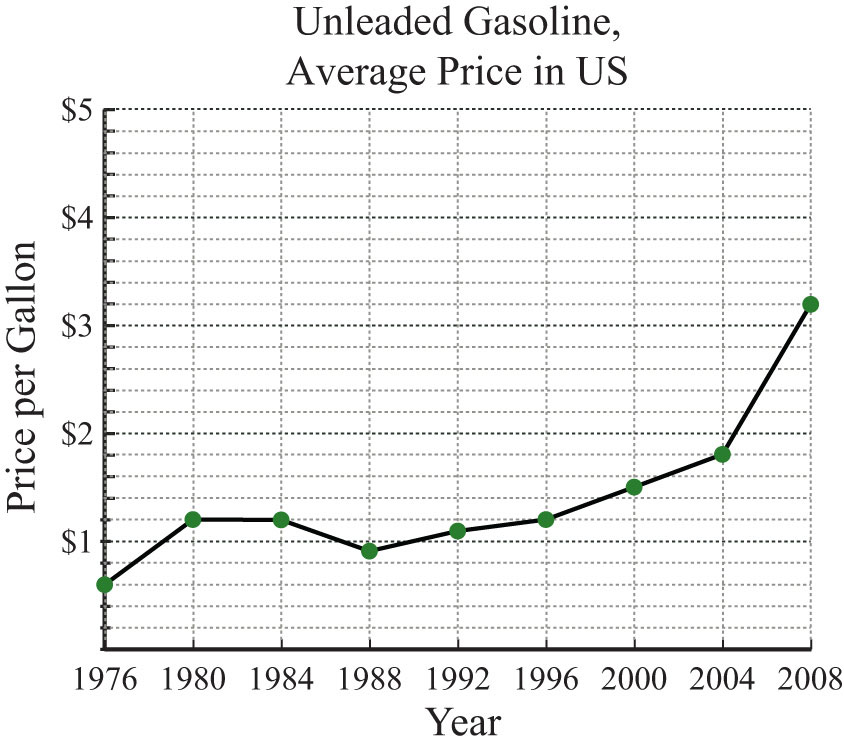
The average price of a gallon of regular unleaded gasoline in US cities is given in the following line graph. Use the graph to answer the following questions.
Source: Bureau of Labor Statistics.
29. What was the average price of a gallon of unleaded gasoline in 2004?
30. What was the average price of a gallon of unleaded gasoline in 1976?
31. In which years were the average price of a gallon of unleaded gasoline $1.20?
32. What is the price increase of a gallon of gasoline from 1980 to 2008?
33. What was the percentage increase in the price of a gallon of unleaded gasoline from 1976 to 1980?
34. What was the percentage increase in the price of a gallon of unleaded gasoline from 2000 to 2008?
The average price of all-purpose white flour in US cities from 1980 to 2008 is given in the following line graph. Use the graph to answer the questions that follow.
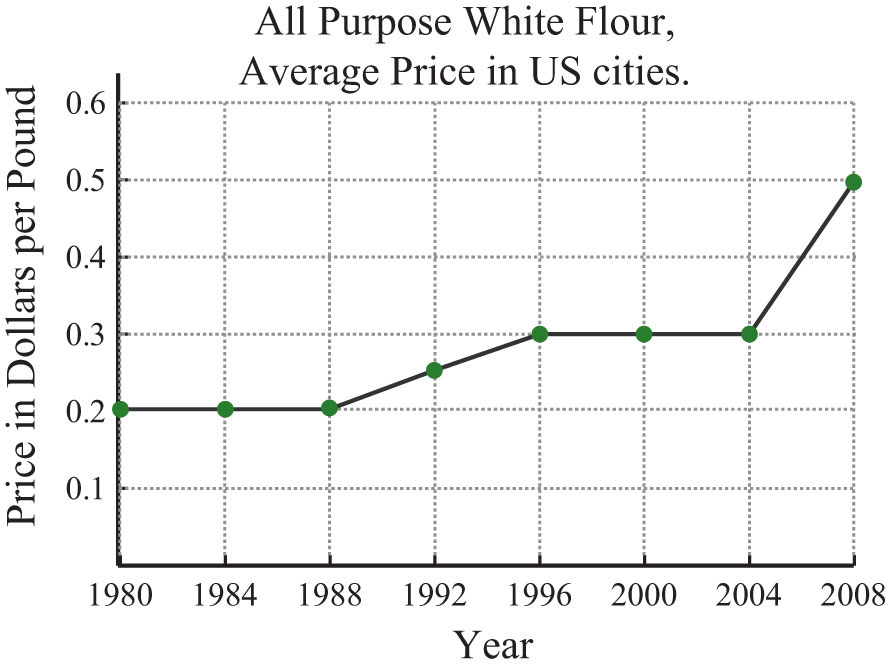
Source: Bureau of Labor Statistics.
35. What was the average price per pound of all-purpose white flour in 2000?
36. What was the average price per pound of all-purpose white flour in 2008?
37. In which year did the price of flour average $0.25 per pound?
38. In which years did the price of flour average $0.20 per pound?
39. What was the percentage increase in flour from the year 2000 to 2008?
40. What was the percentage increase in flour from the year 1992 to 2000?
Given the following data, create a line graph.
41. The percentage of total high school graduates who enrolled in college.
| Year | Percentage |
|---|---|
| 1969 | 36% |
| 1979 | 40% |
| 1989 | 47% |
| 1999 | 42% |
Source: Digest of Education Statistics.
42. The average daily temperature given in degrees Fahrenheit in May.
| Exam | Temperature |
|---|---|
| 8:00 am | 60 |
| 12:00 pm | 72 |
| 4:00 pm | 75 |
| 8:00 pm | 67 |
| 12:00 am | 60 |
| 4:00 am | 55 |
Calculate the area of the shape formed by connecting the following set of vertices.
43. {(0, 0), (0, 3), (5, 0), (5, 3)}
44. {(−1, −1), (−1, 1), (1, −1), (1, 1)}
45. {(−2, −1), (−2, 3), (5, 3), (5, −1)}
46. {(−5, −4), (−5, 5), (3, 5), (3, −4)}
47. {(0, 0), (4, 0), (2, 2)}
48. {(−2, −2), (2, −2), (0, 2)}
49. {(0, 0), (0, 6), (3, 4)}
50. {(−2, 0), (5, 0), (3, −3)}
Part B: Distance Formula
Calculate the distance between the given two points.
51. (−5, 3) and (−1, 6)
52. (6, −2) and (−2, 4)
53. (0, 0) and (5, 12)
54. (−6, −8) and (0, 0)
55. (−7, 8) and (5, −1)
56. (−1, −2) and (9, 22)
57. (−1, 2) and (−7/2, −4)
58. and
59. and
60. and
61. (1, 2) and (4, 3)
62. (2, −4) and (−3, −2)
63. (−1, 5) and (1, −3)
64. (1, −7) and (5, −1)
65. (−7, −3) and (−1, 6)
66. (0, 1) and (1, 0)
67. (−0.2, −0.2) and (1.8, 1.8)
68. (1.2, −3.3) and (2.2, −1.7)
For each problem, show that the three points form a right triangle.
69. (−3, −2), (0, −2), and (0, 4)
70. (7, 12), (7, −13), and (−5, −4)
71. (−1.4, 0.2), (1, 2), and (1, −3)
72. (2, −1), (−1, 2), and (6, 3)
73. (−5, 2), (−1, −2), and (−2, 5)
74. (1, −2), (2, 3), and (−3, 4)
Isosceles triangles have two legs of equal length. For each problem, show that the following points form an isosceles triangle.
75. (1, 6), (−1, 1), and (3, 1)
76. (−6, −2), (−3, −5), and (−9, −5)
77. (−3, 0), (0, 3), and (3, 0)
78. (0, −1), (0, 1), and (1, 0)
Calculate the area and the perimeter of the triangles formed by the following set of vertices.
79. {(−4, −5), (−4, 3), (2, 3)}
80. {(−1, 1), (3, 1), (3, −2)}
81. {(−3, 1), (−3, 5), (1, 5)}
82. {(−3, −1), (−3, 7), (1, −1)}
Part C: Midpoint Formula
Find the midpoint between the given two points.
83. (−1, 6) and (−7, −2)
84. (8, 0) and (4, −3)
85. (−10, 0) and (10, 0)
86. (−3, −6) and (−3, 6)
87. (−10, 5) and (14, −5)
88. (0, 1) and (2, 2)
89. (5, −3) and (4, −5)
90. (0, 0) and (1, 1)
91. (−1, −1) and (4, 4)
92. (3, −5) and (3, 5)
93. and
94. and
95. and
96. and
97. Given the right triangle formed by the vertices (0, 0), (6, 0), and (6, 8), show that the midpoints of the sides form a right triangle.
98. Given the isosceles triangle formed by the vertices (−10, −12), (0, 12), and (10, −12), show that the midpoints of the sides also form an isosceles triangle.
99. Calculate the area of the triangle formed by the vertices (−4, −3), (−1, 1), and (2, −3). (Hint: The vertices form an isosceles triangle.)
100. Calculate the area of the triangle formed by the vertices (−2, 1), (4, 1), and (1, −5).
Part D: Discussion Board Topics
101. Research and discuss the life and contributions to mathematics of René Descartes.
102. Research and discuss the history of the right triangle and the Pythagorean theorem.
103. What is a Pythagorean triple? Provide some examples.
104. Explain why you cannot use a ruler to calculate distance on a graph.
105. How do you bisect a line segment with only a compass and a straightedge?
Answers
1: A: (3, 5); B: (−2, 3); C: (−5, 0); D: (1, −3); E: (−3, −4)
3: A: (0, 6); B: (−4, 3); C: (−8, 0); D: (−6, −6); E: (8, −9)
5: A: (−10, 25); B: (30, 20); C: (0, 10); D: (15, 0); E: (25, −10)
7:
9:
11:
13:
15:
17: QII
19: QIII
21: QII
23: QIII
25: QIV
27: QII
29: $1.80
31: 1980 to 1984, 1996
33: 100%
35: $0.30
37: 1992
39: 67%
41:

43: 15 square units
45: 28 square units
47: 4 square units
49: 9 square units
51: 5 units
53: 13 units
55: 15 units
57: 13/2 units
59: 5/3 units
61: units
63: units
65: units
67: 2.8 units
69: Proof
71: Proof
73: Proof
75: Proof
77: Proof
79: Perimeter: 24 units; area: 24 square units
81: Perimeter: units; area: 8 square units
83: (−4, 2)
85: (0, 0)
87: (2, 0)
89: (9/2, −4)
91: (3/2, 3/2)
93: (1/2, 1)
95: (3/4, −5/8)
99: 12 square units
3.2 Graph by Plotting Points
Learning Objectives
- Verify solutions to linear equations with two variables.
- Graph lines by plotting points.
- Identify and graph horizontal and vertical lines.
Solutions to Equations with Two Variables
A linear equation with two variablesAn equation with two variables that can be written in the standard form , where the real numbers a and b are not both zero. has standard form , where a, b, and c are real numbers and a and b are not both 0. Solutions to equations of this form are ordered pairs (x, y), where the coordinates, when substituted into the equation, produce a true statement.
Example 1: Determine whether (1, −2) and (−4, 1) are solutions to .
Solution: Substitute the x- and y-values into the equation to determine whether the ordered pair produces a true statement.
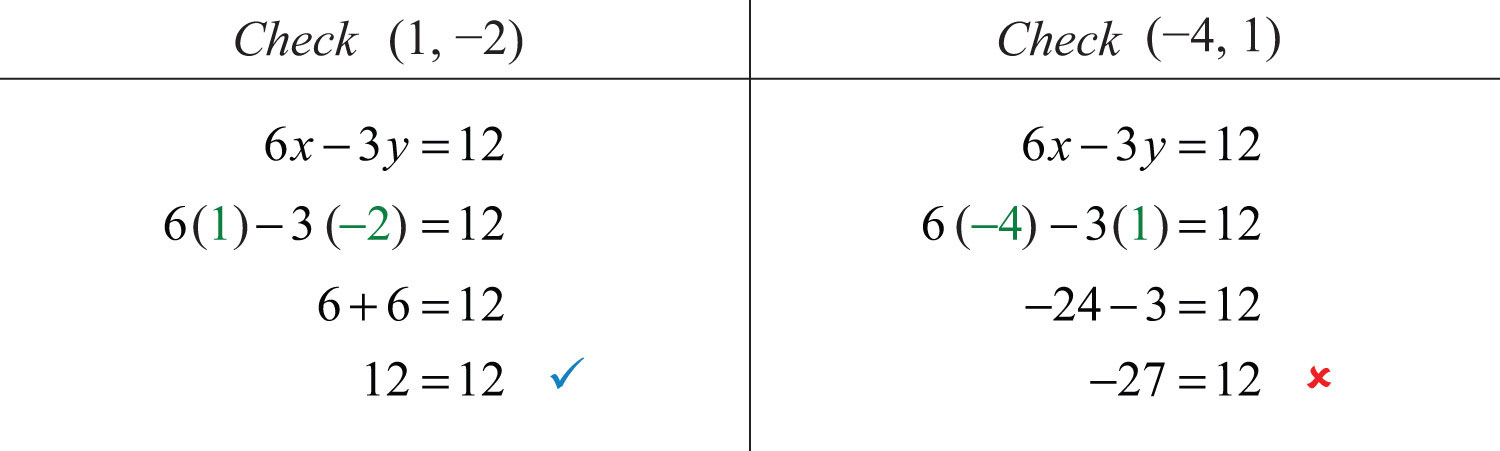
Answer: (1, −2) is a solution, and (−4, 1) is not.
It is often the case that a linear equation is given in a form where one of the variables, usually y, is isolated. If this is the case, then we can check that an ordered pair is a solution by substituting in a value for one of the coordinates and simplifying to see if we obtain the other.
Example 2: Are and solutions to ?
Solution: Substitute the x-values and simplify to see if the corresponding y-values are obtained.
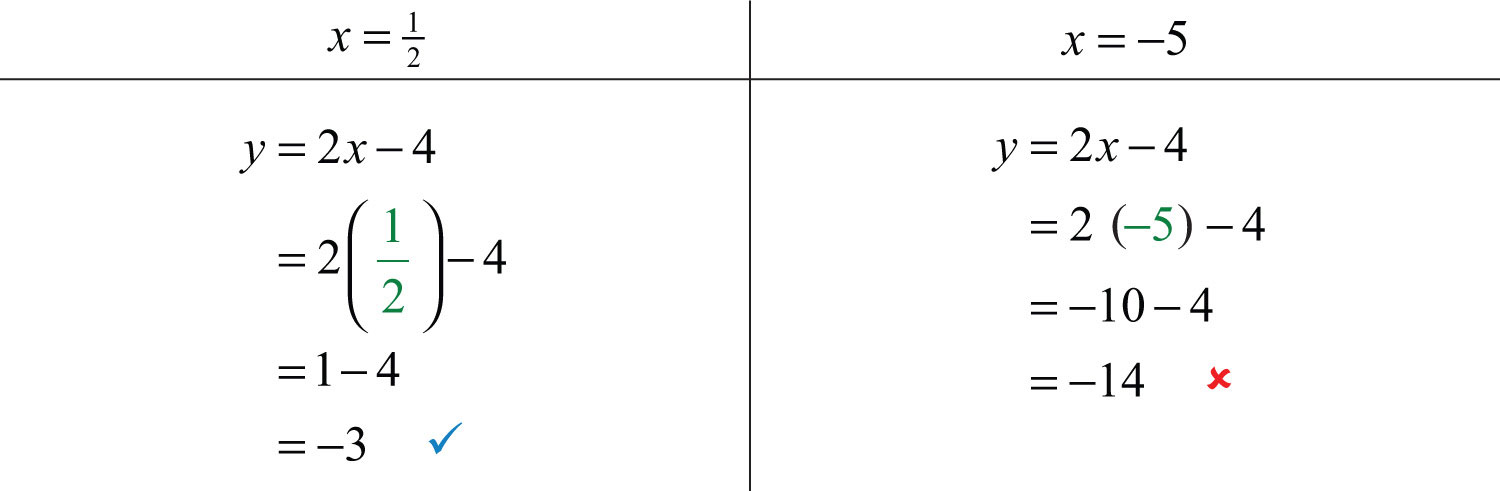
Answer: is a solution, and is not.
Try this! Is (6, −1) a solution to ?
Answer: Yes
Video Solution
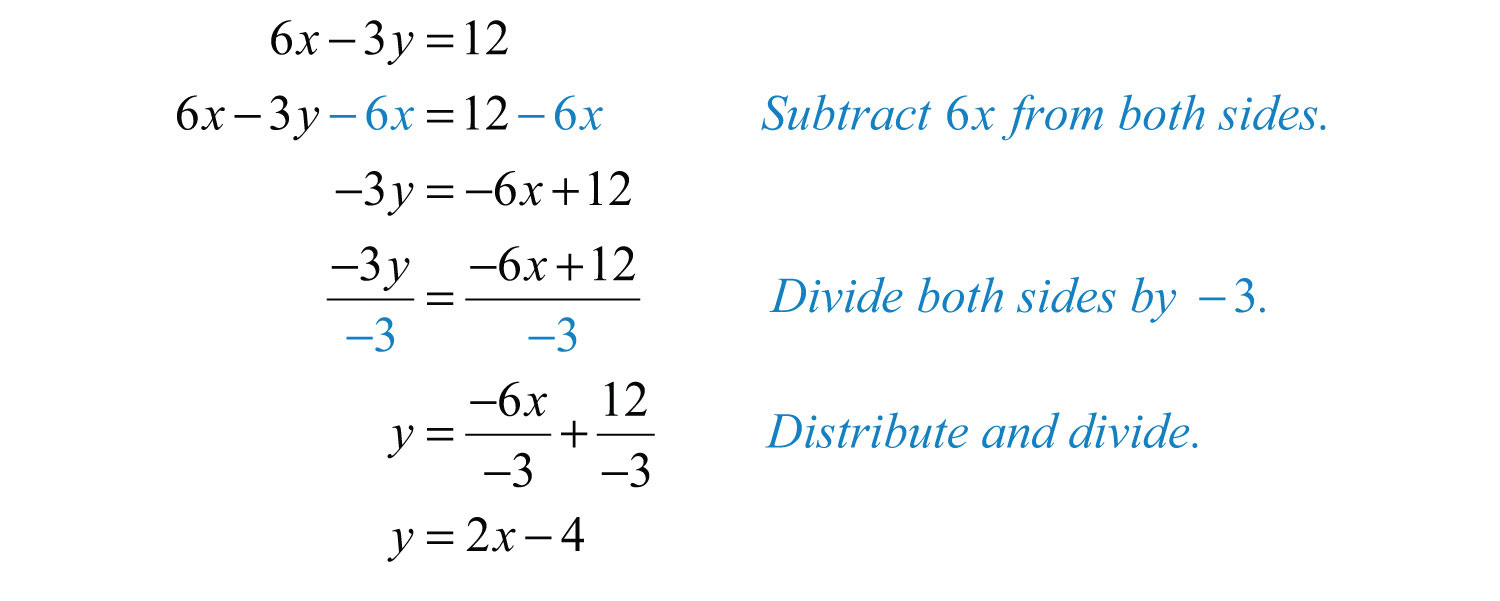
(click to see video)When given linear equations with two variables, we can solve for one of the variables, usually y, and obtain an equivalent equation as follows:
Written in this form, we can see that y depends on x. Here x is the independent variableThe variable that determines the values of other variables. Usually we think of the x-value as the independent variable. and y is the dependent variableThe variable whose value is determined by the value of the independent variable. Usually we think of the y-value as the dependent variable..

The linear equation can be used to find ordered pair solutions. If we substitute any real number for x, then we can simplify to find the corresponding y-value. For example, if , then , and we can form an ordered pair solution, (3, 2). Since there are infinitely many real numbers to choose for x, the linear equation has infinitely many ordered pair solutions (x, y).
Example 3: Find ordered pair solutions to the equation with the given x-values {−2, −1, 0, 4, 6}.
Solution: First, solve for y.

Next, substitute the x-values in the equation to find the corresponding y-values.
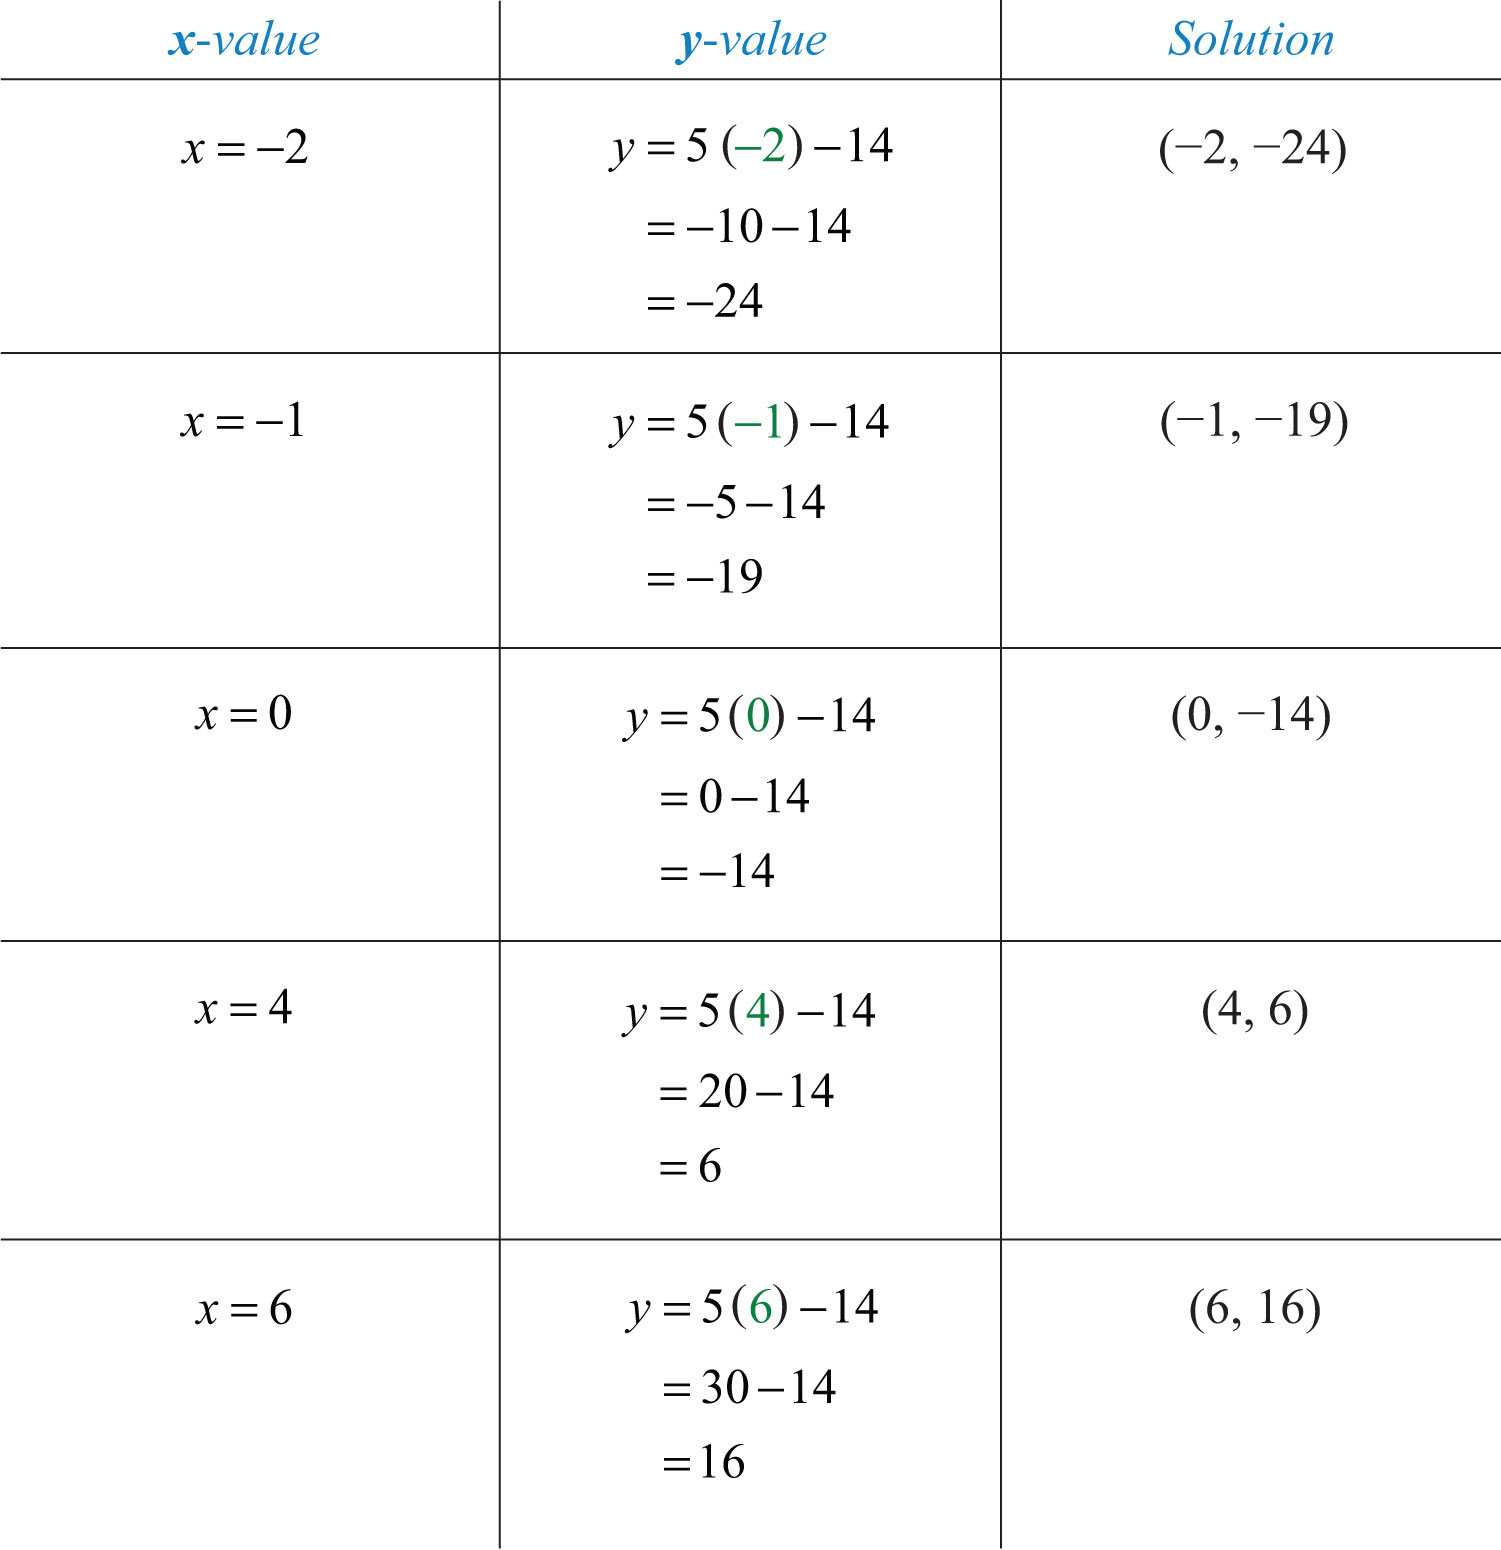
Answer: {(−2, −24), (−1, −19), (0, −14), (4, 6), (6, 16)}
In the previous example, certain x-values are given, but that is not always going to be the case. When treating x as the independent variable, we can choose any values for x and then substitute them into the equation to find the corresponding y-values. This method produces as many ordered pair solutions as we wish.
Example 4: Find five ordered pair solutions to .
Solution: First, solve for y.
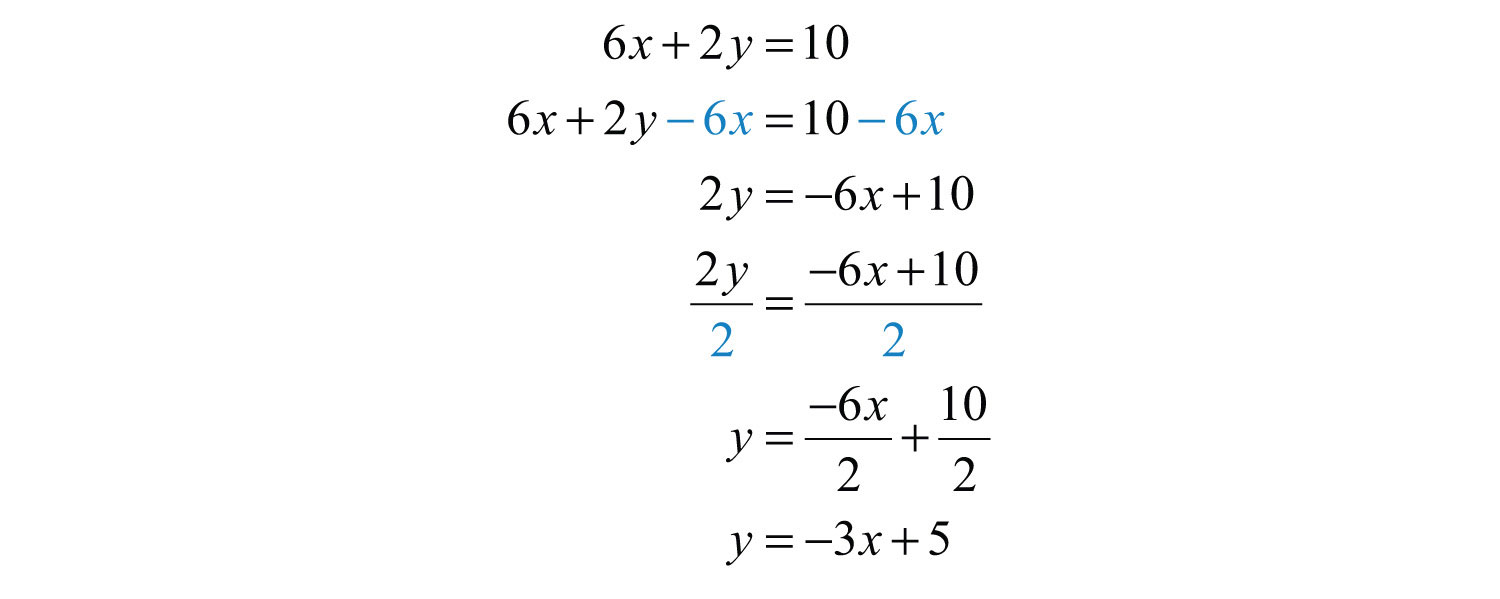
Next, choose any set of x-values. Usually we choose some negative values and some positive values. In this case, we will find the corresponding y-values when x is {−2, −1, 0, 1, 2}. Make the substitutions required to fill in the following table (often referred to as a t-chart):
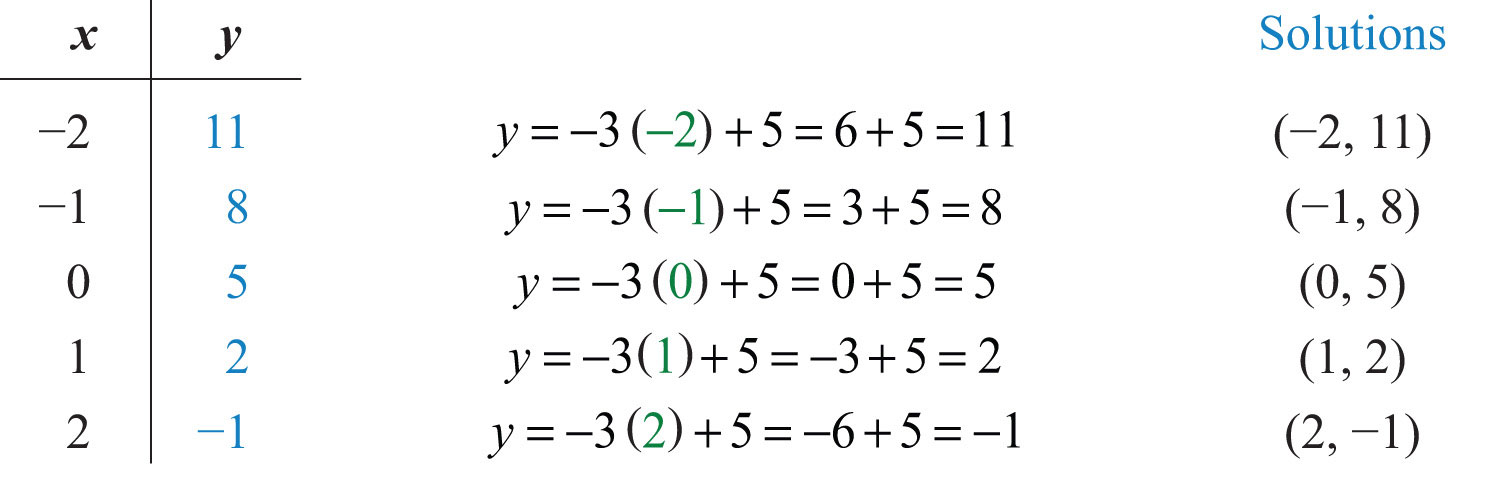
Answer: {(−2, 11), (−1, 8), (0, 5), (1, 2), (2, −1)}. Since there are infinitely many ordered pair solutions, answers may vary depending on the choice of values for the independent variable.
Try this! Find five ordered pair solutions to .
Answer: {(−2, −11), (−1, −6), (0, −1), (1, 4), (2, 9)} (answers may vary)
Video Solution
(click to see video)Graph by Plotting Points
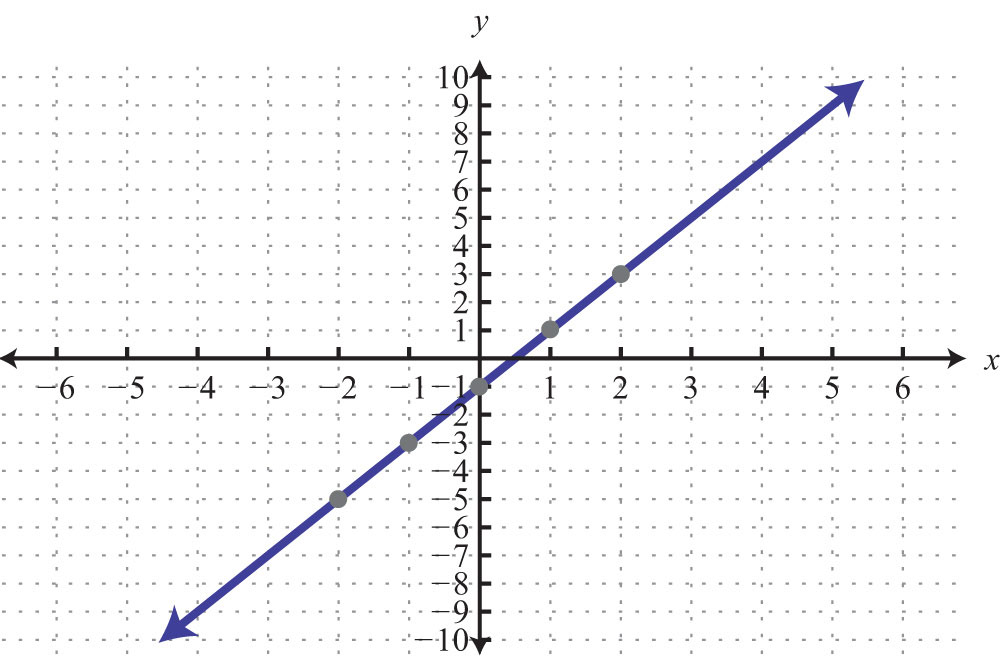
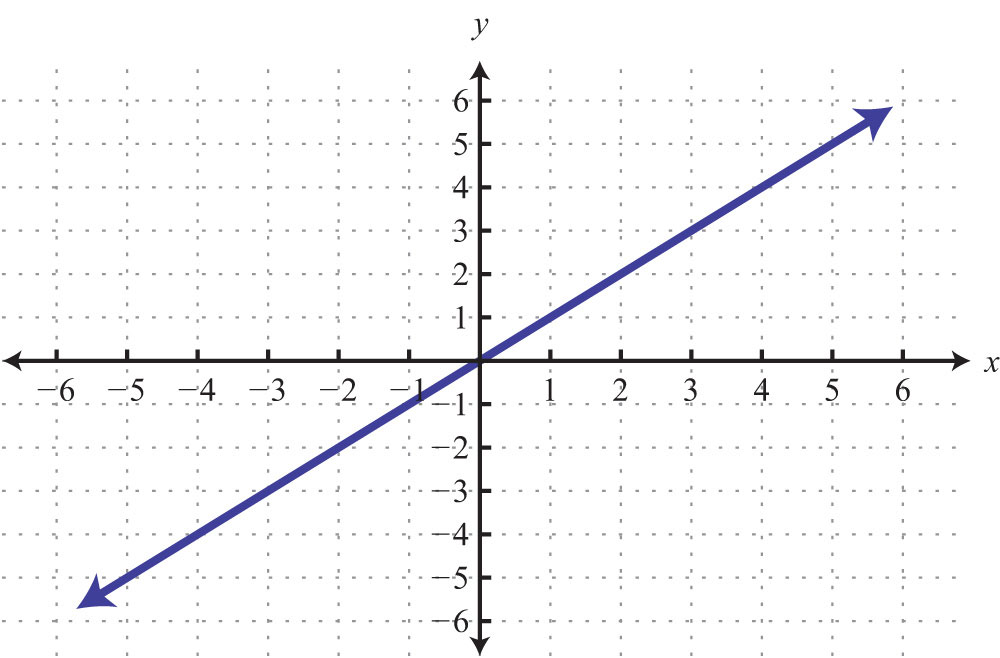
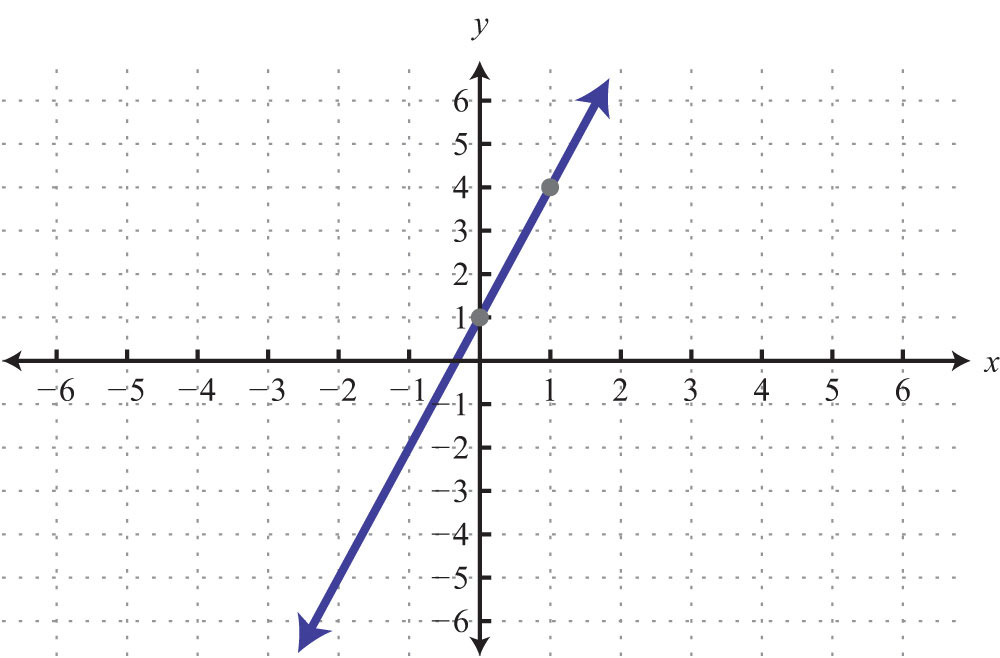
Since the solutions to linear equations are ordered pairs, they can be graphed using the rectangular coordinate system. The set of all solutions to a linear equation can be represented on a rectangular coordinate plane using a straight line connecting at least two points; this line is called its graphA point on the number line associated with a coordinate.. To illustrate this, plot five ordered pair solutions, {(−2, 11), (−1, 8), (0, 5), (1, 2), (2, −1)}, to the linear equation .
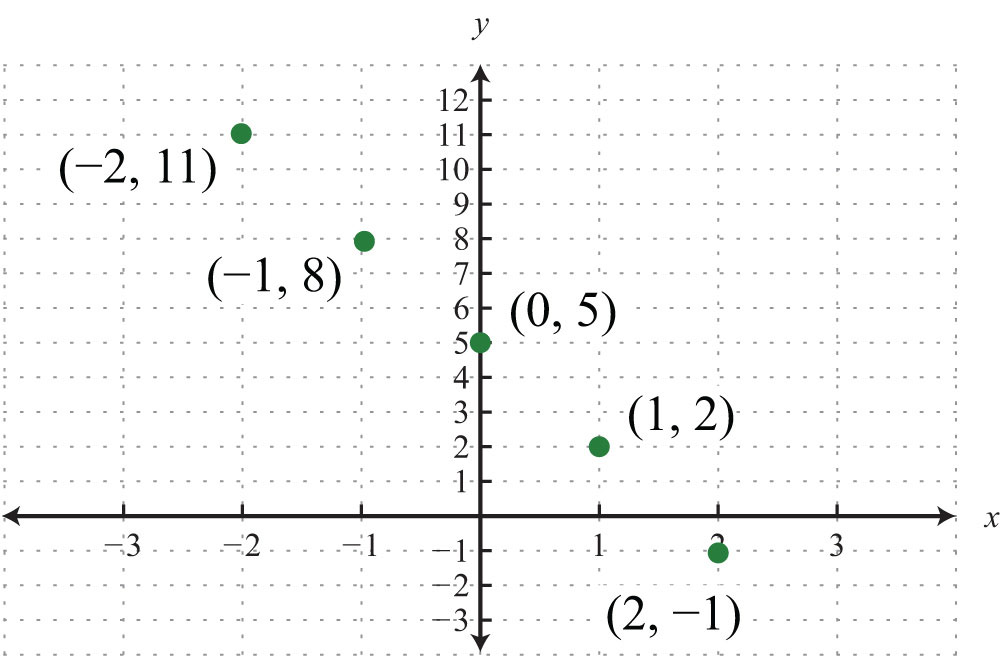
Notice that the points are collinear; this will be the case for any linear equation. Draw a line through the points with a straightedge, and add arrows on either end to indicate that the graph extends indefinitely.
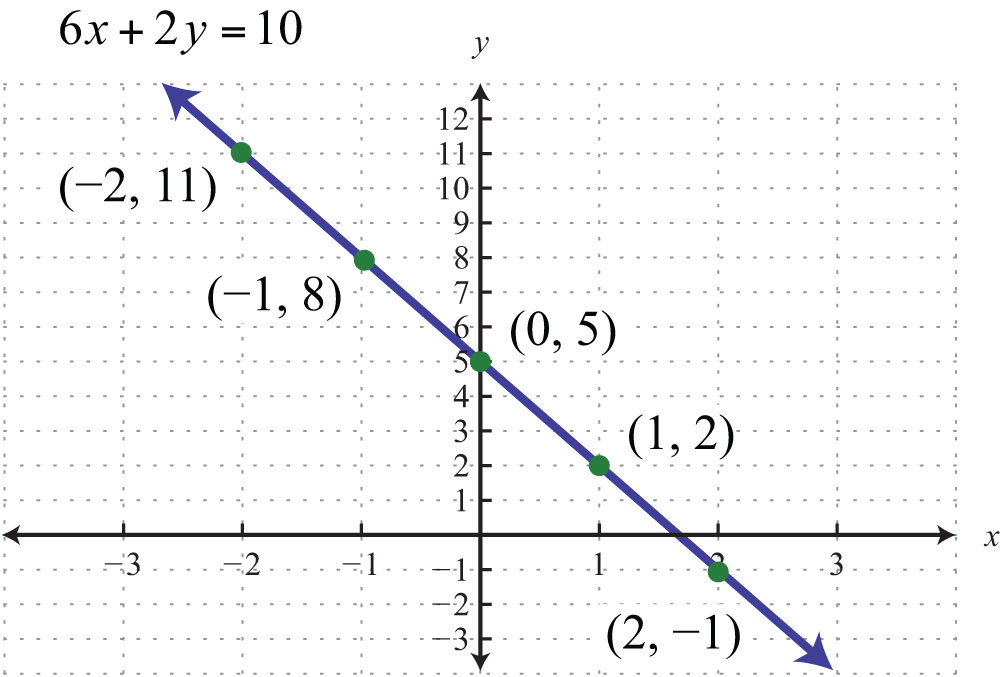
The resulting line represents all solutions to , of which there are infinitely many. The steps for graphing lines by plotting points are outlined in the following example.
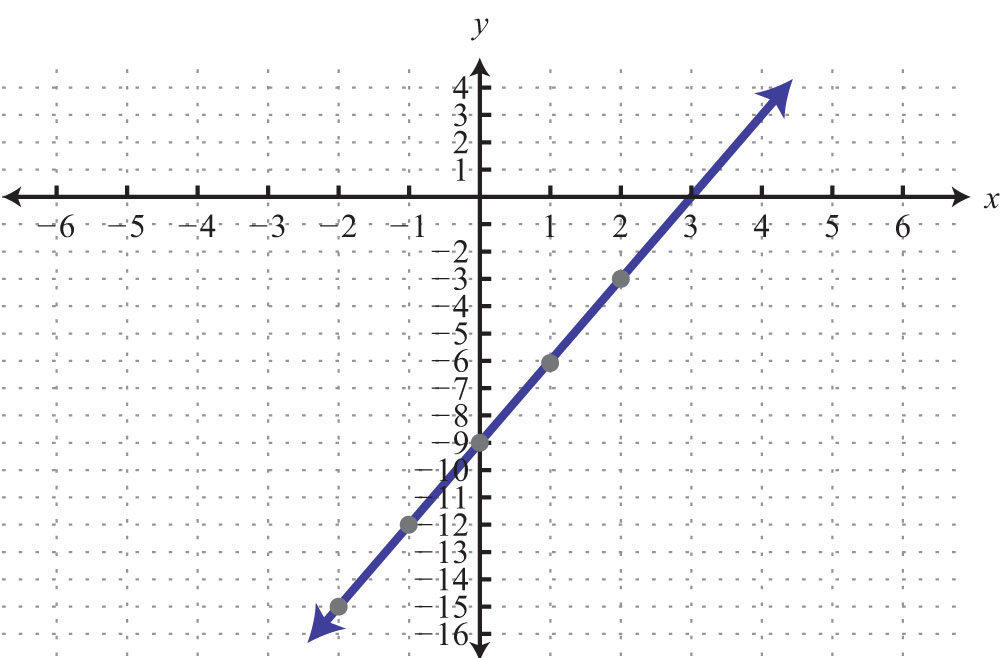
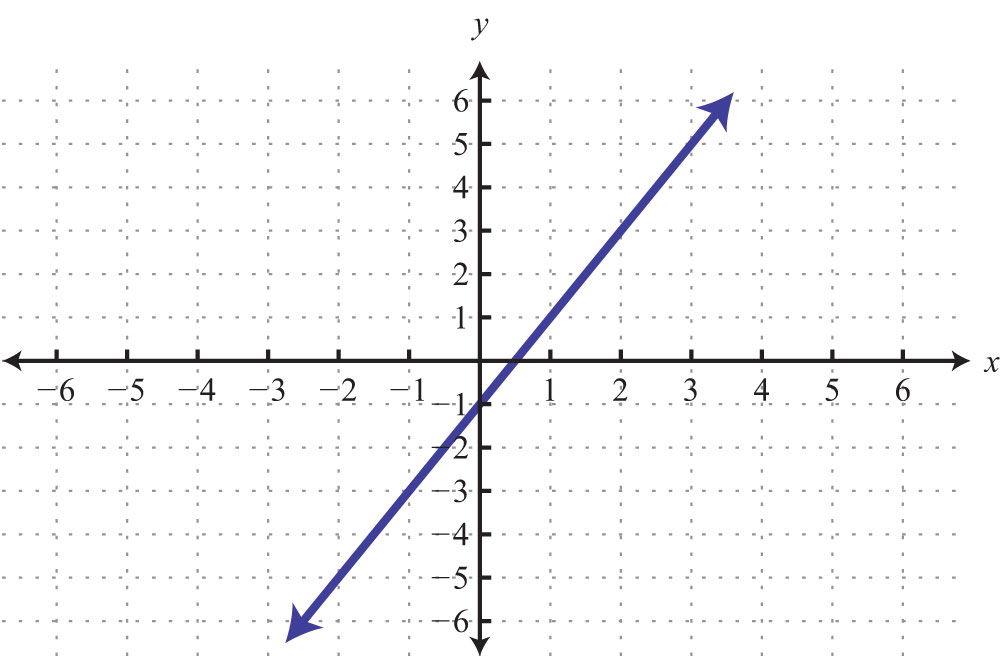
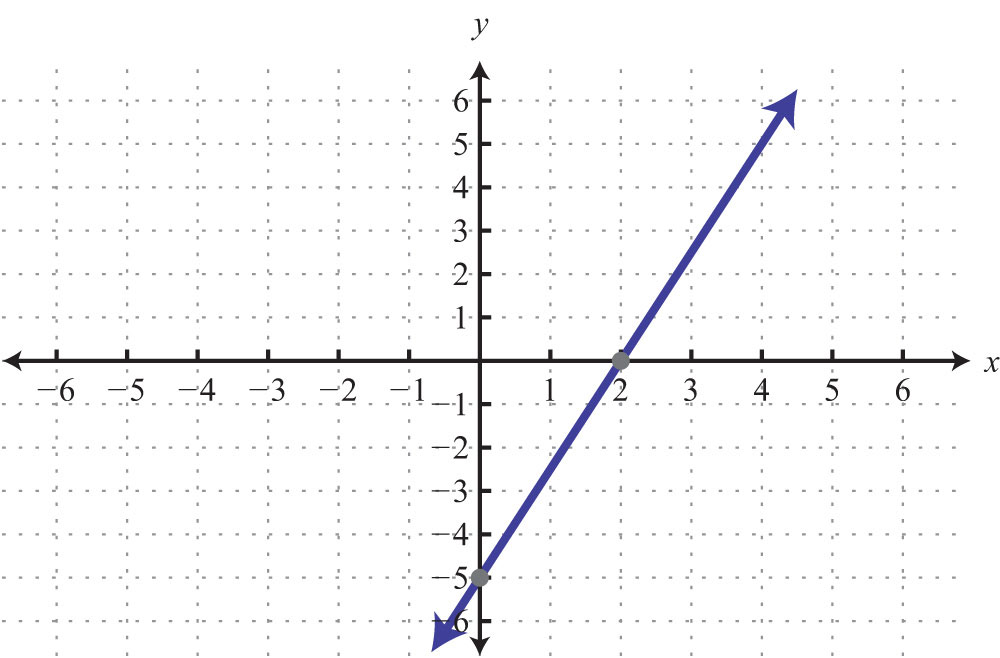
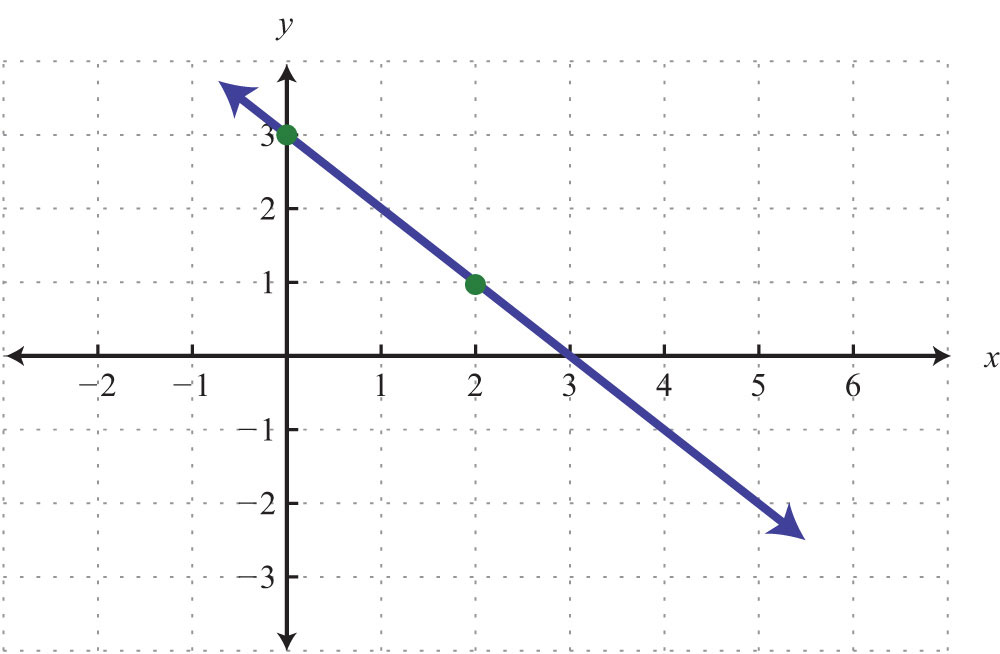
Example 5: Find five ordered pair solutions and graph: .
Solution:
Step 1: Solve for y.
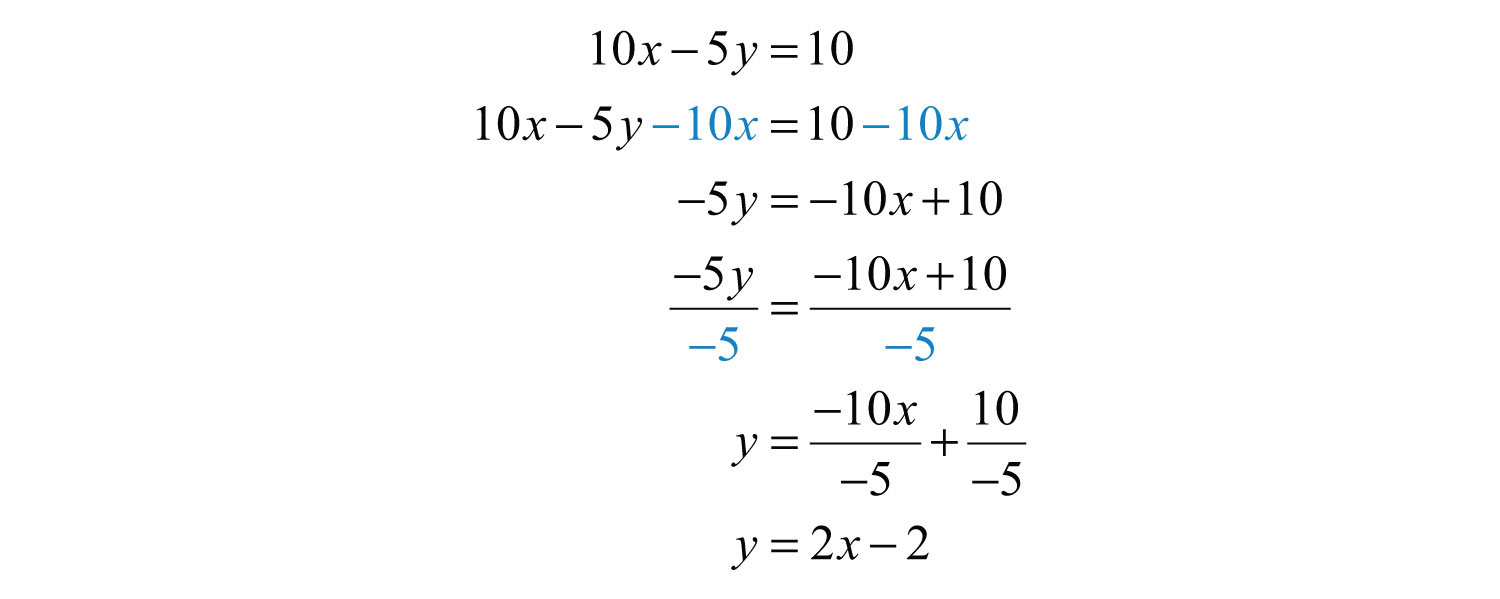
Step2: Choose at least two x-values and find the corresponding y-values. In this section, we will choose five real numbers to use as x-values. It is a good practice to choose 0 and some negative numbers, as well as some positive numbers.
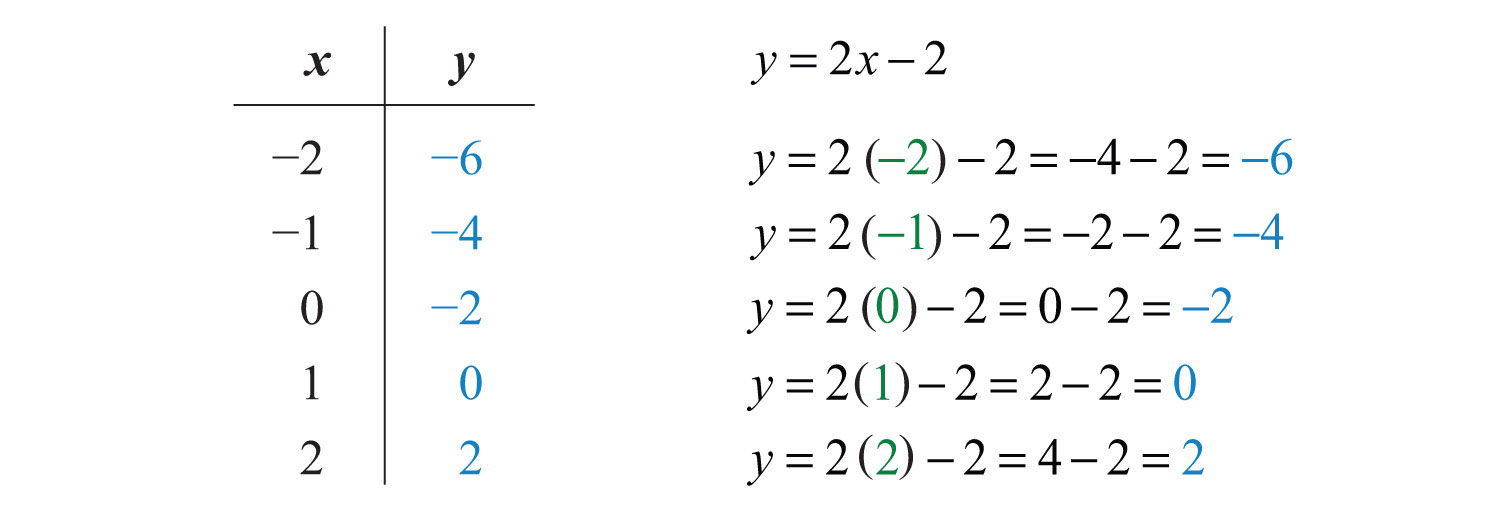
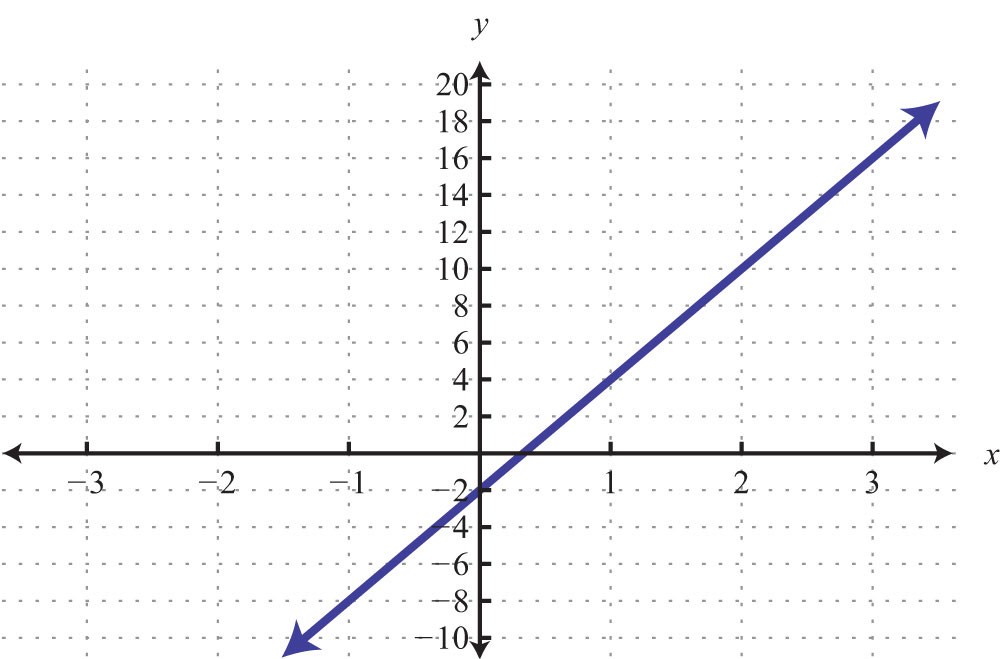
Five ordered pair solutions are {(−2, −6), (−1, −4), (0, −2), (1, 0), (2, 2)}
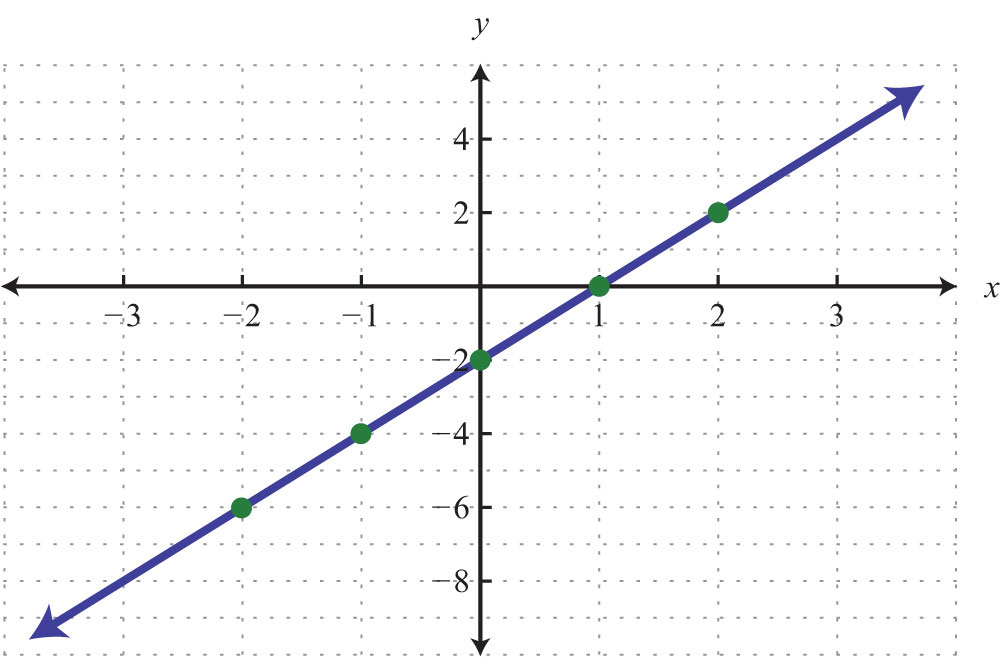
Step 3: Choose an appropriate scale, plot the points, and draw a line through them using a straightedge. In this case, choose a scale where each tick mark on the y-axis represents 2 units because all the y-values are multiples of 2.
Answer:
It will not always be the case that y can be solved in terms of x with integer coefficients. In fact, the coefficients often turn out to be fractions.
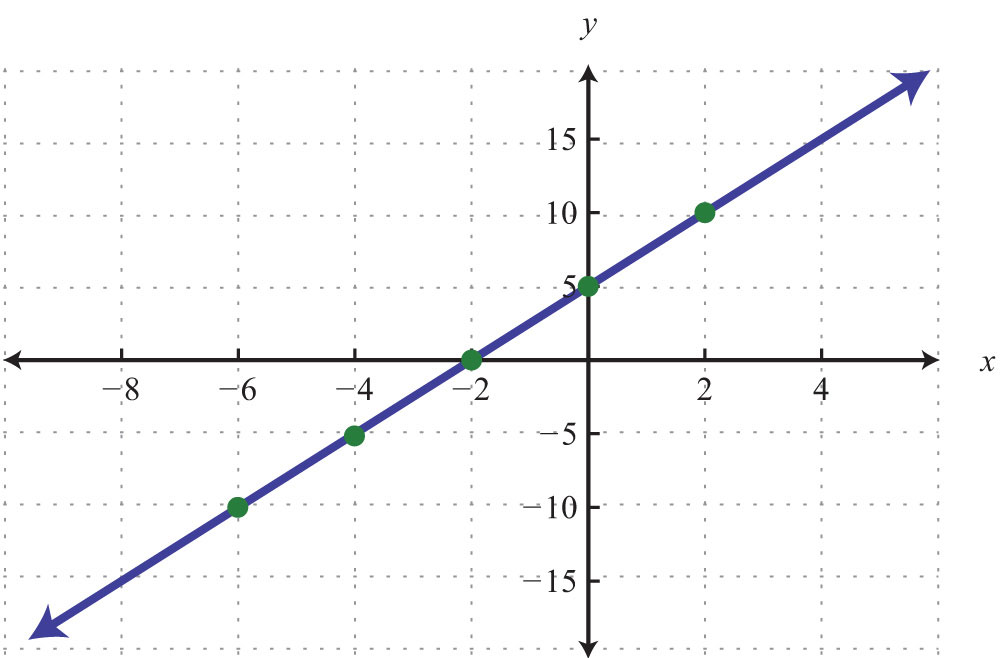
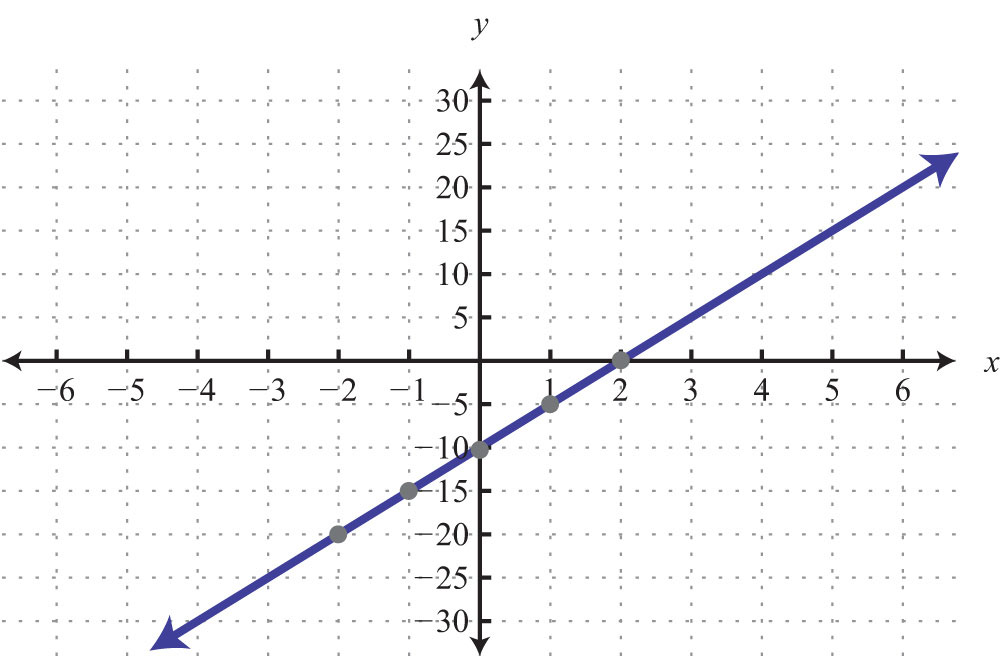
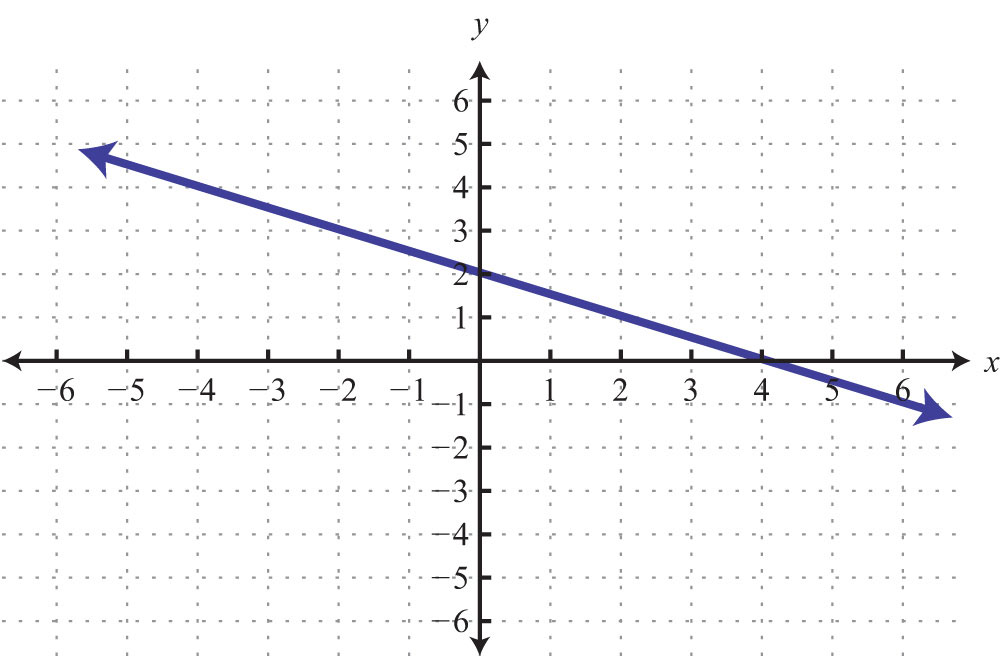
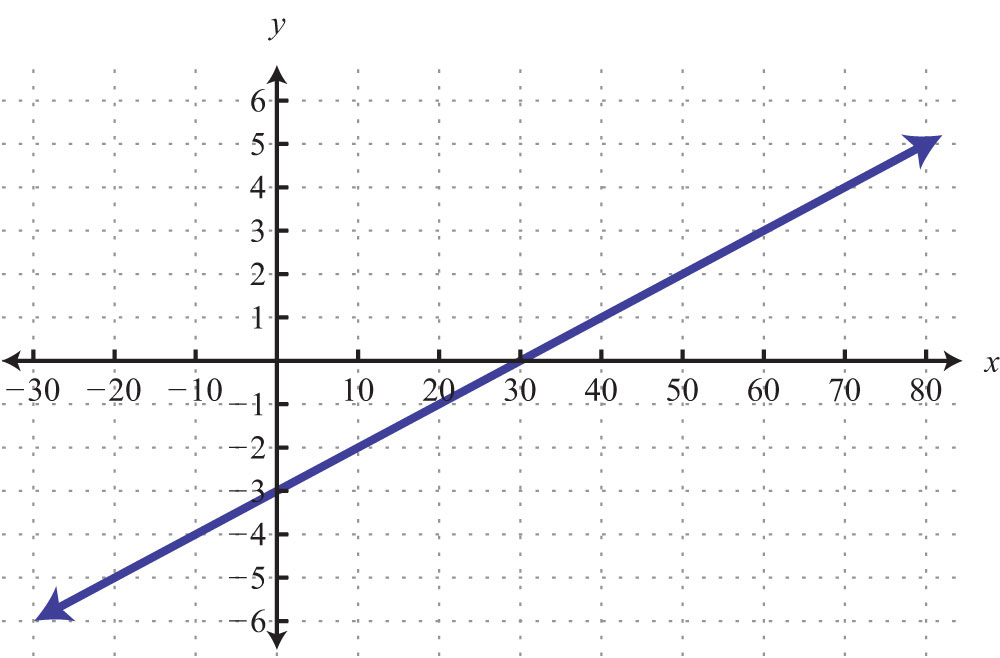
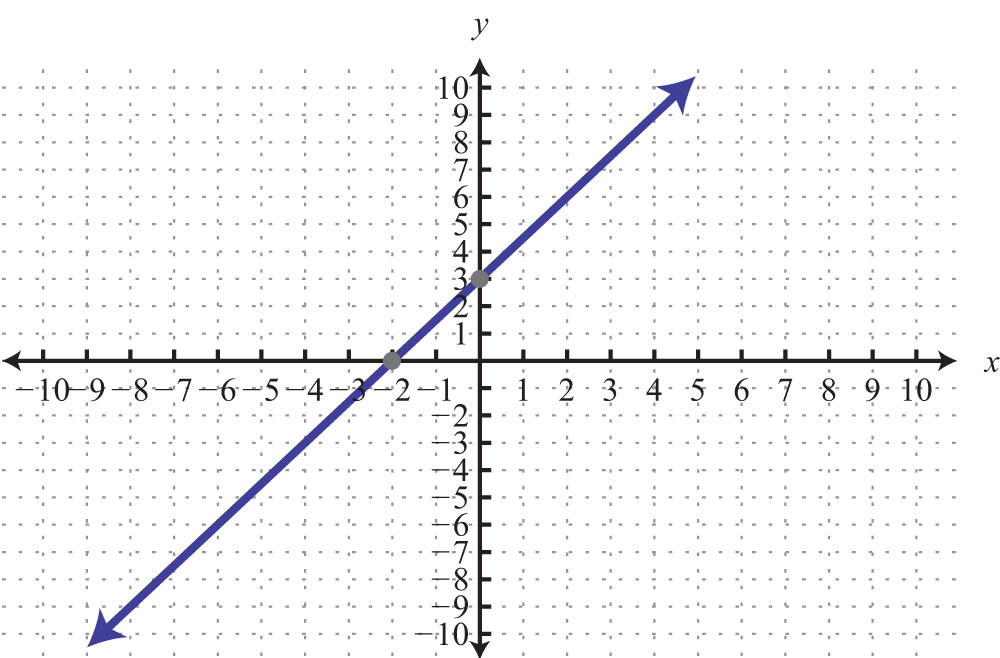
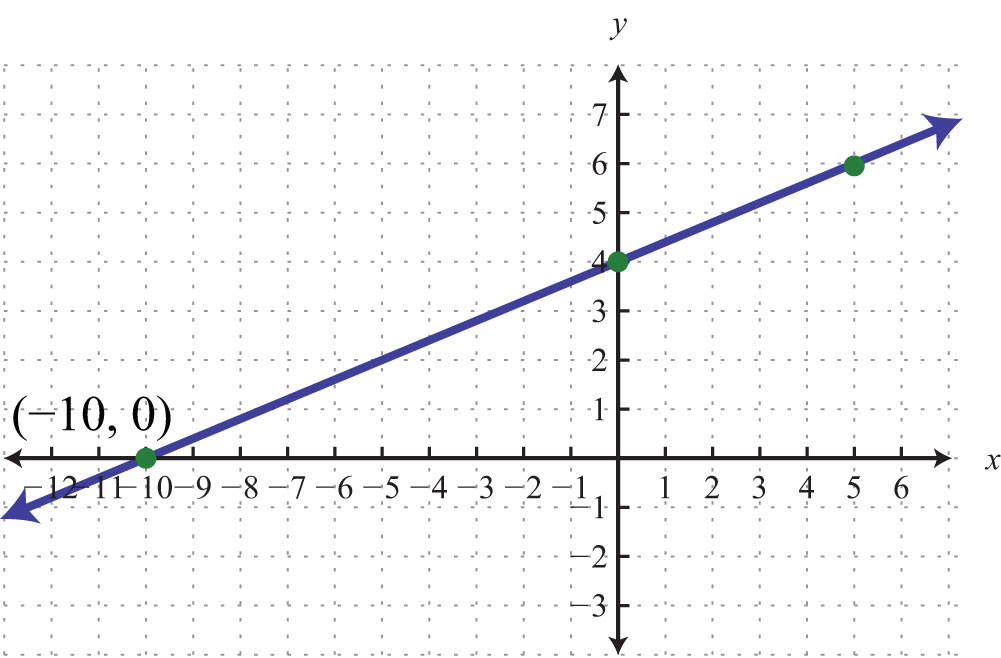
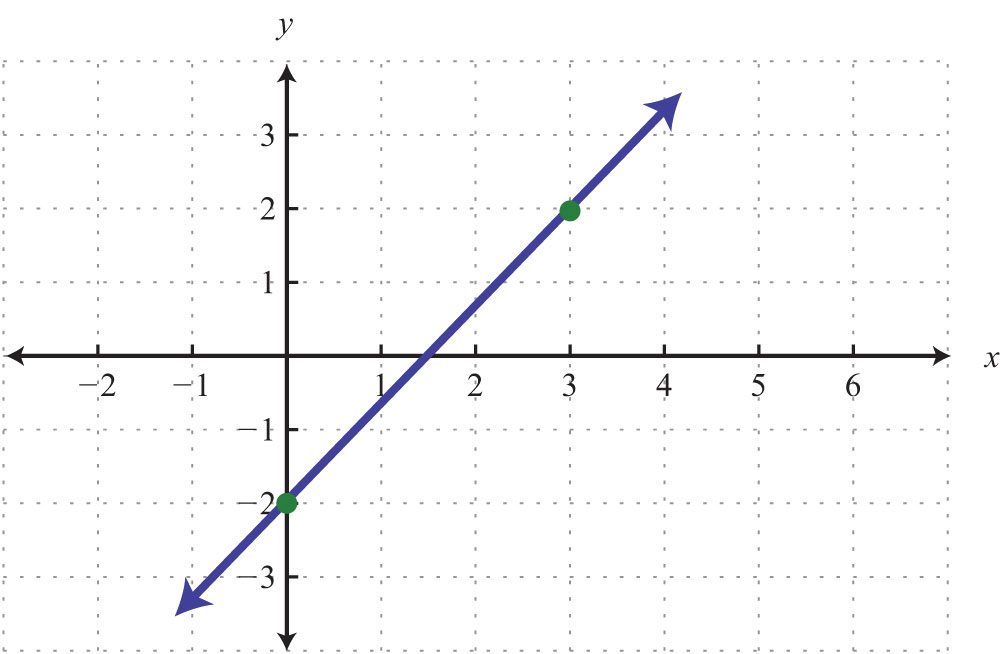
Example 6: Find five ordered pair solutions and graph: .
Solution:
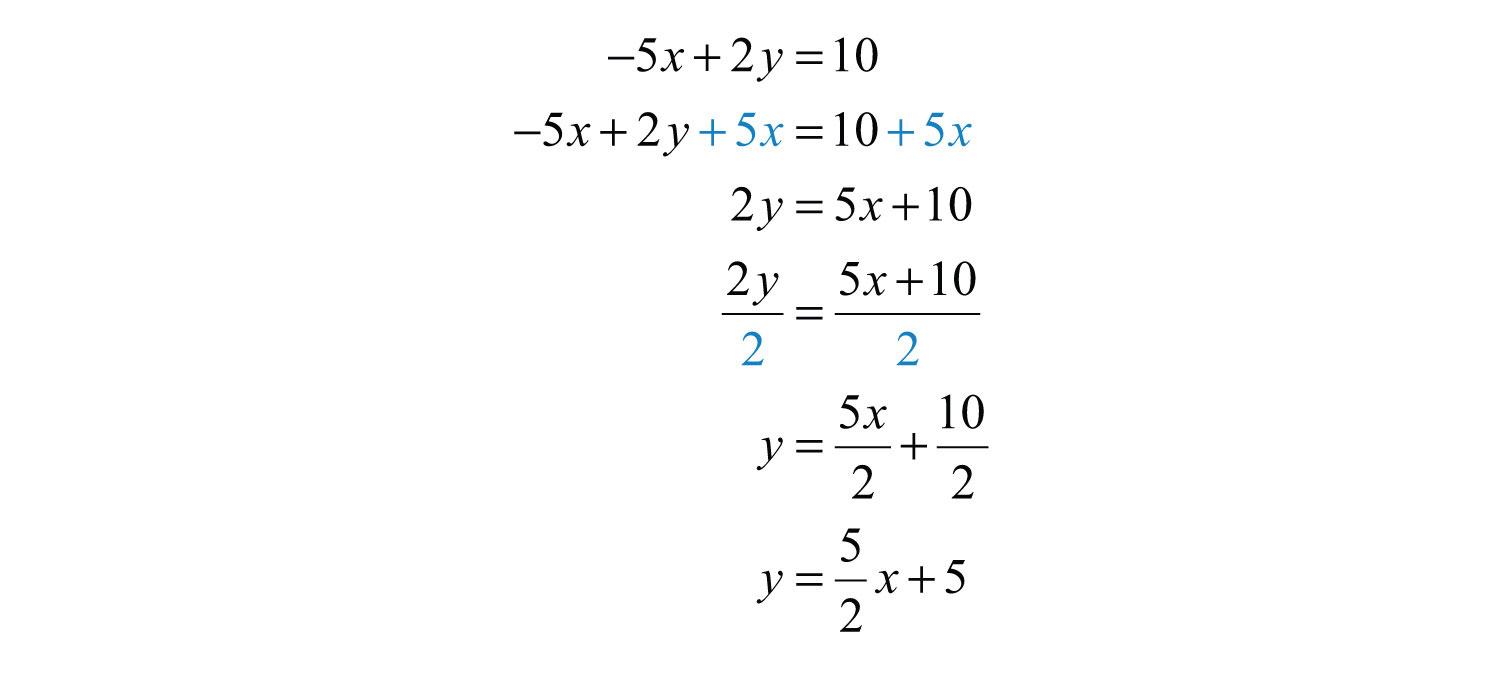
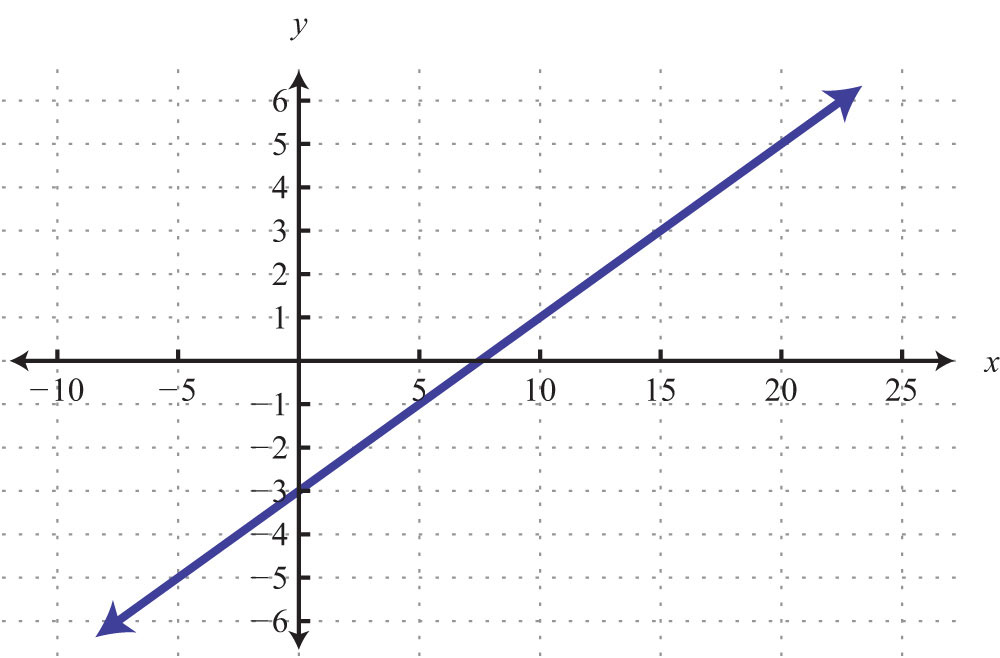
Remember that you can choose any real number for the independent variable x, so choose wisely here. Since the denominator of the coefficient of the variable x is 2, you can avoid fractions by choosing multiples of 2 for the x-values. In this case, choose the set of x-values {−6, −4, −2, 0, 2} and find the corresponding y-values.
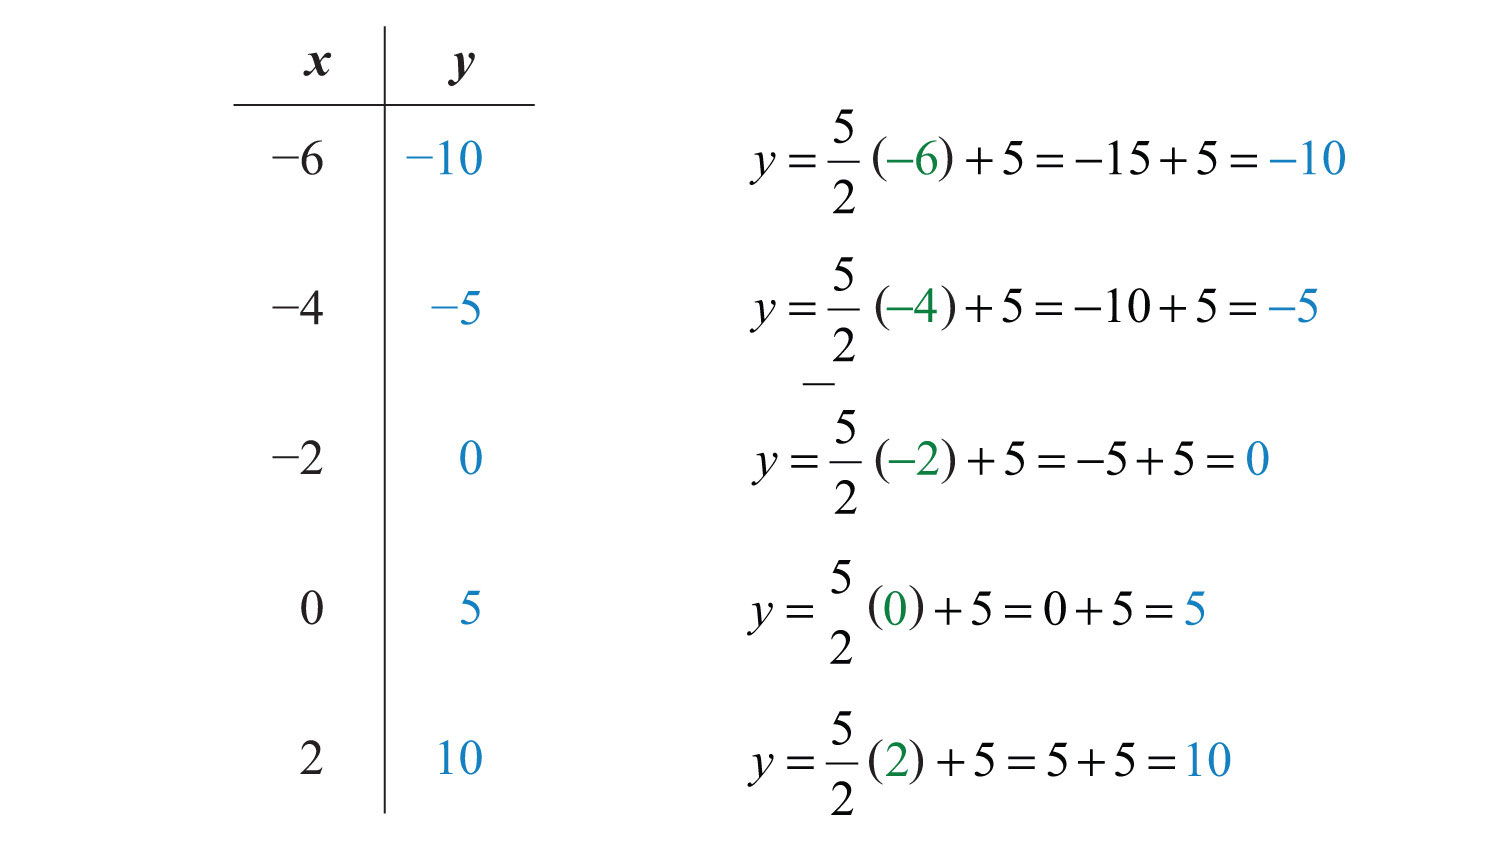
Five solutions are {(−6, −10), (−4, −5), (−2, 0), (0, 5), (2, 10)}. Here we choose to scale the x-axis with multiples of 2 and the y-axis with multiples of 5.
Answer:
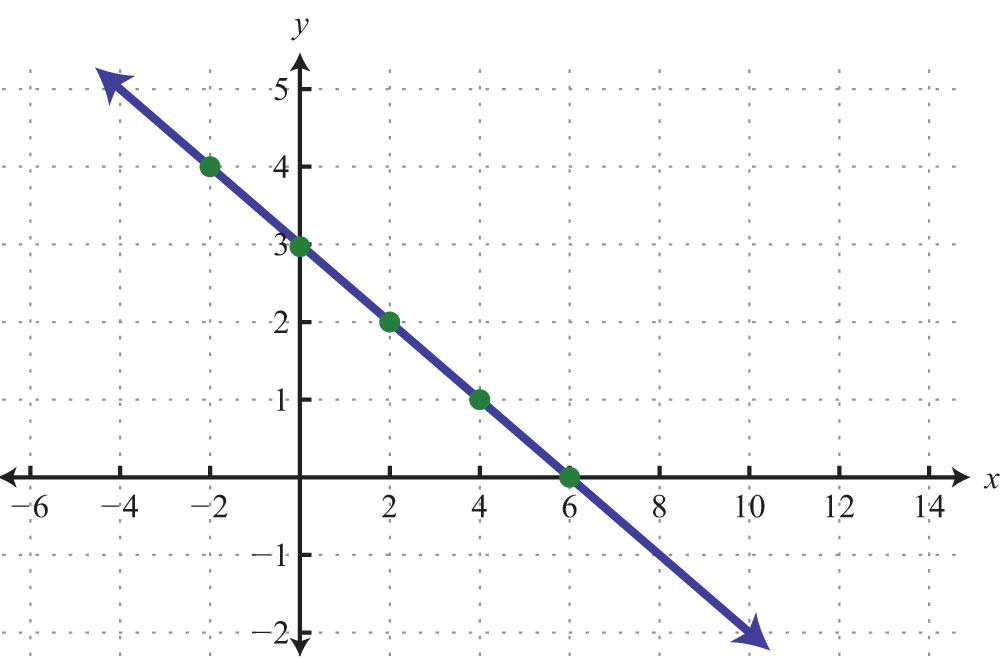
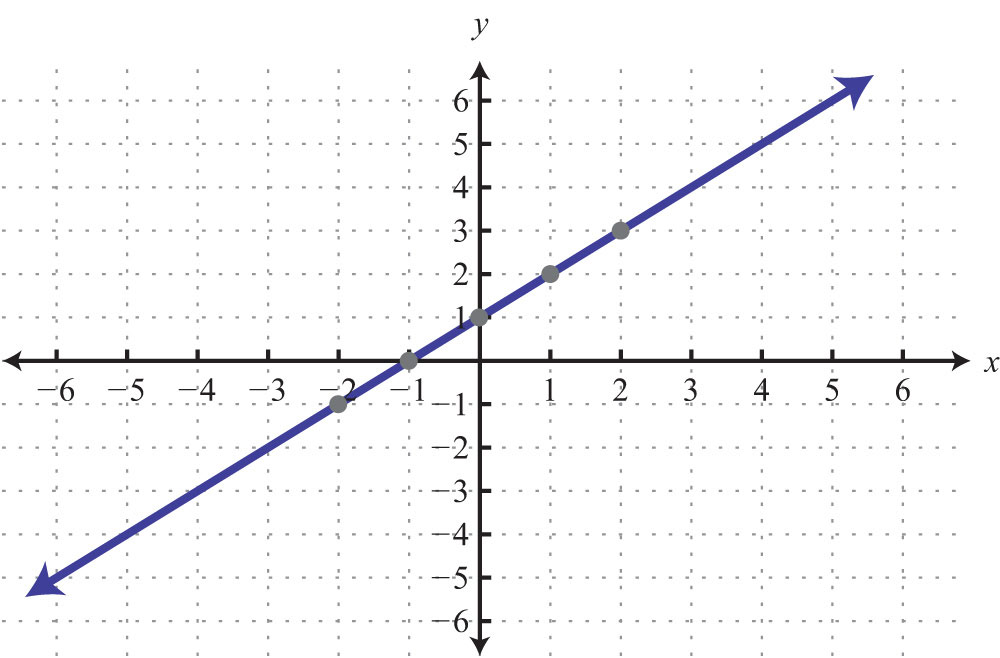
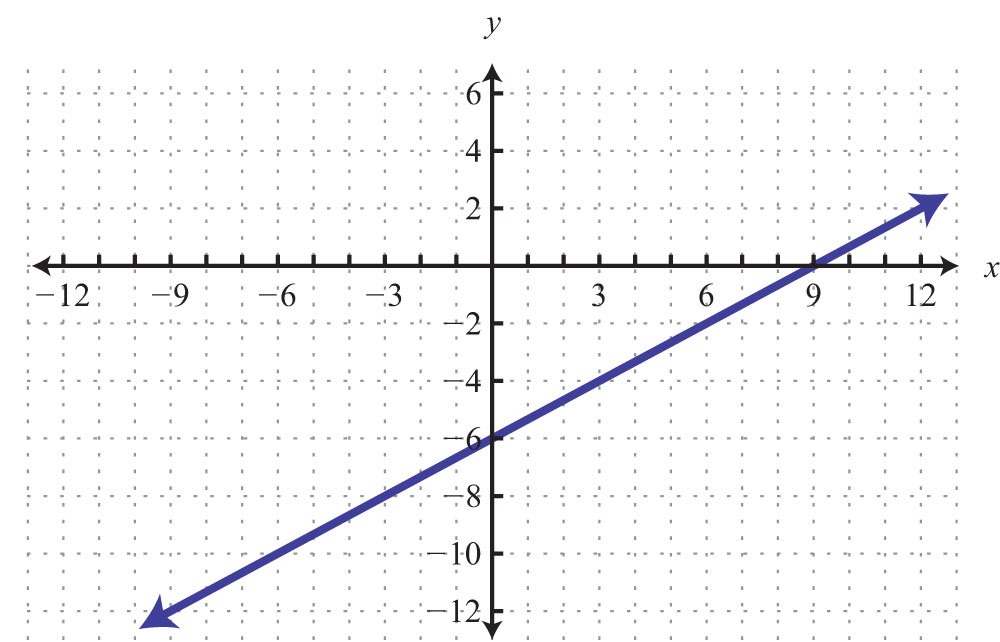
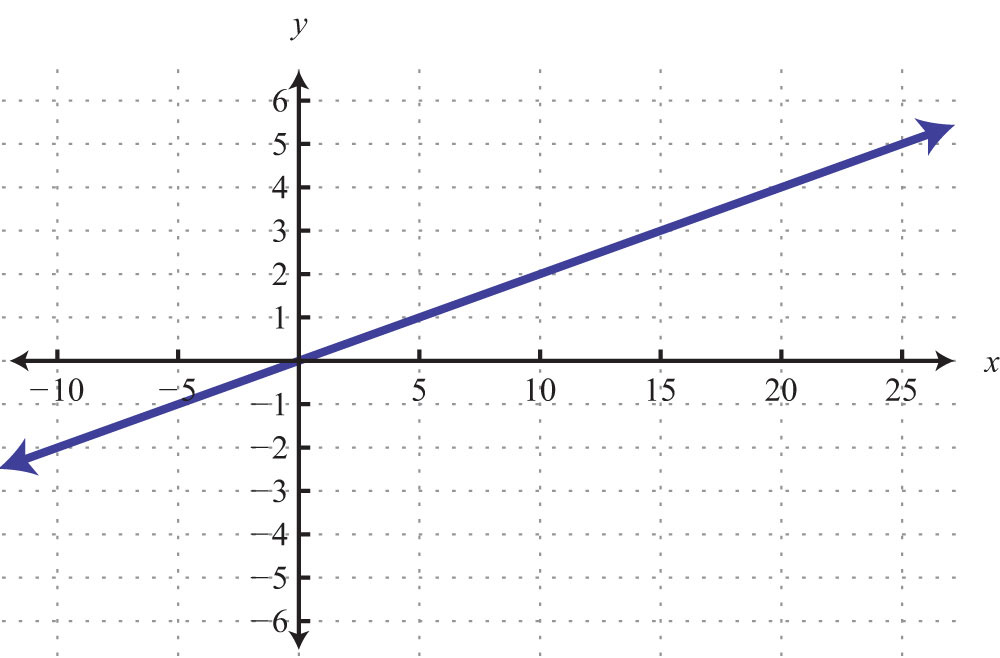
Try this! Find five ordered pair solutions and graph: .
Answer: {(−2, 4), (0, 3), (2, 2), (4, 1), (6, 0)}
Video Solution
(click to see video)Horizontal and Vertical Lines
We need to recognize by inspection linear equations that represent a vertical or horizontal line.
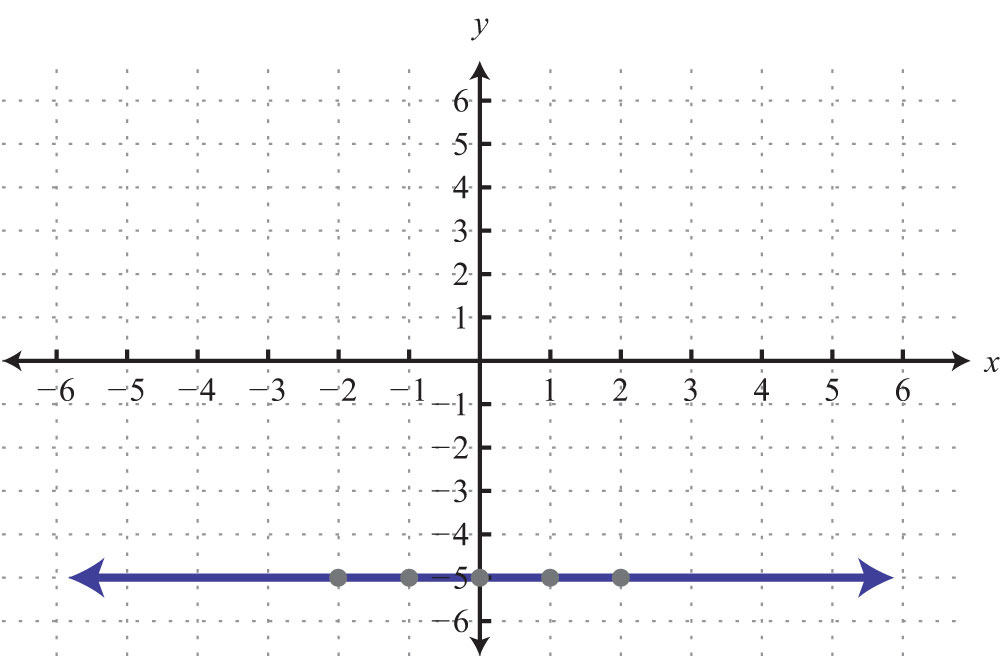
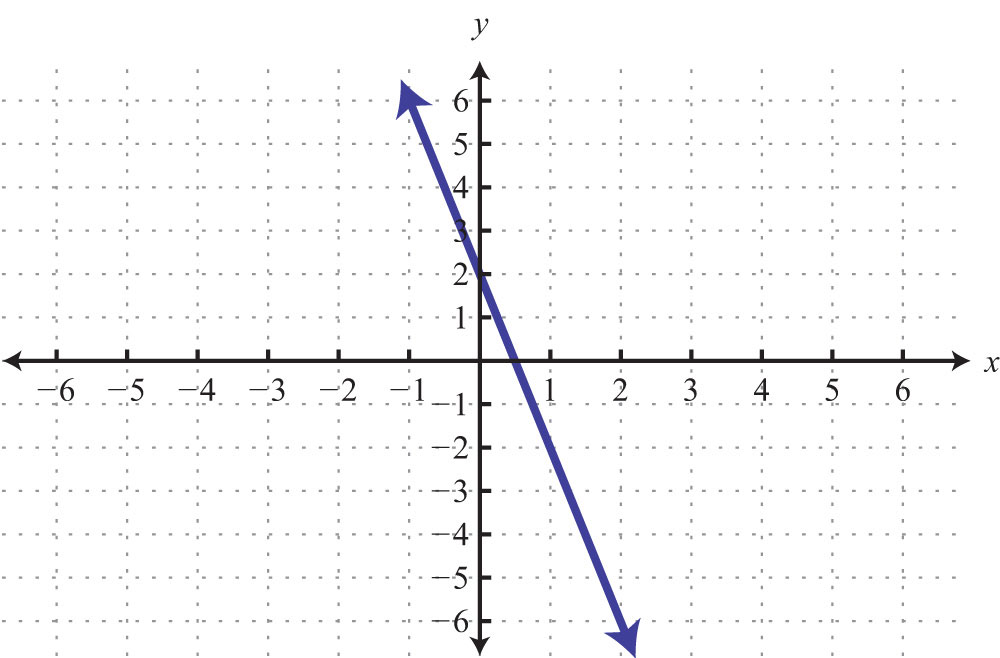
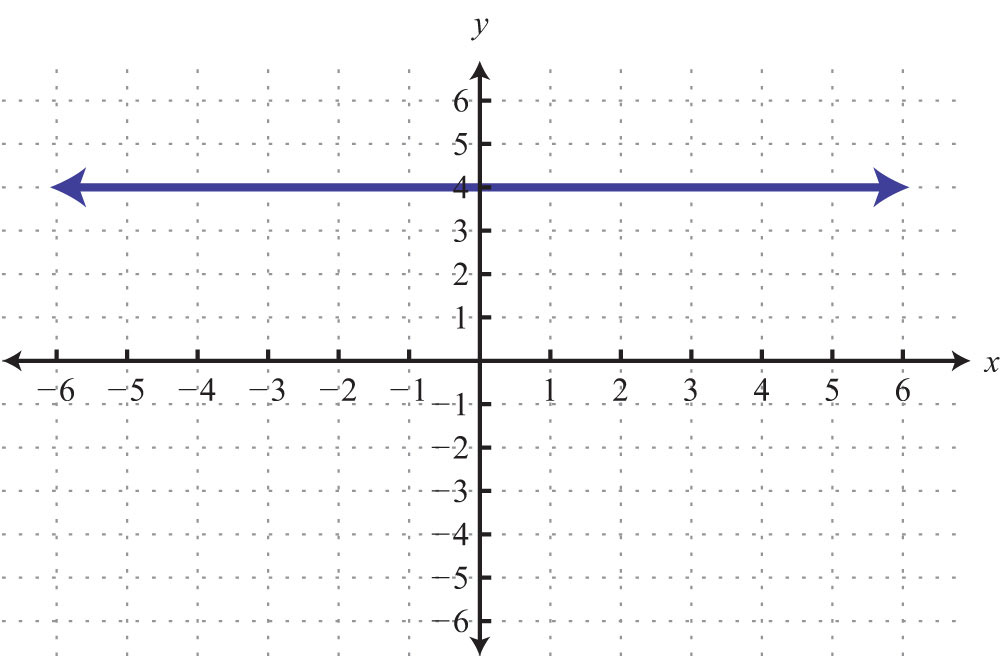
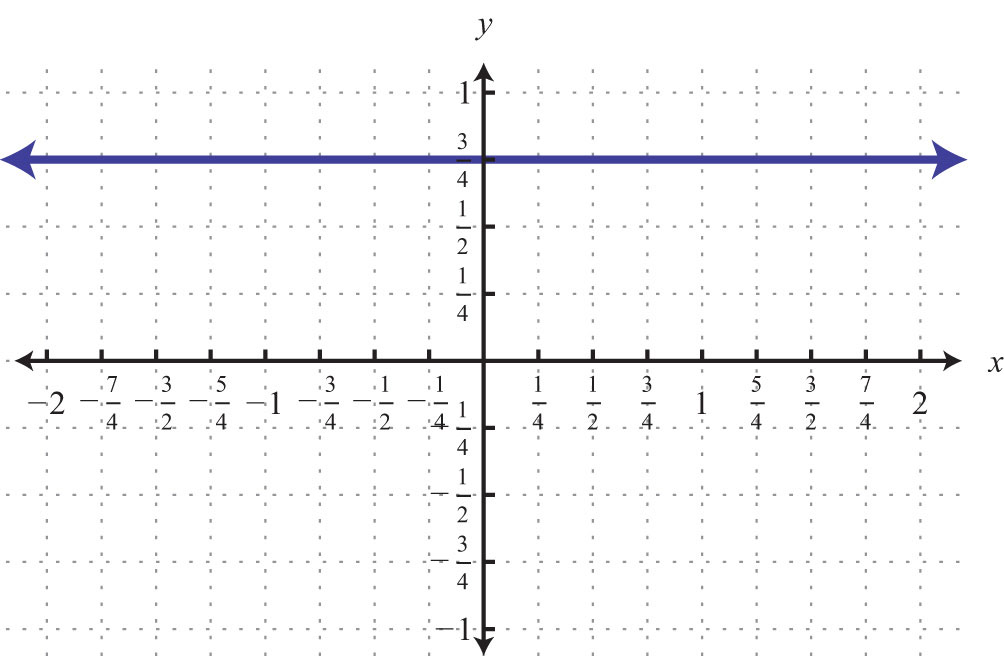
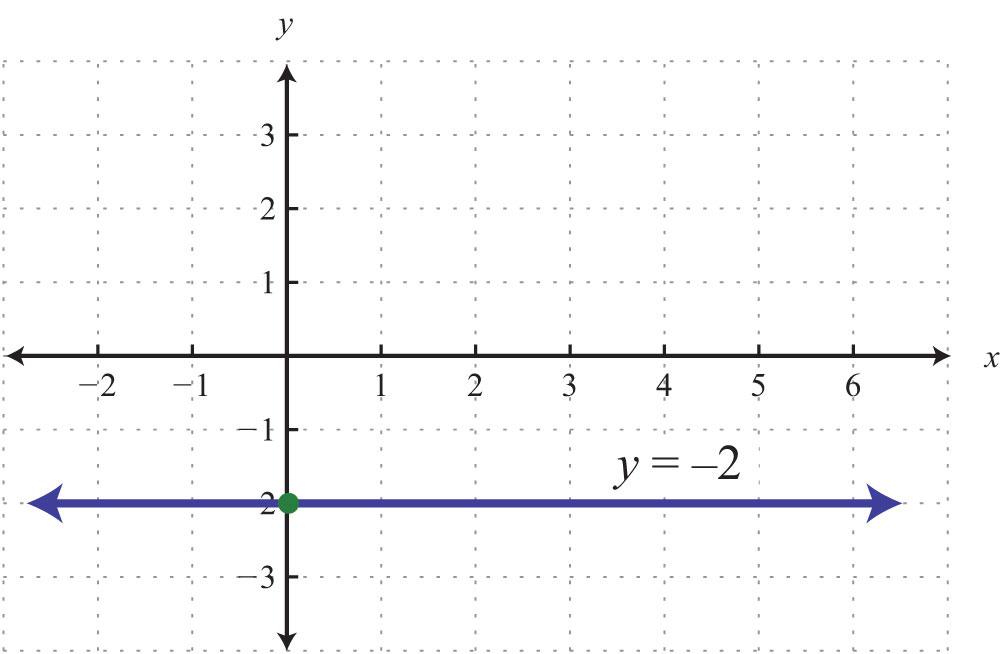
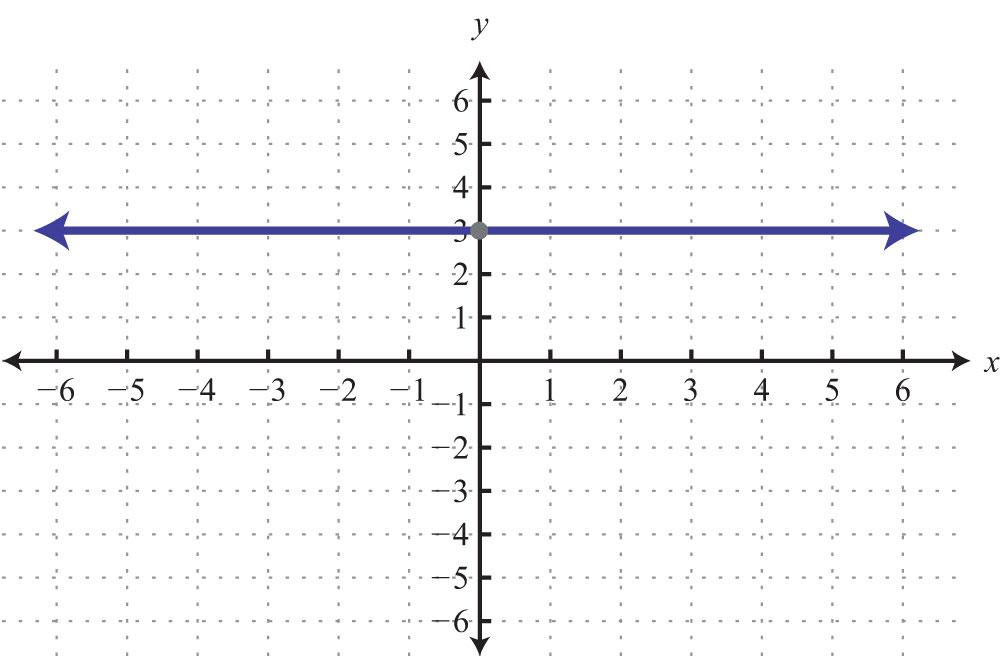
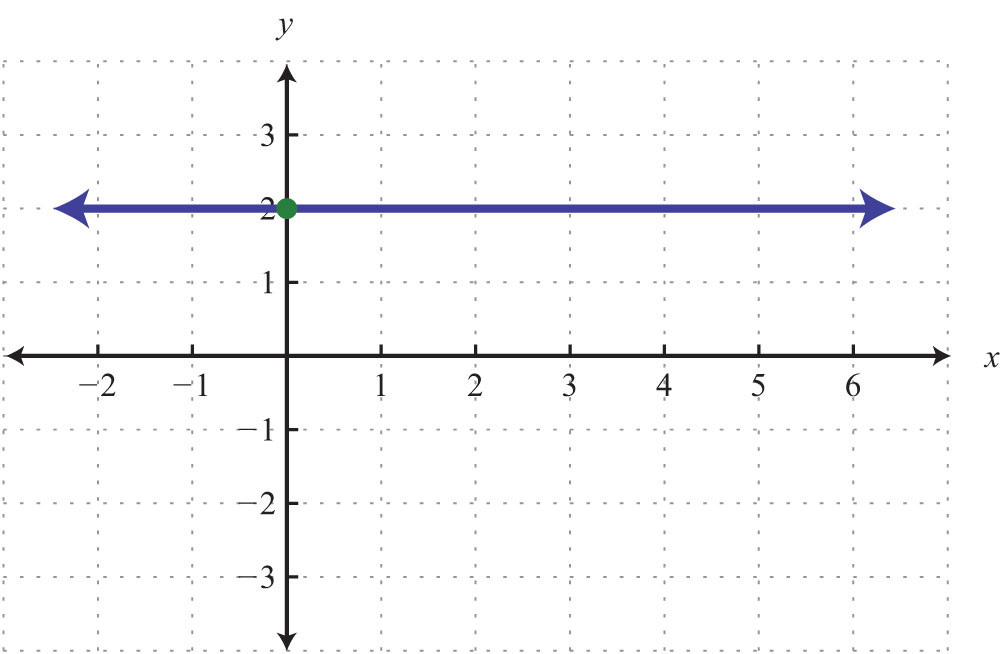
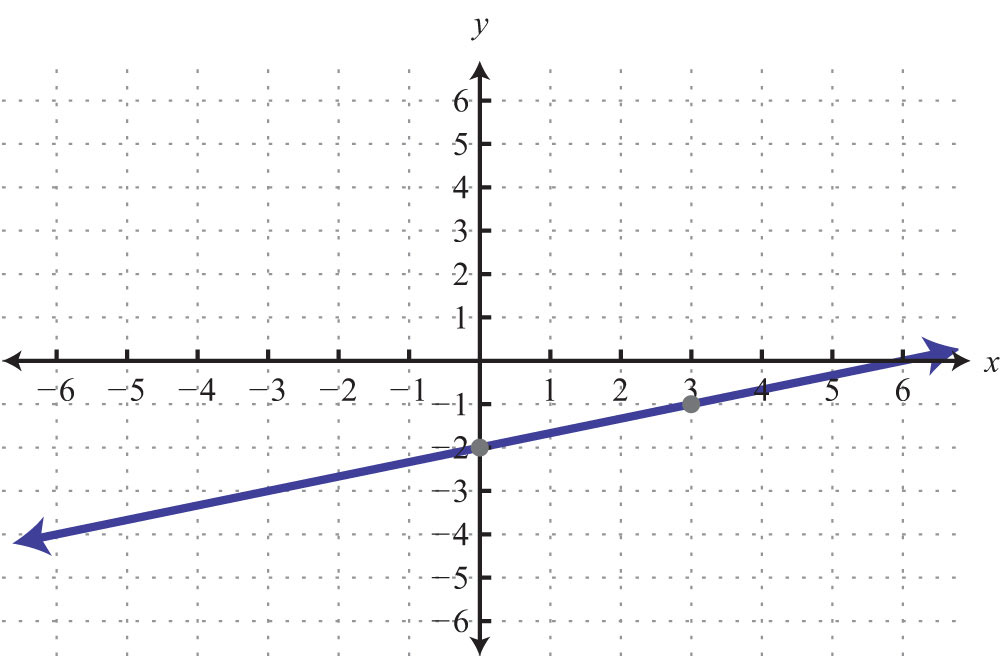
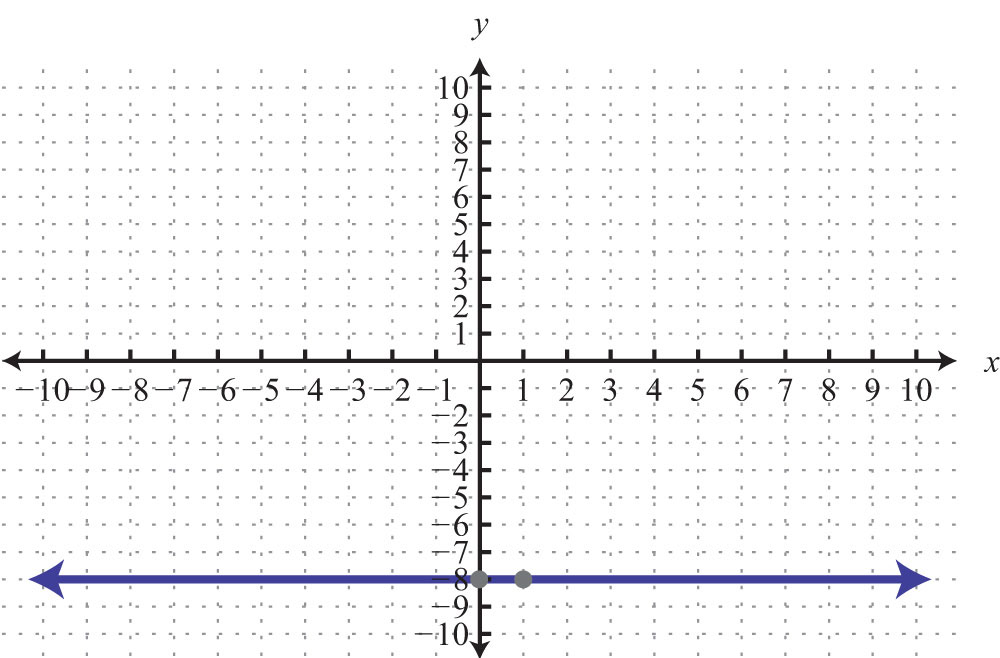
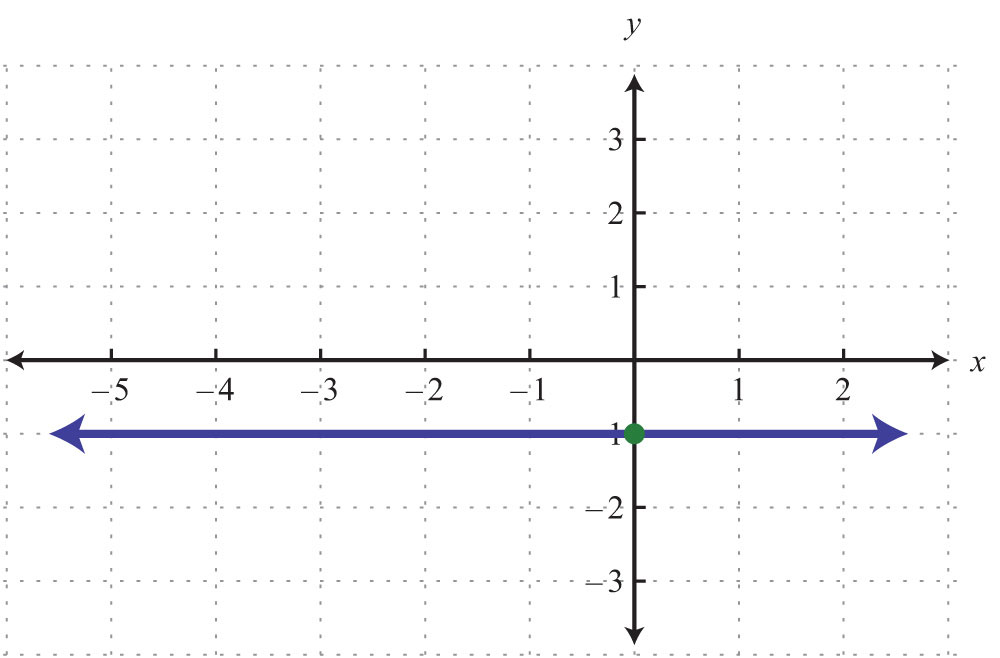
Example 7: Graph by plotting five points: .
Solution: Since the given equation does not have a variable x, we can rewrite it with a 0 coefficient for x.

Choose any five values for x and see that the corresponding y-value is always −2.
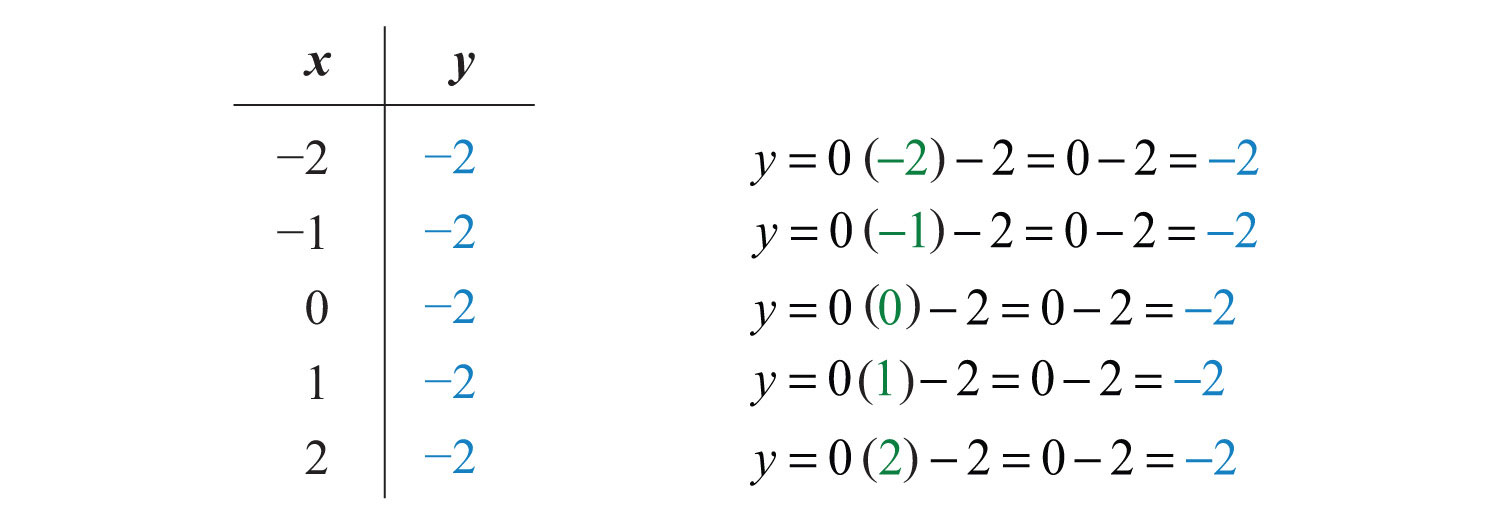
We now have five ordered pair solutions to plot {(−2, −2), (−1, −2), (0, −2), (1, −2), (2, −2)}.
Answer:
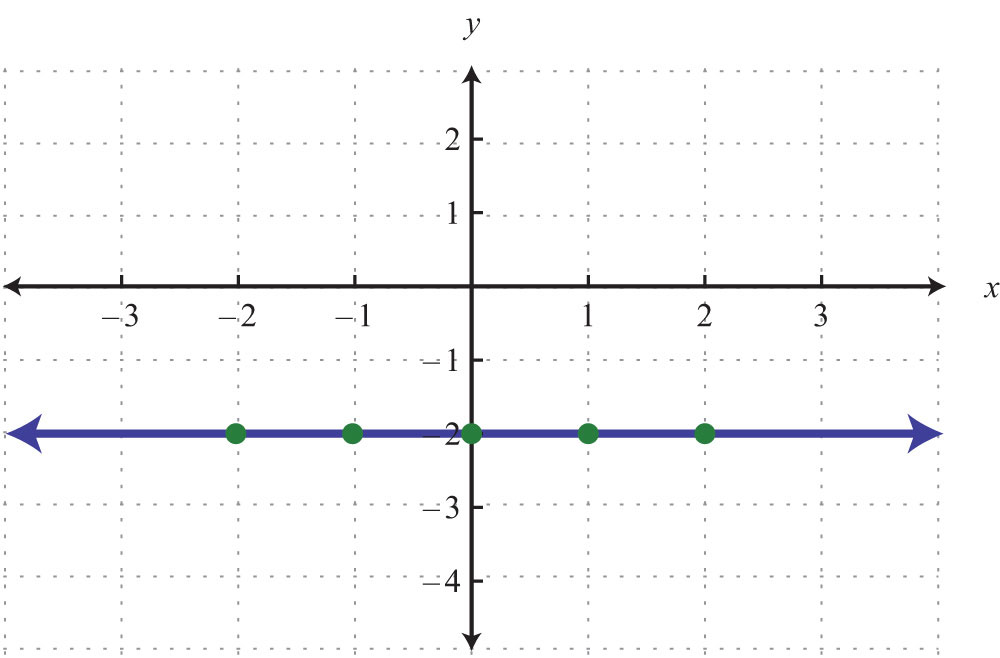
When the coefficient for the variable x is 0, the graph is a horizontal line. In general, the equation for a horizontal lineAny line whose equation can be written in the form y = k, where k is a real number. can be written in the form , where k represents any real number.
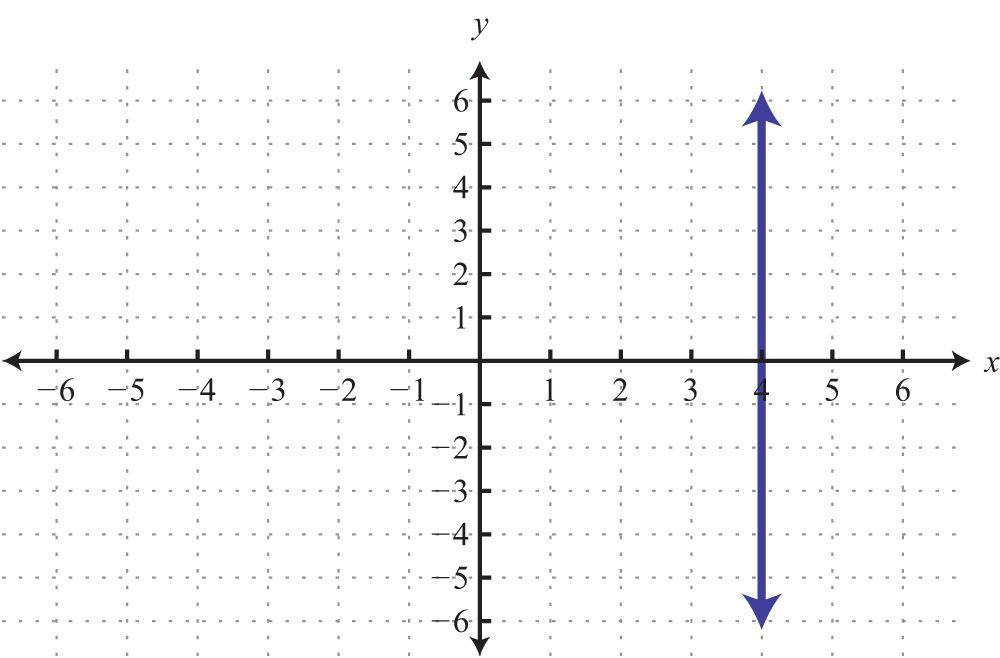
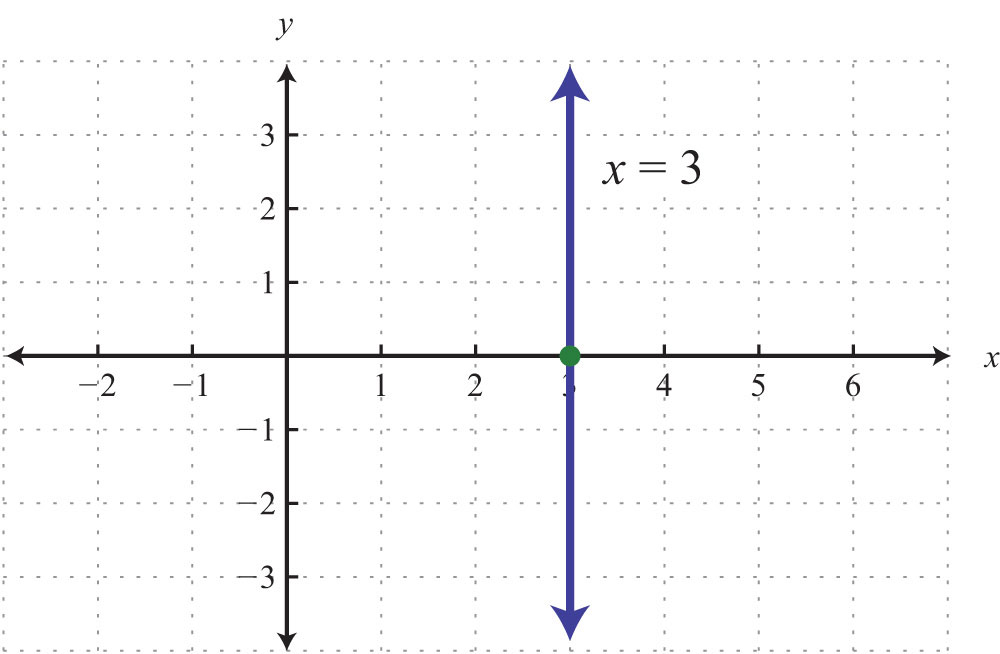
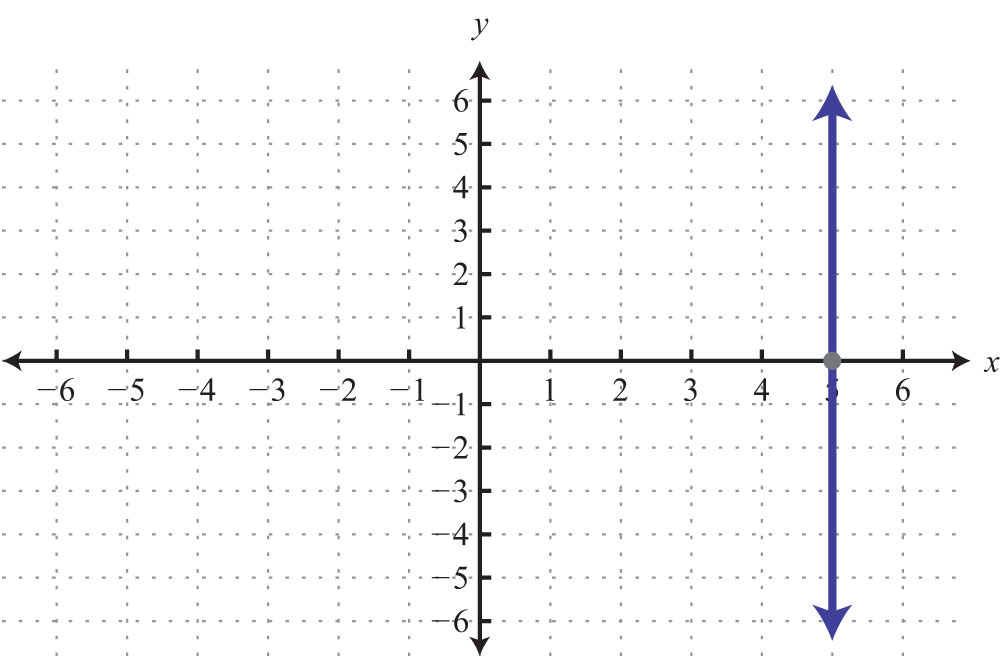
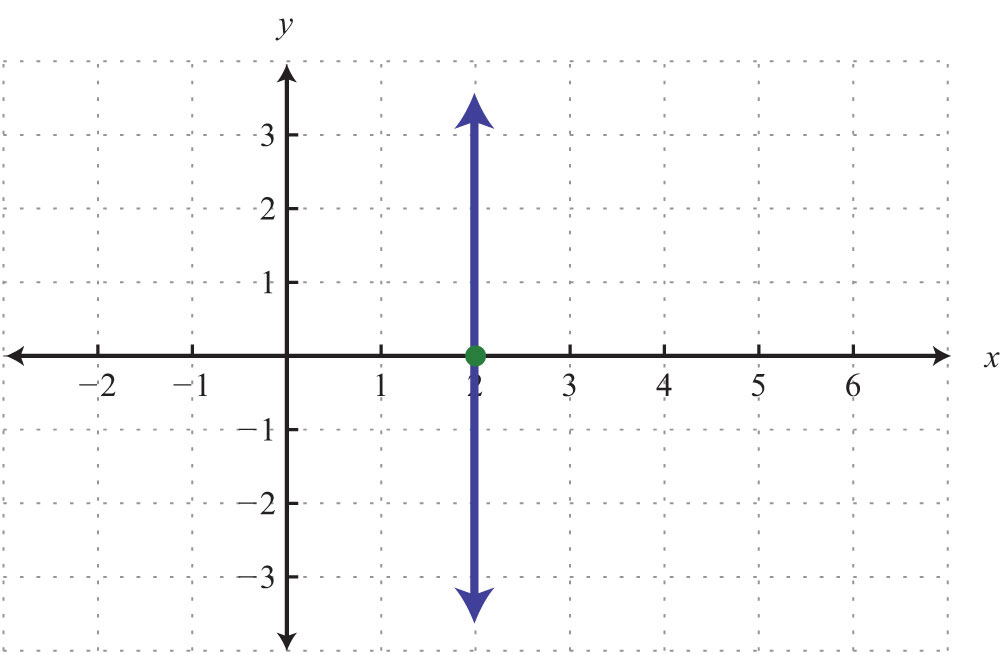
Example 8: Graph by plotting five points: x = 3.
Solution: Since the given equation does not have a variable y, rewrite it with a 0 coefficient for y.

Choose any five values for y and see that the corresponding x-value is always 3.
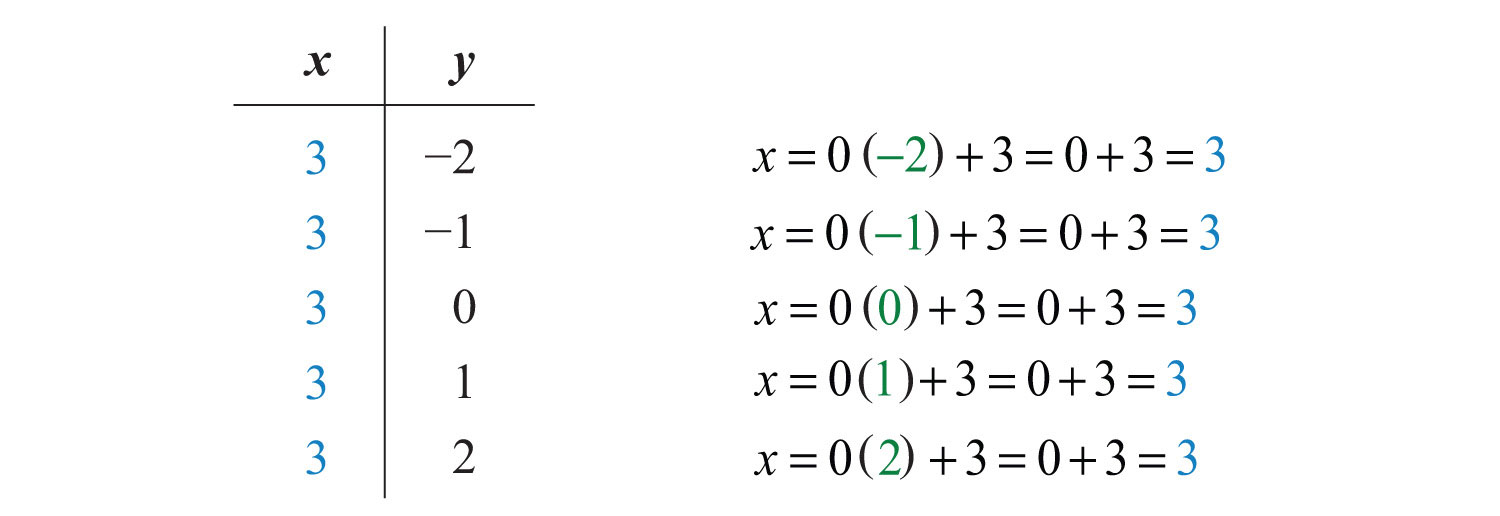
We now have five ordered pair solutions to plot: {(3, −2), (3, −1), (3, 0), (3, 1), (3, 2)}.
Answer:
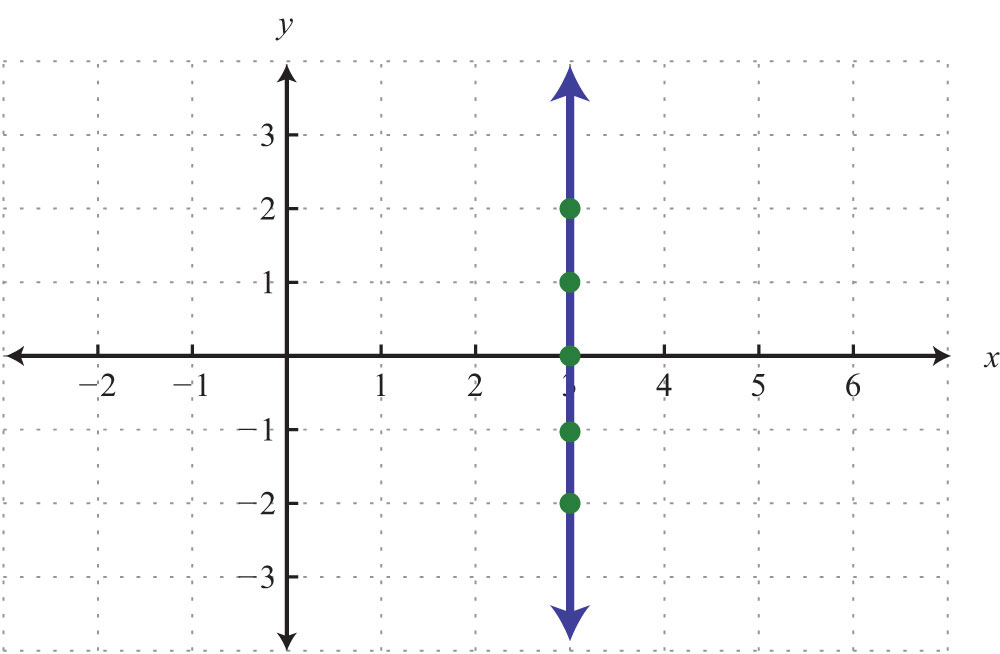
When the coefficient for the variable y is 0, the graph is a vertical line. In general, the equation for a vertical lineAny line whose equation can be written in the form x = k, where k is a real number. can be written as , where k represents any real number.
To summarize, if k is a real number,

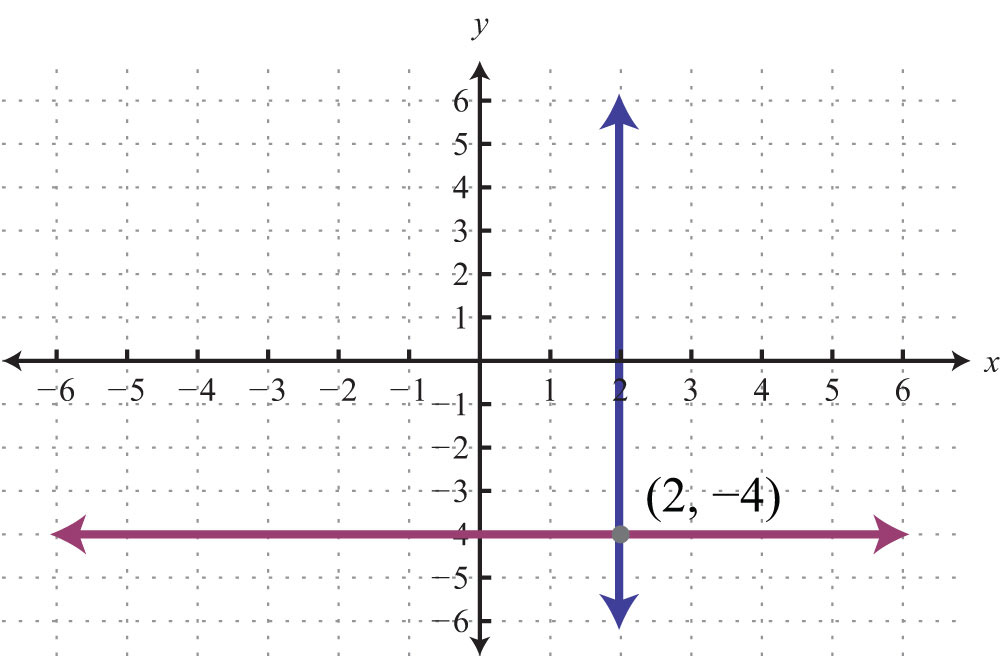
Try this! Graph and on the same set of axes and determine where they intersect.
Answer: (−2, 5)
Video Solution
(click to see video)Key Takeaways
- Solutions to linear equations with two variables are ordered pairs (x, y), where the coordinates, when substituted into the equation, result in a true statement.
- Linear equations with two variables have infinitely many ordered pair solutions. When the solutions are graphed, they are collinear.
- To find ordered pair solutions, choose values for the independent variable, usually x, and substitute them in the equation to find the corresponding y-values.
- To graph linear equations, determine at least two ordered pair solutions and draw a line through them with a straightedge.
- Horizontal lines are described by y = k, where k is any real number.
- Vertical lines are described by x = k, where k is any real number.
Topic Exercises
Part A: Solutions to Linear Systems
Determine whether the given point is a solution.
1. ; (−1, 1)
2. ; (2, −1)
3. ; (4, 6)
4. ; (−2, −3)
5. ; (5, −2)
6. ; (0, −2)
7. ; (1, −2)
8. ; (2, 1)
9. ;
10. ;
11. ; (6, 3)
12. ; (−2, 9)
13. ; (0, −3)
14. ; (8, −5)
15. ;
16. ;
17. ; (−3, 2)
18. ; (4, −4)
19. ; (3, −3)
20. ; (1, 0)
Find the ordered pair solutions given the set of x-values.
21. ; {−2, 0, 2}
22. ; {−4, 0, 4}
23. ; {−2, 0, 2}
24. ; {−1/2, 0, 1/2}
25. ; {−3, 0, 3}
26. ; {−1/4, 0, 1/4}
27. ; {0, 1, 2}
28. ; {−5, 0, 5}
29. ; {−5, −1, 0}
30. ; {−4, −2, 0}
31. ; {−15, −10, −5}
32. ; {10, 20, 30}
Find the ordered pair solutions, given the set of y-values.
33. ; {−5, 0, 5}
34. ; {0, 2, 4}
35. ; {−3, −1, 0}
36. ; {−4, −2, 0}
37. ; {−1, 0, 1}
38. ; {−20, −10, −5}
Part B: Graphing Lines
Given the set of x-values {−2, −1, 0, 1, 2}, find the corresponding y-values and graph them.
39.
40.
41.
42.
43.
44.
45.
46.
47.
48.
Find at least five ordered pair solutions and graph.
49.
50.
51.
52.
53.
54.
55.
56.
57.
58.
59.
60.
61.
62.
63.
64.
65.
66.
Part C: Horizontal and Vertical Lines
Find at least five ordered pair solutions and graph them.
67.
68.
69.
70.
71.
72.
73.
74.
75. Graph the lines and on the same set of axes. Where do they intersect?
76. Graph the lines and on the same set of axes. Where do they intersect?
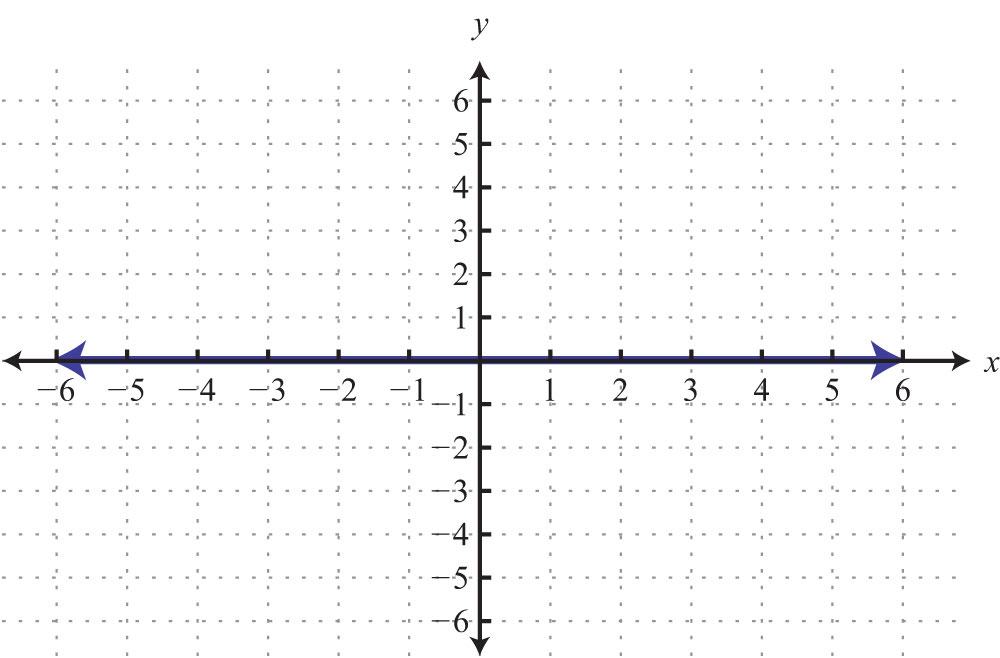
77. What is the equation that describes the x-axis?
78. What is the equation that describes the y-axis?
Part D: Mixed Practice
Graph by plotting points.
79.
80.
81.
82.
83.
84.
Part E: Discussion Board Topics
85. Discuss the significance of the relationship between algebra and geometry in describing lines.
86. Give real-world examples relating two unknowns.
Answers
1: No
3: Yes
5: Yes
7: Yes
9: Yes
11: No
13: Yes
15: Yes
17: Yes
19: Yes
21: {(−2, 8), (0, 4), (2, 0)}
23: {(−2, 2), (0, 1/2), (2, −1)}
25: {(−3, −4), (0, −4), (3, −4)}
27: {(0, −1/3), (1, 1/3), (2, 1)}
29: {(−5, −2), (−1, 2), (0, 3)}
31: {(−15, 110), (−10, 80), (−5, 50)}
33: {(−8, −5), (2, 0), (12, 5)}
35: {(0, −3), (4/3, −1), (2, 0)}
37: {(−27/2, −1), (−12, 0), (−21/2, 1)}
39:
41:
43:
45:
47:
49:
51:
53:
55:
57:
59:
61:
63:
65:
67:
69:
71:
73:
75:
77:
79:
81:
83:
3.3 Graph Using Intercepts
Learning Objectives
- Identify and find x- and y-intercepts of a graph.
- Graph a line using x- and y-intercepts.
Definition of x- and y-Intercepts
The x-interceptThe point (or points) where a graph intersects the x-axis, expressed as an ordered pair (x, 0). is the point where the graph of a line intersects the x-axis. The y-interceptThe point (or points) where a graph intersects the y-axis, expressed as an ordered pair (0, y). is the point where the graph of a line intersects the y-axis. These points have the form (x, 0) and (0, y), respectively.
To find the x- and y-intercepts algebraically, use the fact that all x-intercepts have a y-value of zero and all y-intercepts have an x-value of zero. To find the y-intercept, set and determine the corresponding y-value. Similarly, to find the x-intercept, set and determine the corresponding x-value.
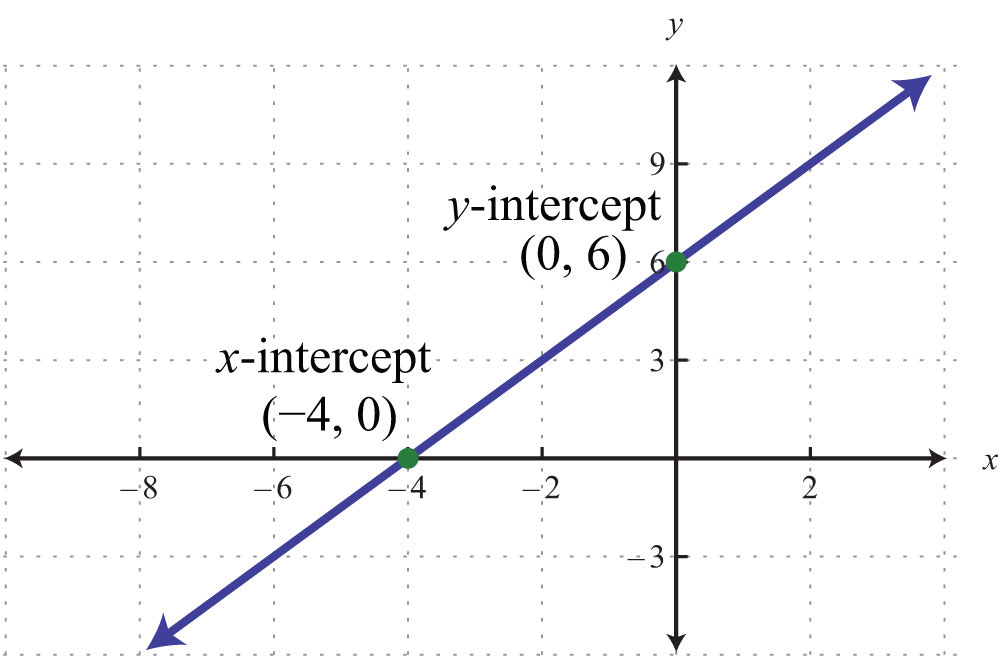
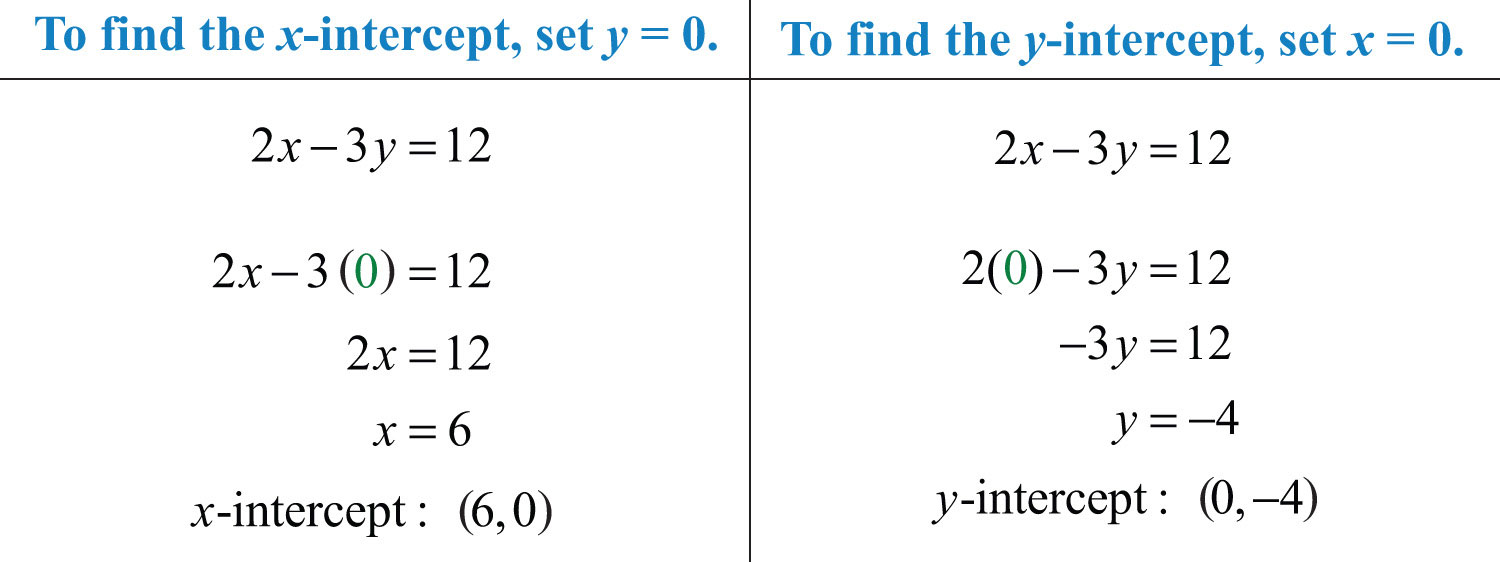
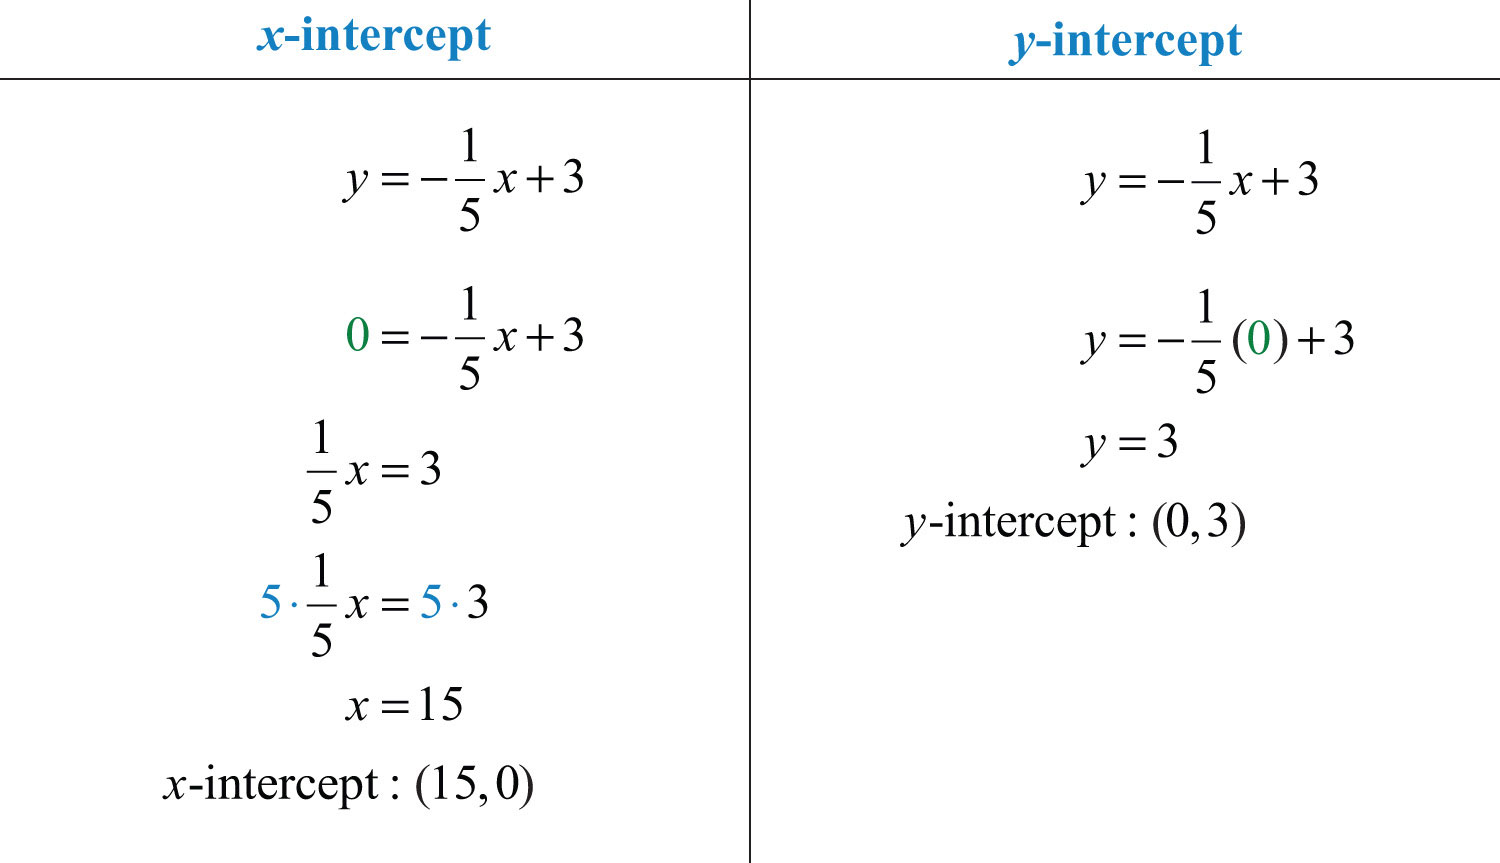
Example 1: Find the x- and y-intercepts: .
Solution: To find the x-intercept, set y = 0.
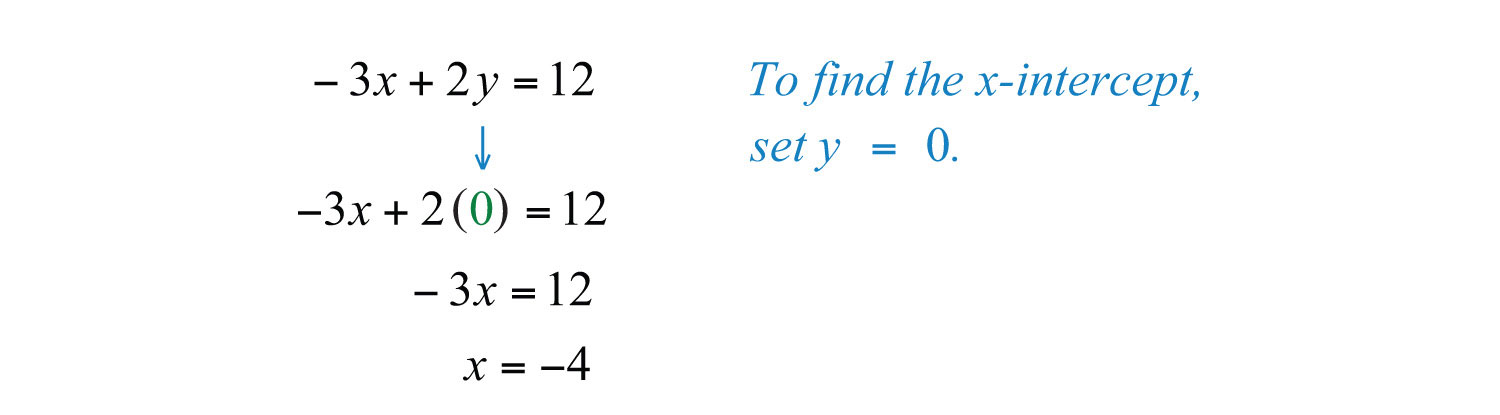
Therefore, the x-intercept is (−4, 0). To find the y-intercept, set x = 0.
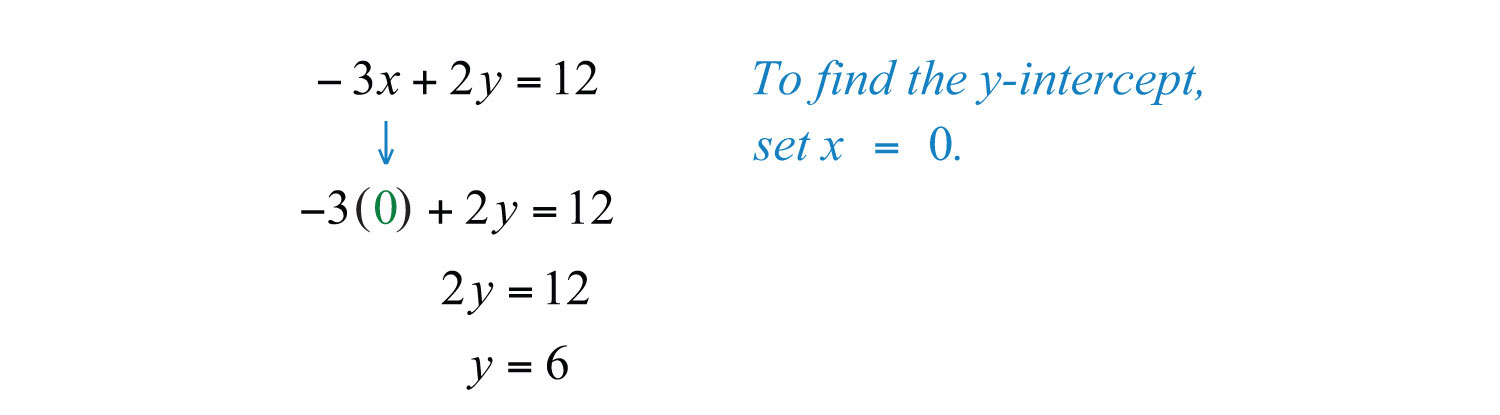
Hence the y-intercept is (0, 6). Note that this linear equation is graphed above.
Answer: x-intercept: (−4, 0); y-intercept: (0, 6)
Example 2: Find the x- and y-intercepts: .
Solution: Begin by finding the x-intercept.

The x-intercept is (3, 0). Next, determine the y-intercept.

The y-intercept is (0, 9).
Answer: x-intercept: (3, 0); y-intercept: (0, 9)
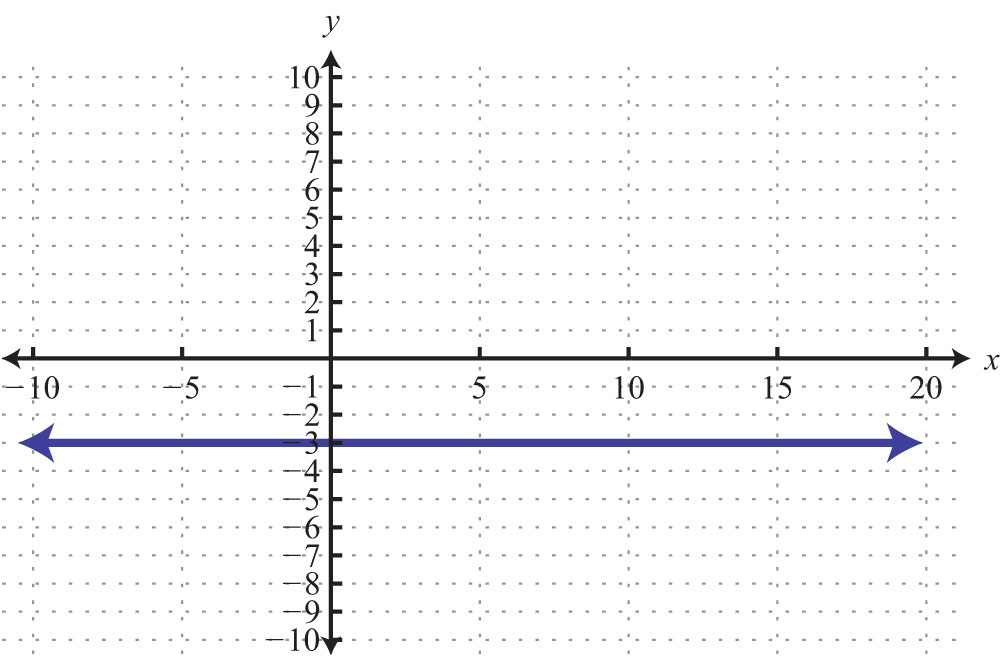
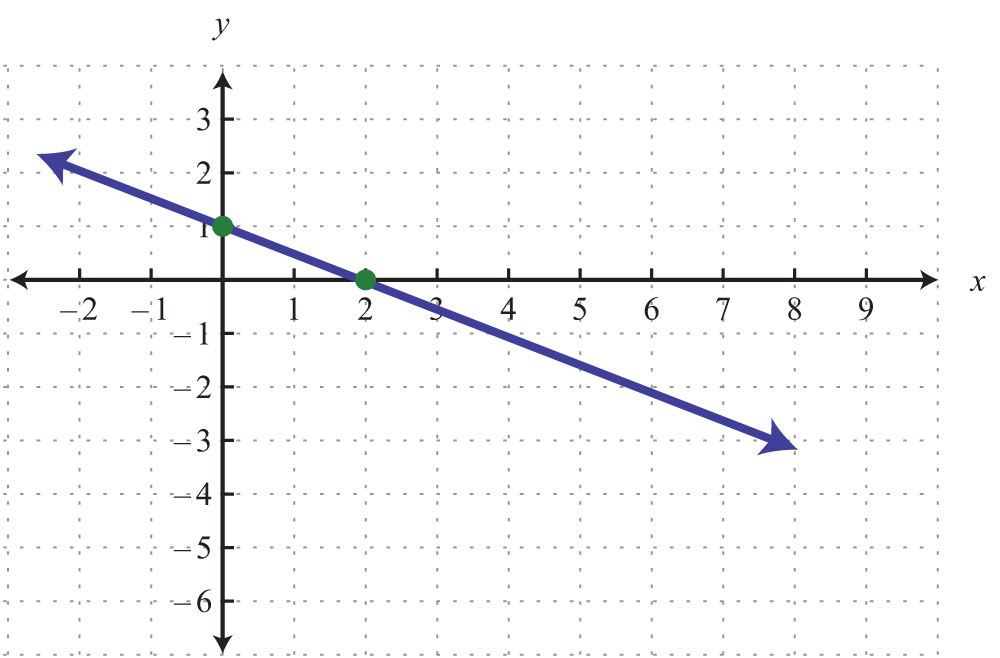
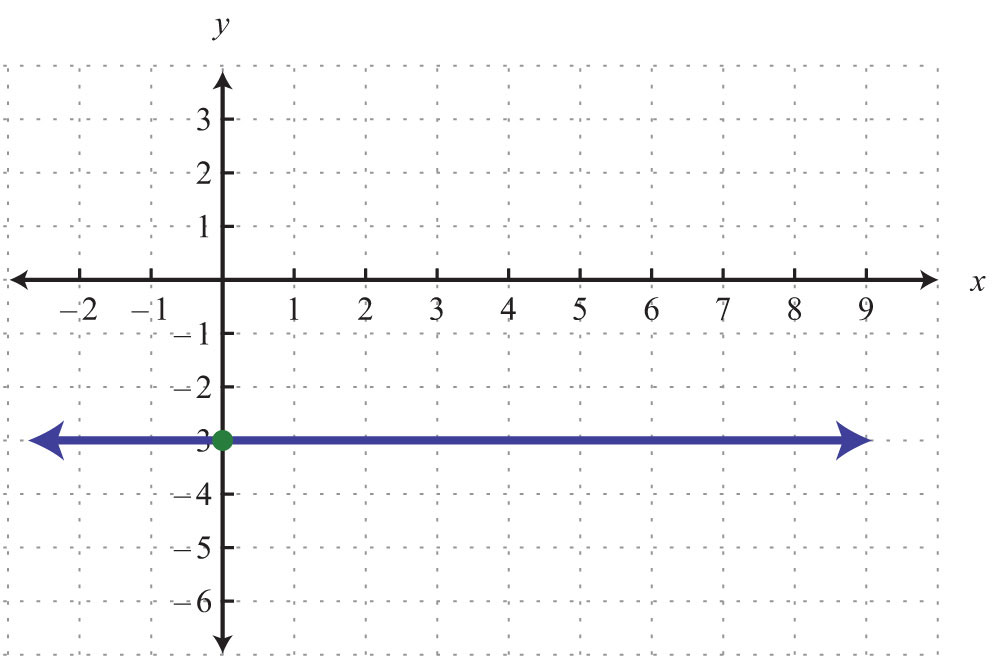
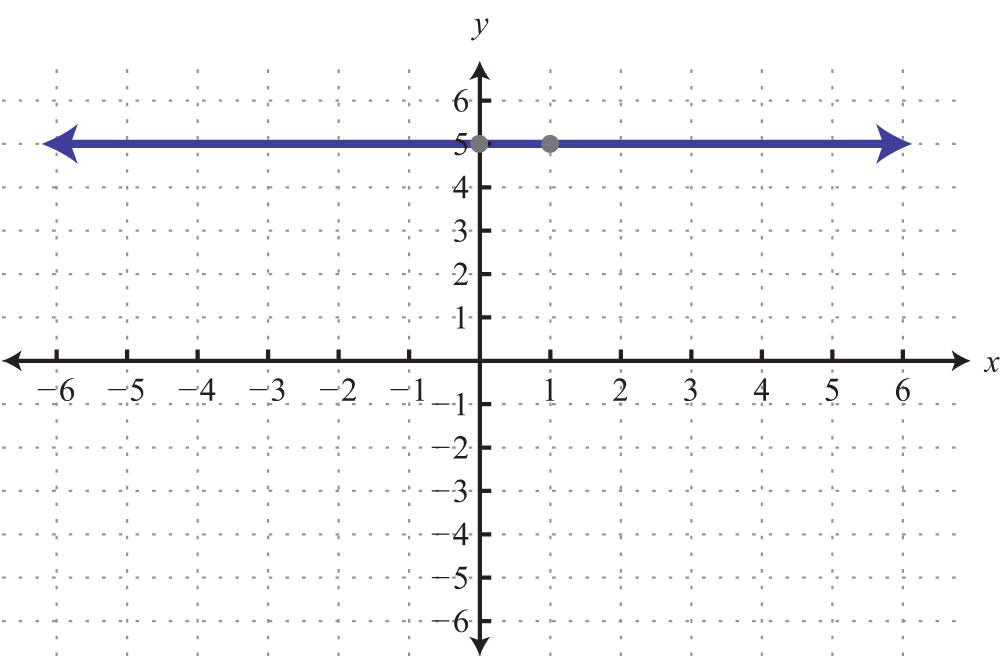
Keep in mind that the intercepts are ordered pairs and not numbers. In other words, the x-intercept is not but rather (2, 0). In addition, not all graphs necessarily have both intercepts: for example,
The horizontal line graphed above has a y-intercept of (0, −2) and no x-intercept.
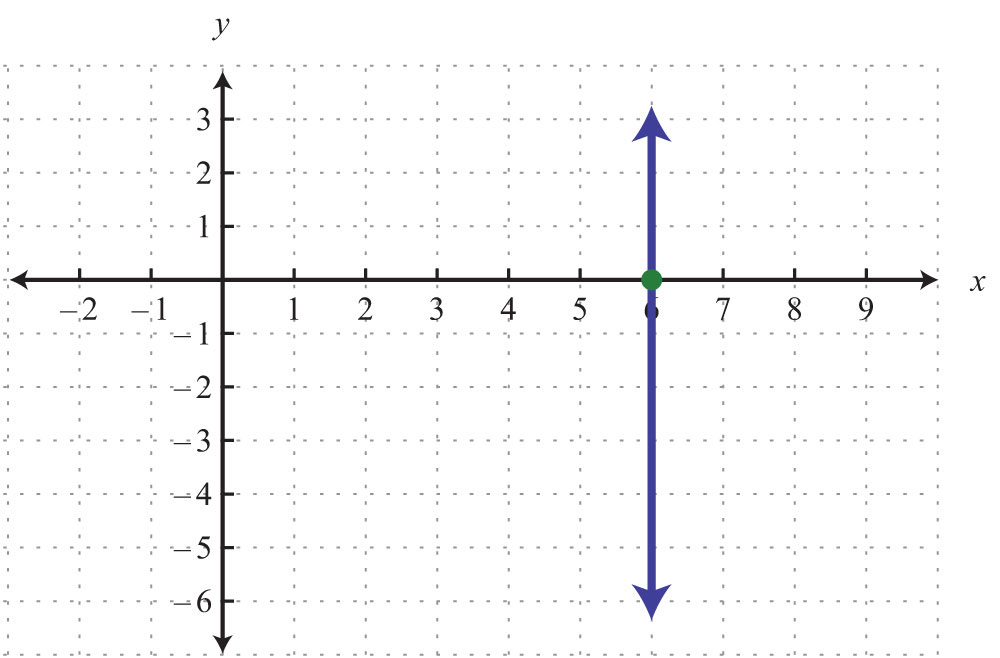
The vertical line graphed above has an x-intercept (3, 0) and no y-intercept.
Try this! Find the x- and y-intercepts: .
Answer: x-intercept: (1/2, 0); y-intercept: (0, −2)
Video Solution
(click to see video)Graphing Lines Using Intercepts
Since two points determine a line, we can use the x- and y-intercepts to graph linear equations. We have just outlined an easy method for finding intercepts; now we outline the steps for graphing lines using the intercepts.
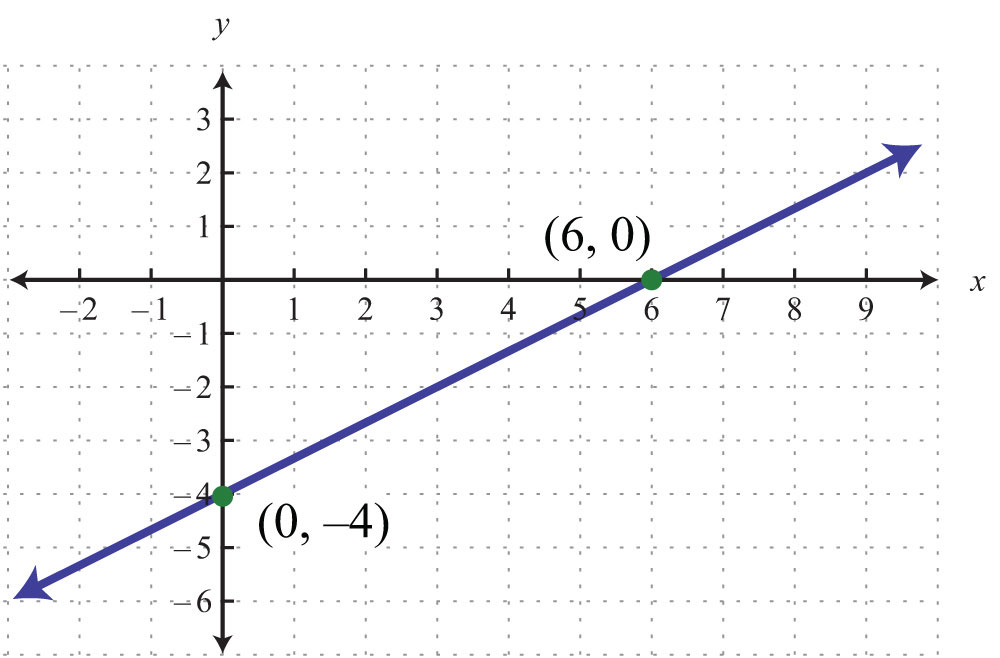
Example 3: Graph using intercepts: .
Solution:
Step 1: Find the x- and y-intercepts.
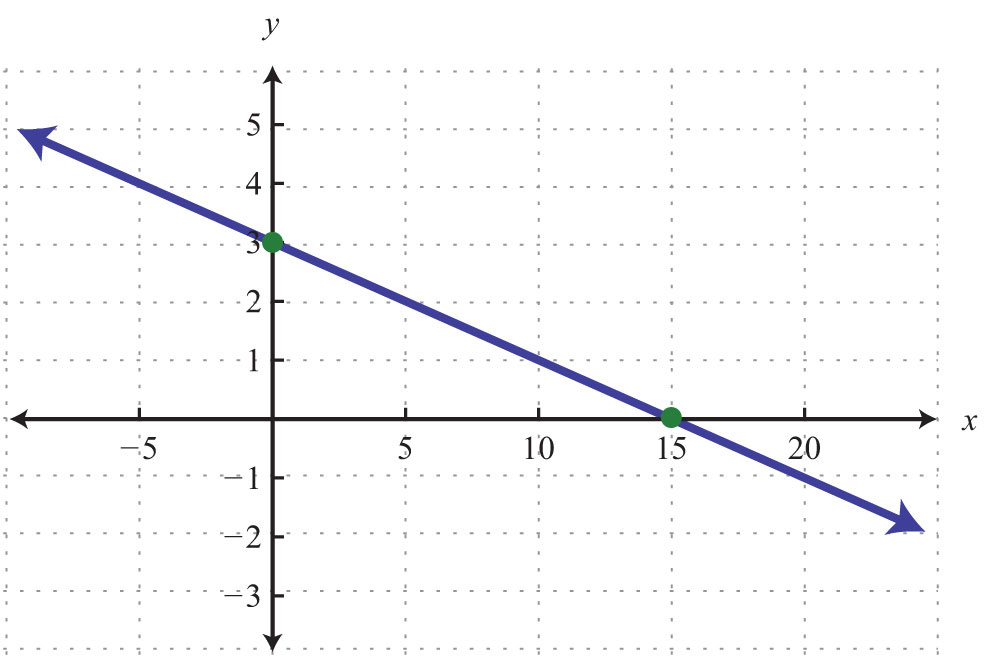
Step 2: Plot the intercepts and draw the line through them. Use a straightedge to create a nice straight line. Add an arrow on either end to indicate that the line continues indefinitely in either direction.
Answer:
Example 4: Graph using intercepts: .
Solution: Begin by determining the x- and y-intercepts.
Next, graph the two points and draw a line through them with a straightedge.
Answer:
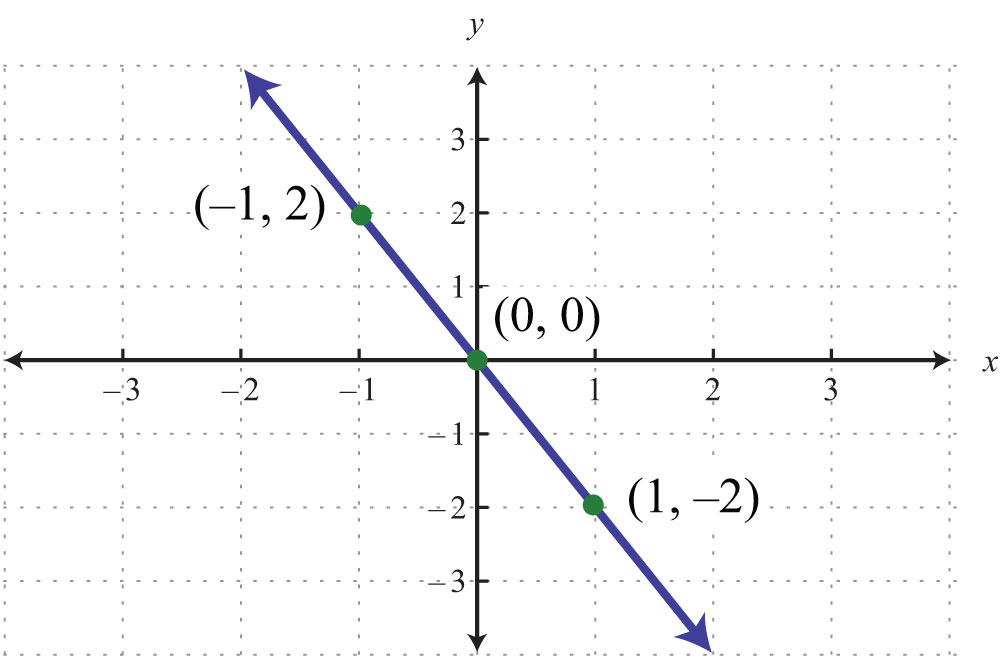
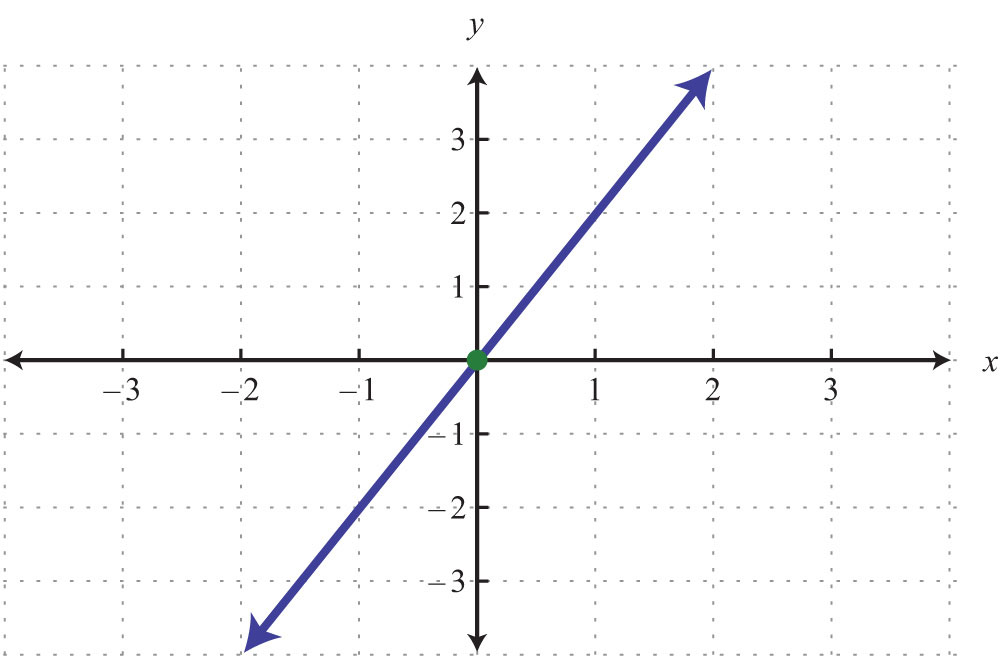
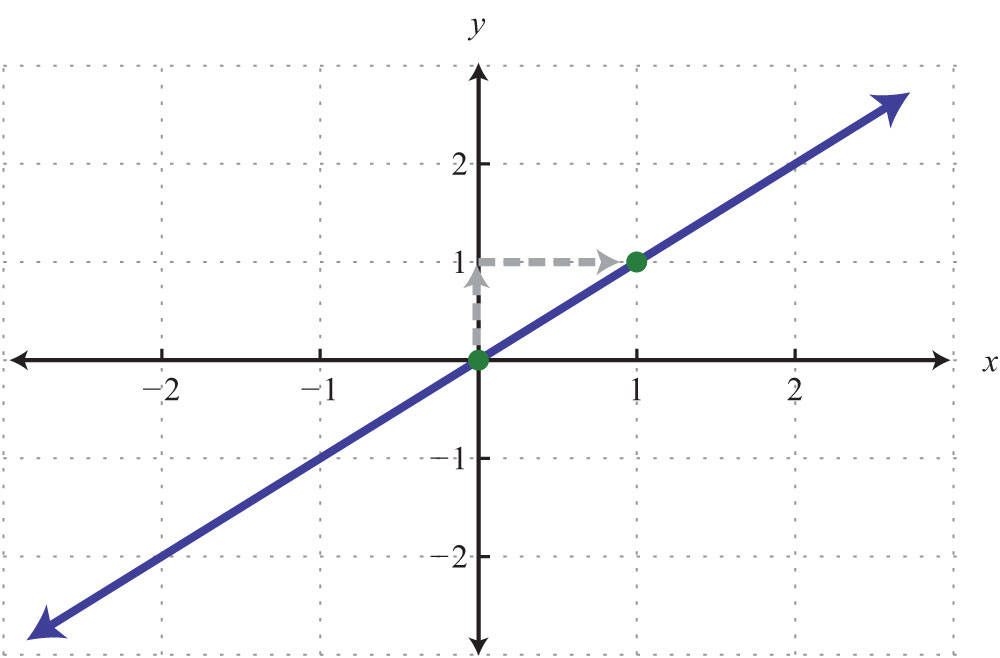
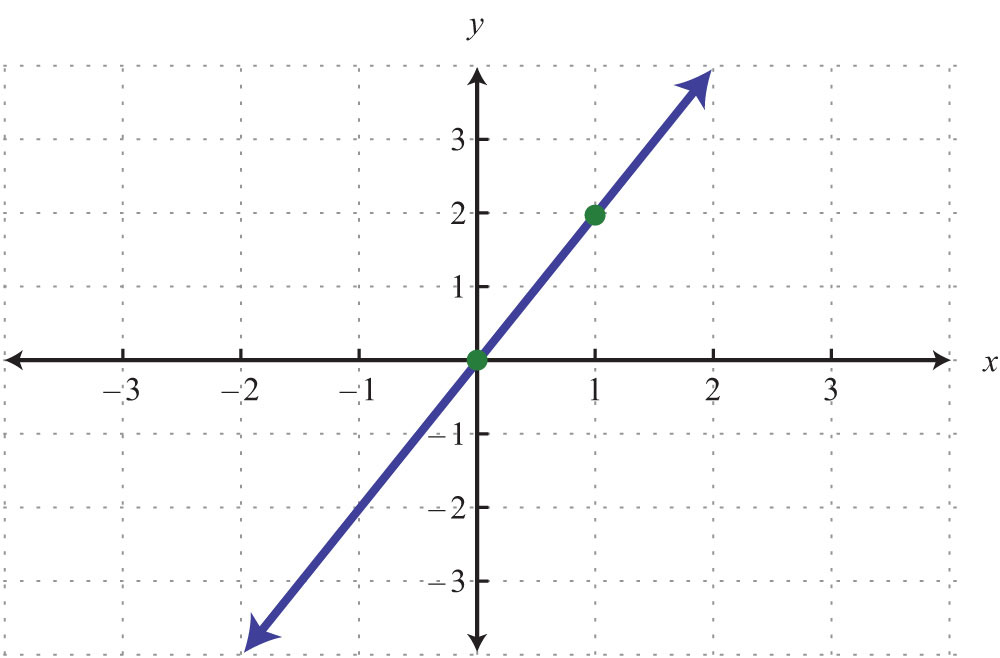
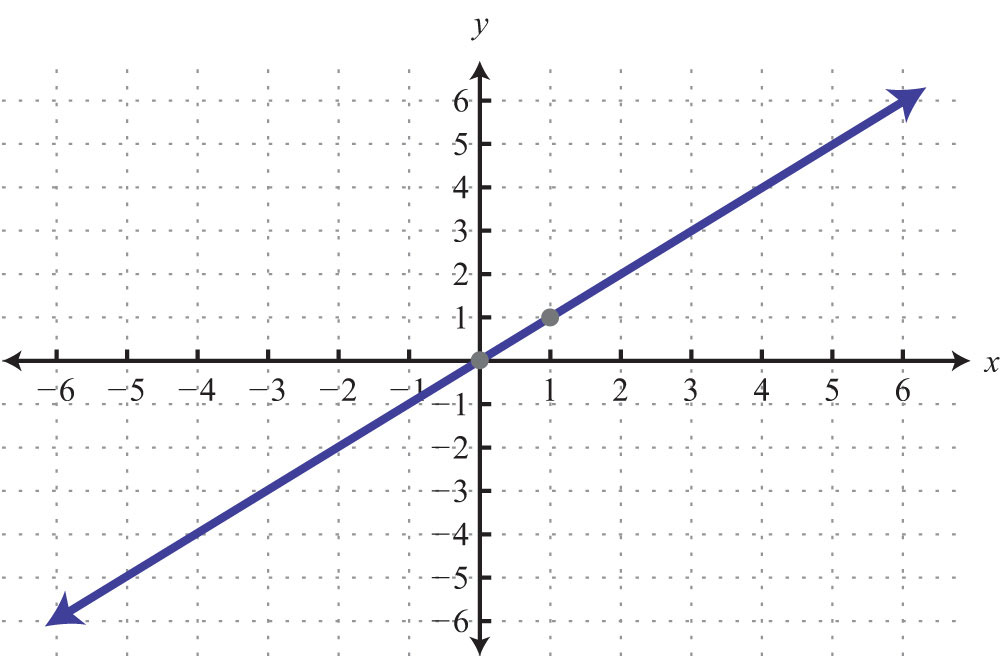
Example 5: Graph using intercepts: .
Solution:
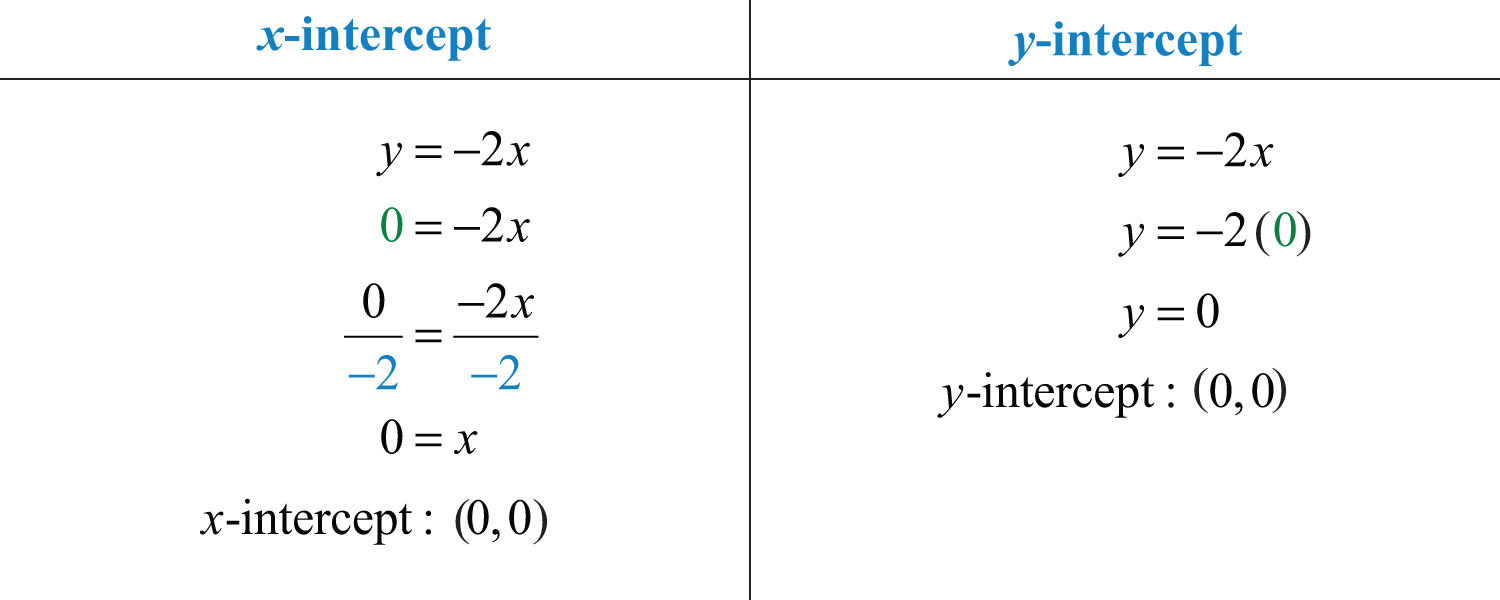
Here the x- and y-intercepts are actually the same point, the origin. We will need at least one more point so that we can graph the line. Choose any value for x and determine the corresponding value for y.
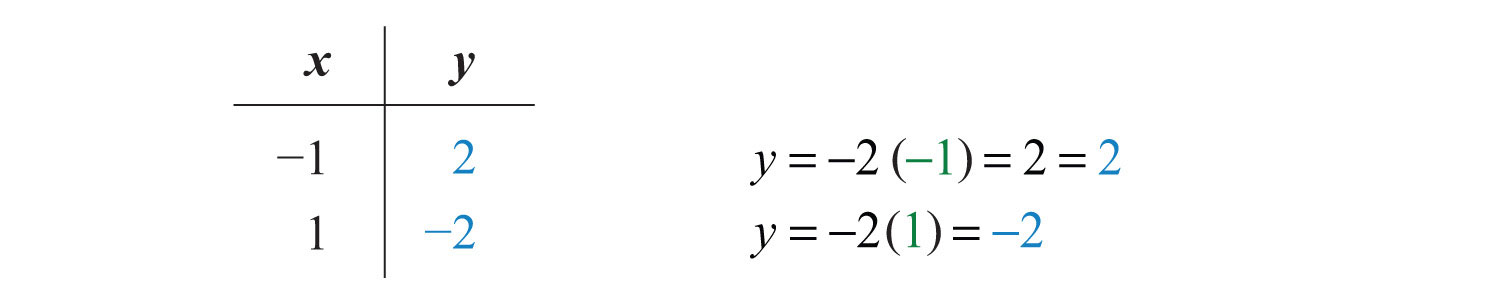
Use the ordered pair solutions (0, 0), (−1, 2), and (1, −2) to graph the line.
Answer:
To summarize, any linear equation can be graphed by finding two points and connecting them with a line drawn with a straightedge. Two important and useful points are the x- and y-intercepts; find these points by substituting y = 0 and x = 0, respectively. This method for finding intercepts will be used throughout our study of algebra.
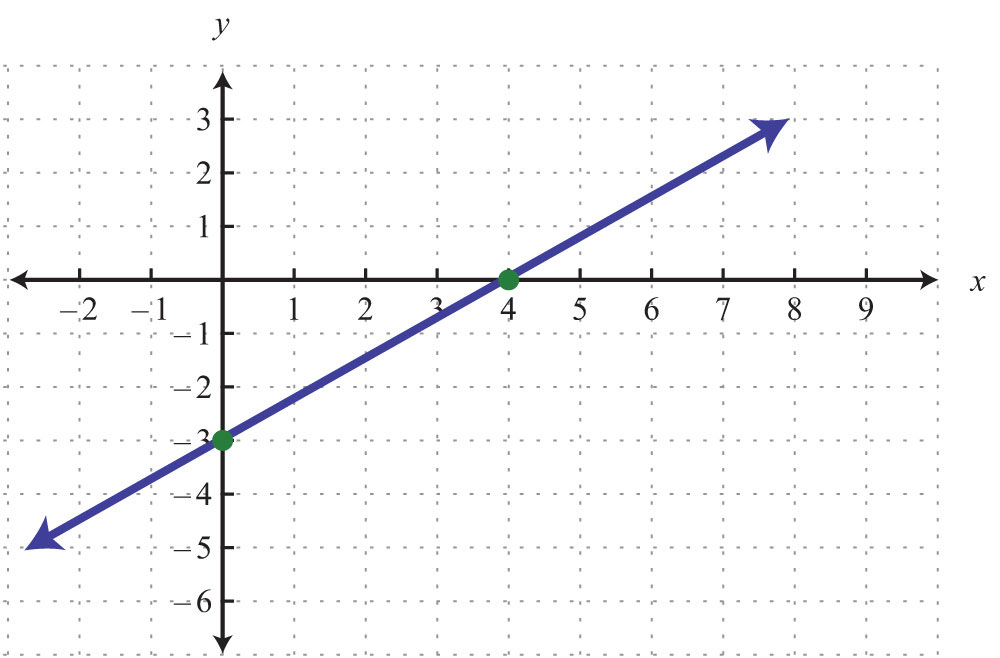
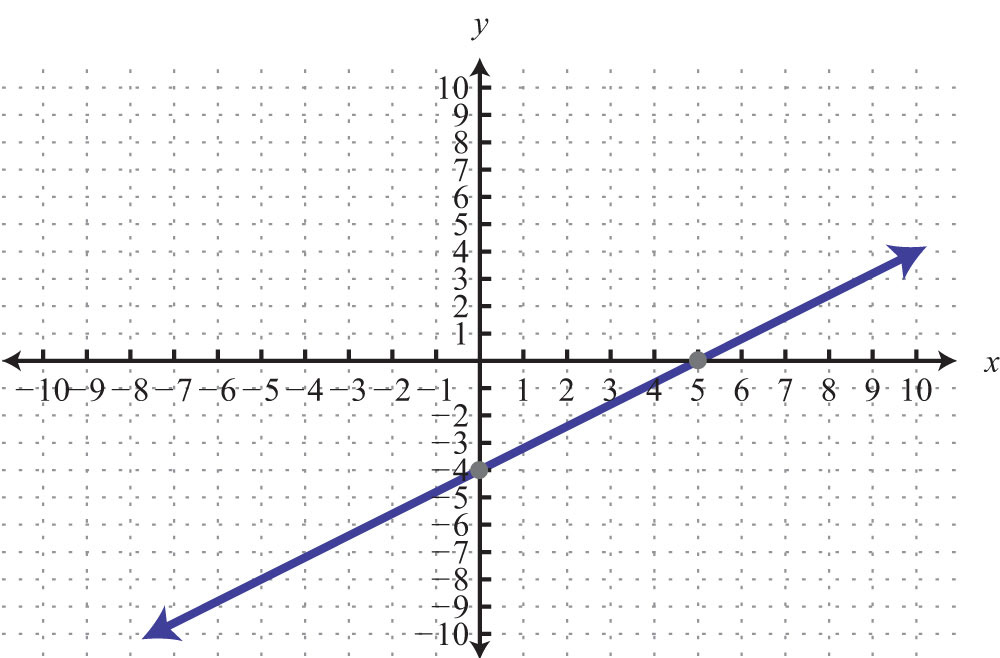
Try this! Graph using intercepts: .
Answer: x-intercept: (5, 0); y-intercept: (0, −3)
Video Solution
(click to see video)Finding Intercepts Given the Graph
The x- and y-intercepts are important points on any graph. This chapter will focus on the graphs of linear equations. However, at this point, we can use these ideas to determine intercepts of nonlinear graphs. Remember that intercepts are ordered pairs that indicate where the graph intersects the axes.
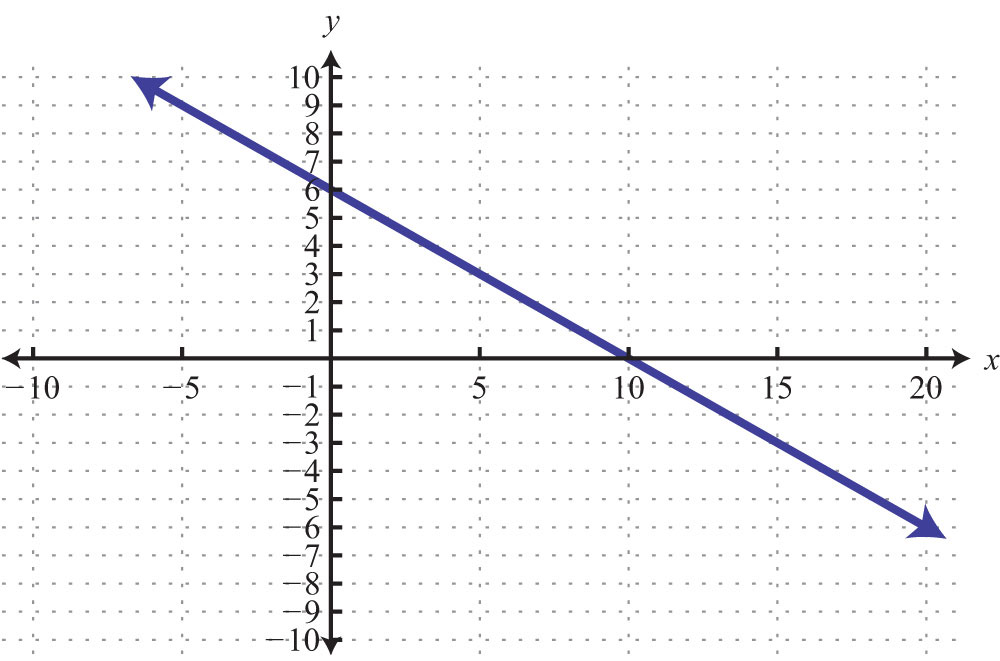
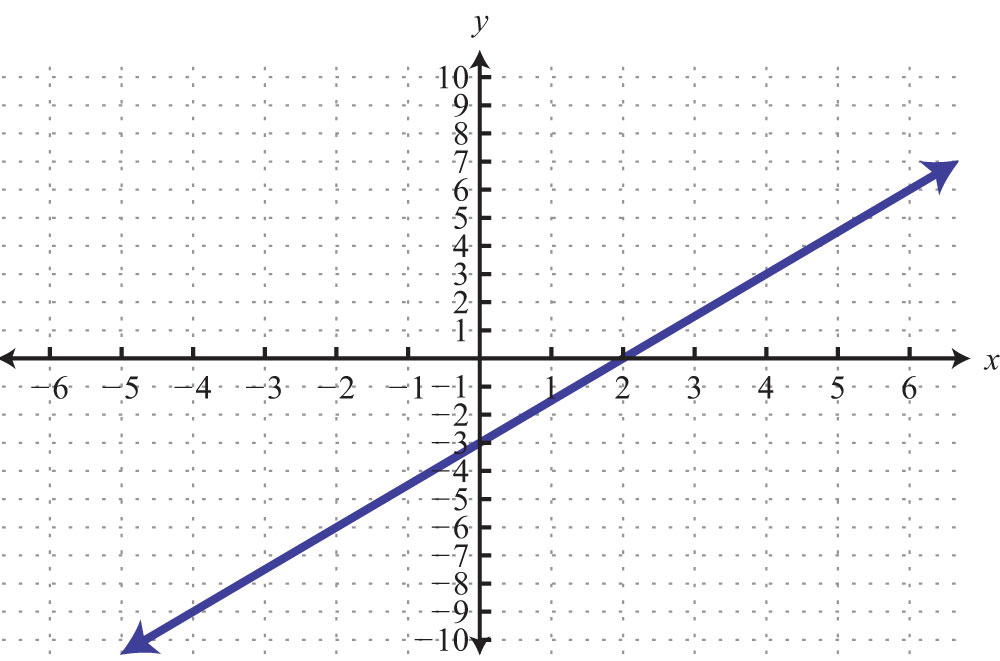
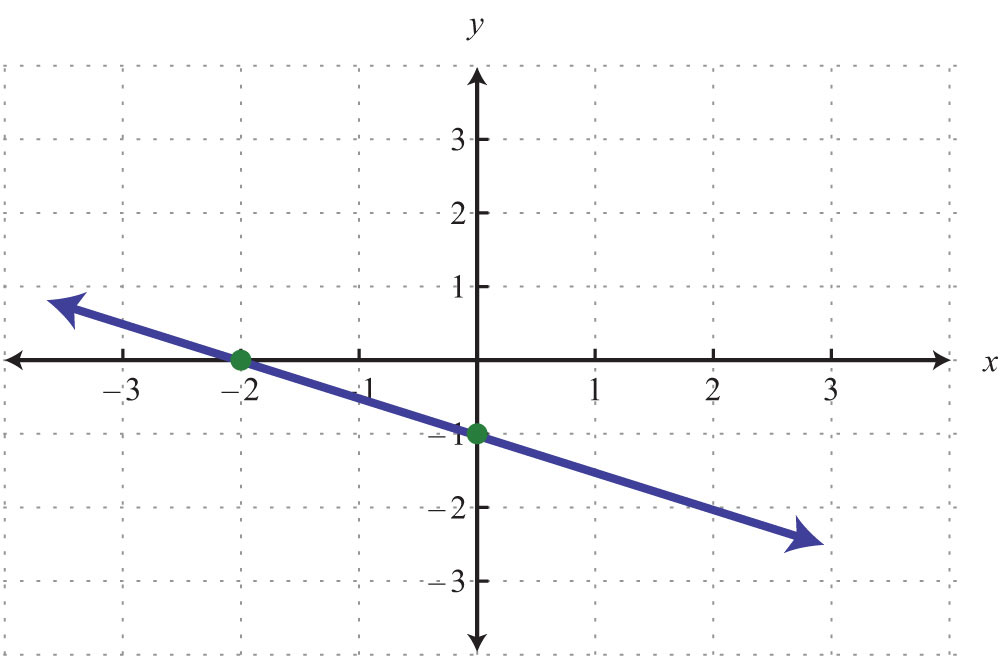
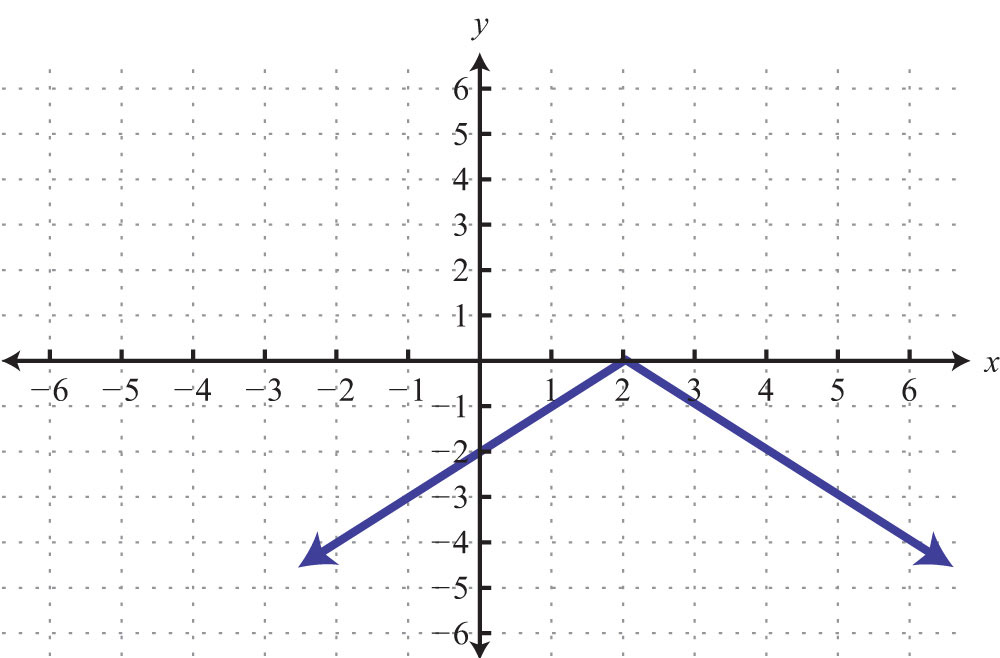
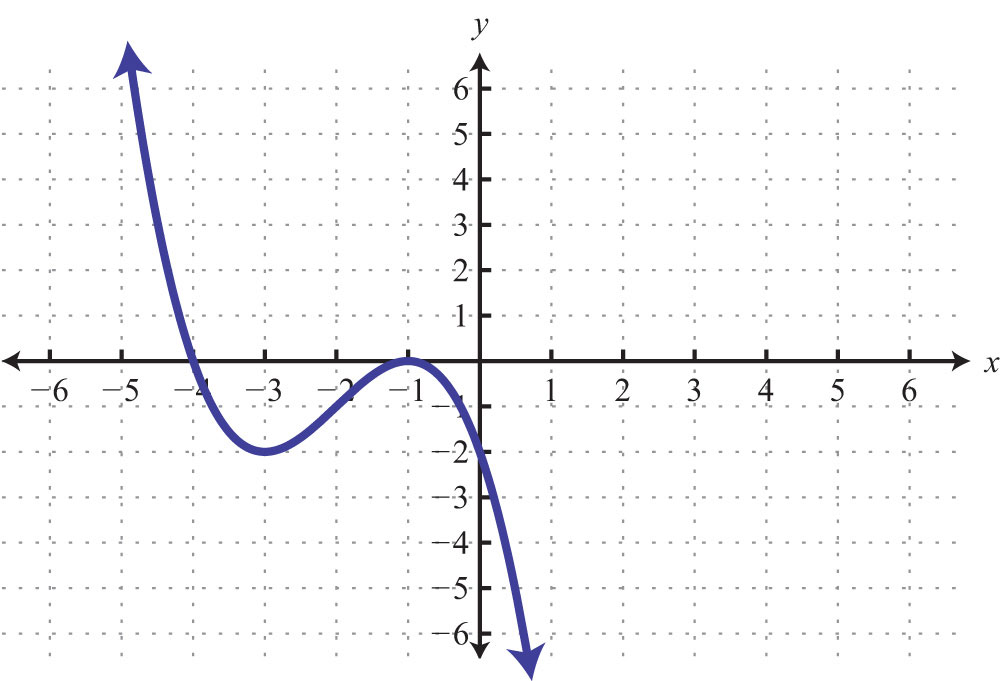
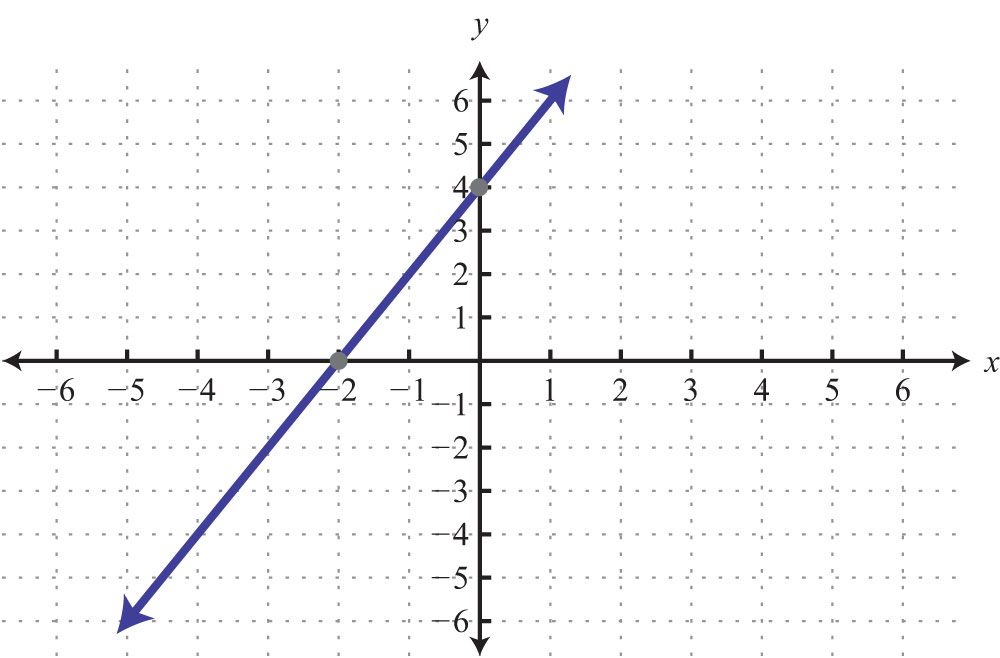
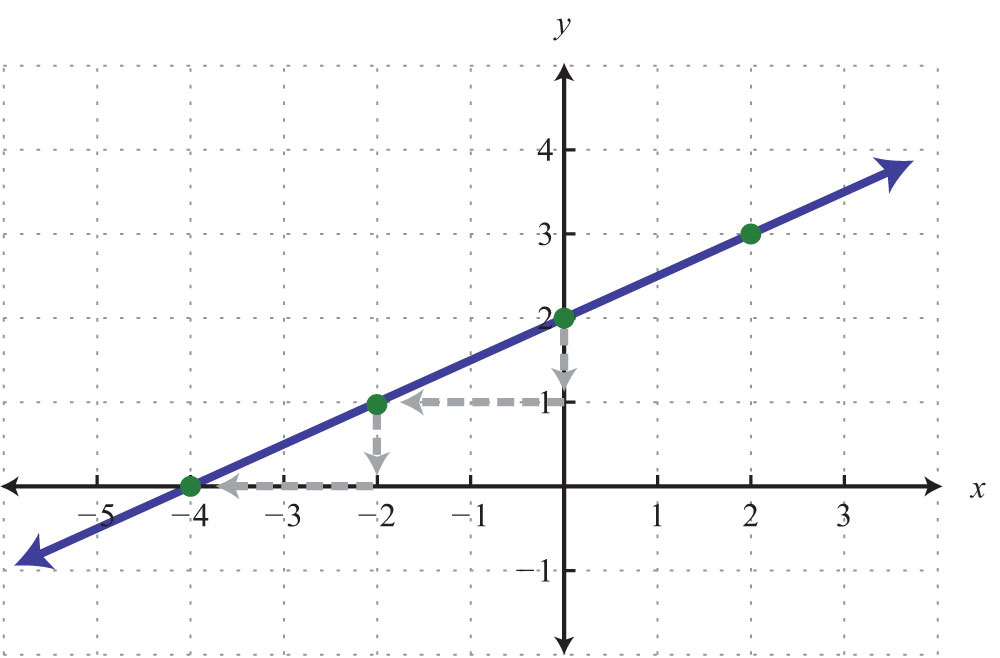
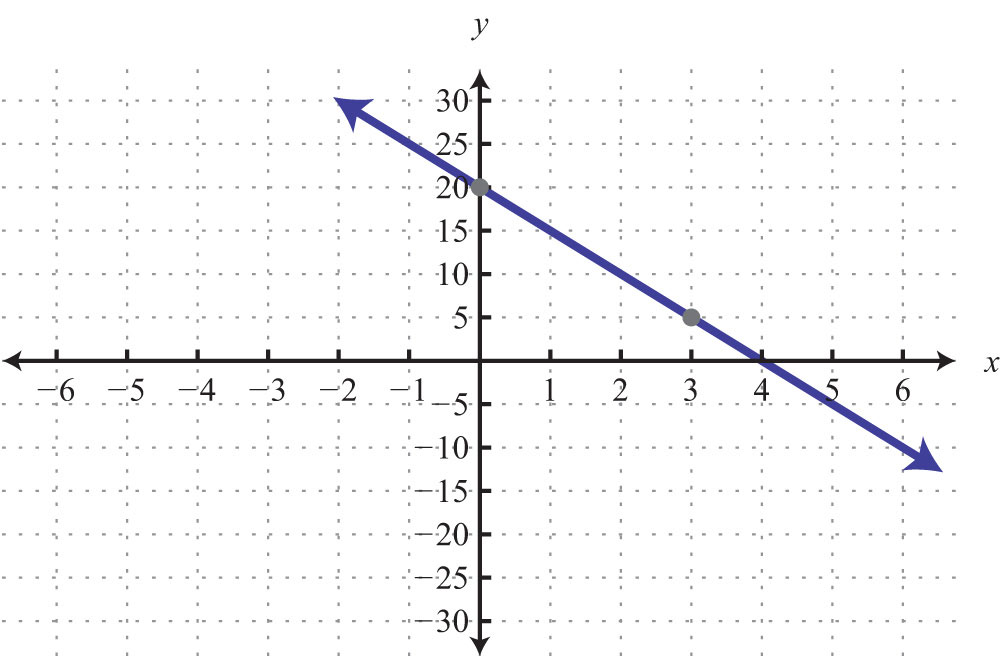
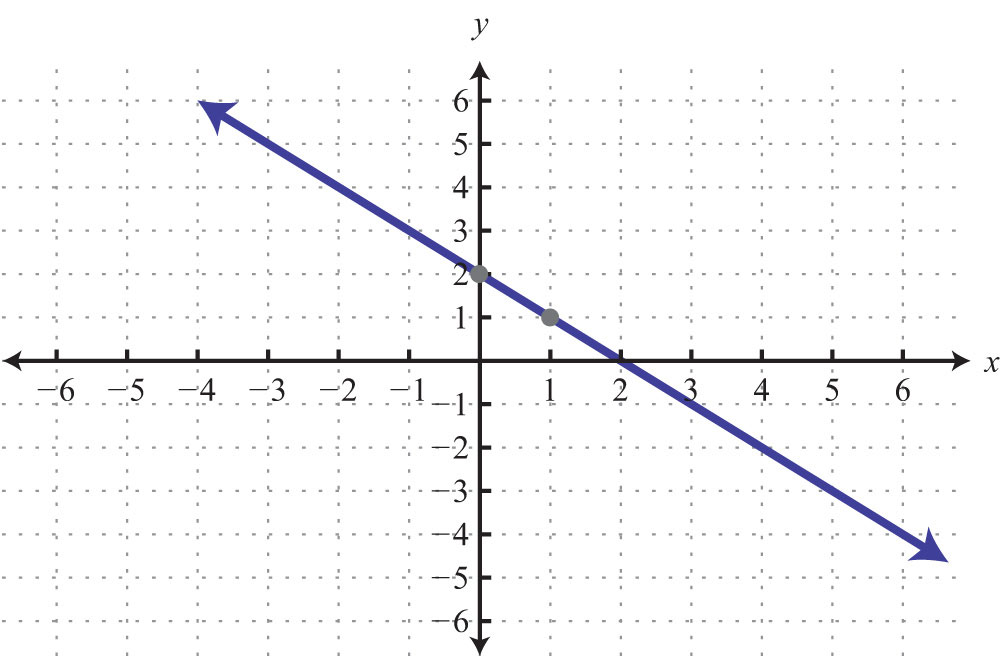
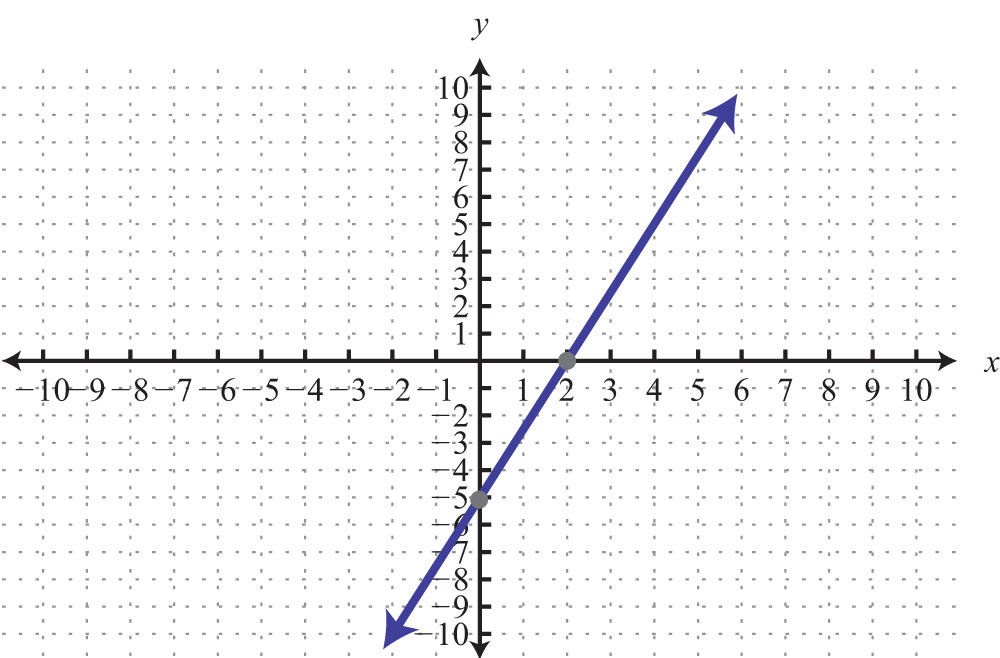
Example 6: Find the x- and y-intercepts given the following graph:
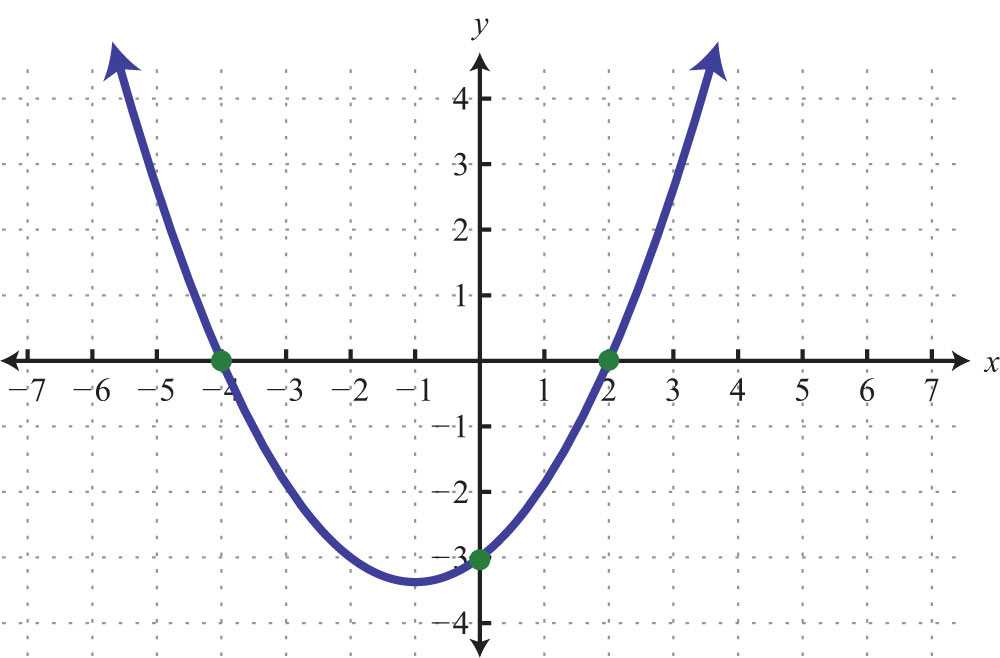
Solution: We see that the graph intersects the x-axis in two places. This graph has two x-intercepts, namely, (−4, 0) and (2, 0). Furthermore, the graph intersects the y-axis in one place. The only y-intercept is (0, −3).
Answer: x-intercepts: (−4, 0), (2, 0); y-intercept: (0, −3)
In our study of algebra, we will see that some graphs have many intercepts. Also, we will see that some graphs do not have any.
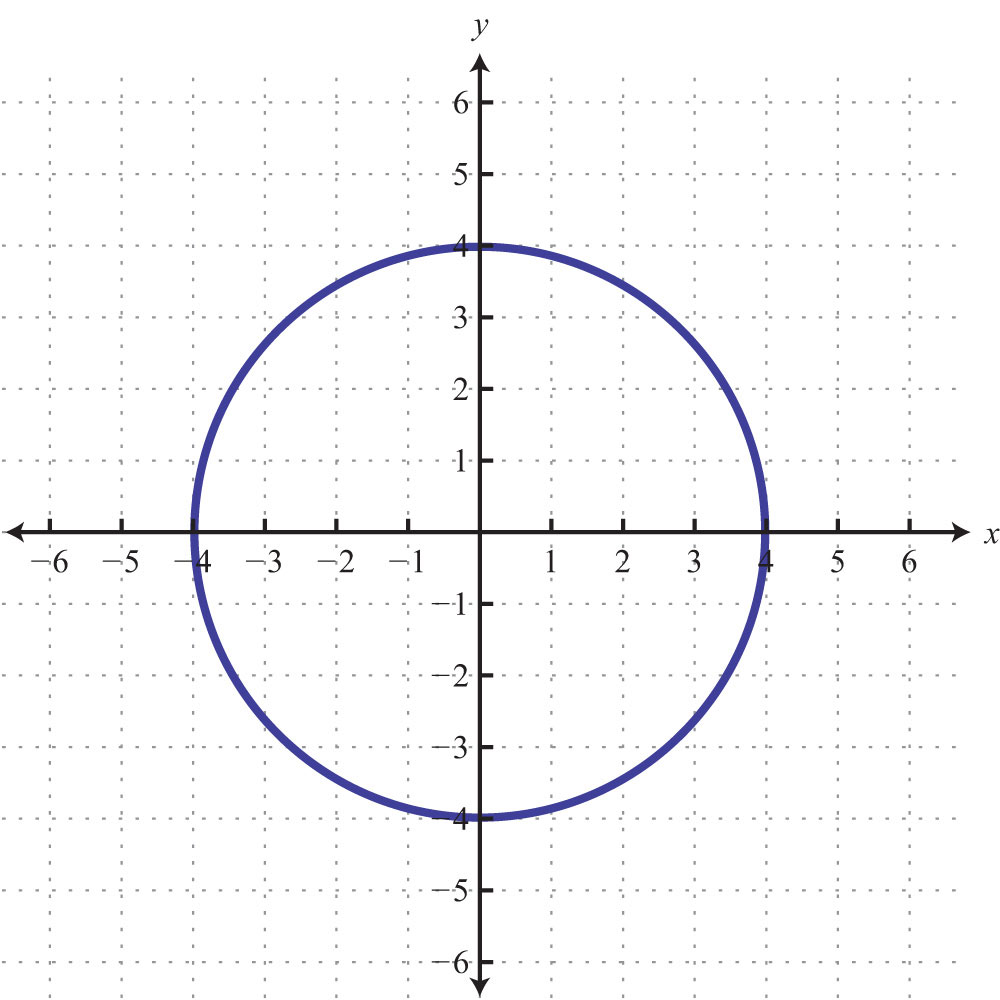
Example 7: Given the following graph, find the x- and y-intercepts:
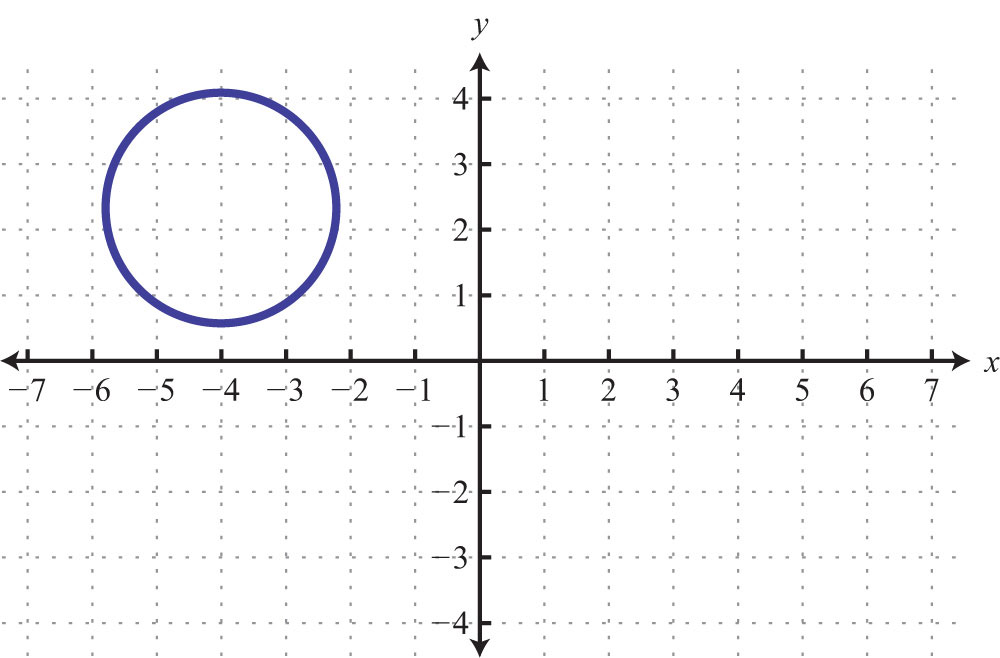
Solution: This is a graph of a circle; we can see that it does not intersect either axis. Therefore, this graph does not have any intercepts.
Answer: None
Key Takeaways
- Since two points determine any line, we can graph lines using the x- and y-intercepts.
- To find the x-intercept, set y = 0 and solve for x.
- To find the y-intercept, set x = 0 and solve for y.
- This method of finding x- and y-intercepts will be used throughout our study of algebra because it works for any equation.
- To graph a line, find the intercepts, if they exist, and draw a straight line through them. Use a straightedge to create the line and include arrows on either end to indicate that the line extends infinitely in either direction.
- Horizontal and vertical lines do not always have both x- and y-intercepts.
Topic Exercises
Part A: Intercepts
Given the graph, find the x- and y-intercepts.
1.
2.
3.
4.
5.
6.
Find the x- and y-intercepts.
7.
8.
9.
10.
11.
12.
13.
14.
15.
16.
17.
18.
19.
20.
Part B: Graph Using Intercepts
Find the intercepts and graph them.
21.
22.
23.
24.
25.
26.
27.
28.
29.
30.
31.
32.
33.
34.
35.
36.
37.
38.
39.
40.
41.
42.
43.
44.
45.
46.
47.
48.
49.
50.
51.
52.
53.
54.
Part C: Intercepts of Nonlinear Graphs
Given the graph find the x- and y-intercepts.
55.
56.
57.
58.
59.
60.
61.
62.
63.
64.
Part D: Discussion Board Topics
65. What are the x-intercepts of the line y = 0?
66. What are the y-intercepts of the line x = 0?
67. Do all lines have intercepts?
68. How many intercepts can a circle have? Draw circles showing all possible numbers of intercepts.
69. Research and post the definitions of line segment, ray, and line. Why are the arrows important?
Answers
1: y-intercept: (0, −3); x-intercept: (4, 0)
3: y-intercept: (0, −3); x-intercept: none
5: y-intercept: (0, 0); x-intercept: (0, 0)
7: x-intercept: (4, 0); y-intercept: (0, −5)
9: x-intercept: (3, 0); y-intercept: (0, −3)
11: x-intercept: (1/3, 0); y-intercept: (0, −1/4)
13: x-intercept: (4, 0); y-intercept: (0, −3)
15: x-intercept: none; y-intercept: (0, 6)
17: x-intercept: (2, 0); y-intercept: none
19: x-intercept: (−b/m, 0); y-intercept: (0, b)
21:
23:
25:
27:
29:
31:
33:
35:
37:

39:
41:
43:
45:
47:
49:
51:
53:
55: x-intercepts: (−3, 0), (3, 0); y-intercept: (0, −3)
57: x-intercepts: (−4, 0), (0, 0); y-intercept: (0, 0)
59: x-intercepts: (−2, 0), (2, 0); y-intercept: (0, −1)
61: x-intercepts: (−3, 0), (0, 0), (2, 0); y-intercept: (0, 0)
63: x-intercepts: (−4, 0), (4, 0); y-intercepts: (0, −4), (0, 4)
3.4 Graph Using the y-Intercept and Slope
Learning Objectives
- Identify and find the slope of a line.
- Graph a line using the slope and y-intercept.
Slope
The steepness of any incline can be measured as the ratio of the vertical change to the horizontal change. For example, a 5% incline can be written as 5/100, which means that for every 100 feet forward, the height increases 5 feet.

In mathematics, we call the incline of a line the slopeThe incline of a line measured as the ratio of the vertical change to the horizontal change, often referred to as rise over run. and use the letter m to denote it. The vertical change is called the riseThe vertical change between any two points on a line. and the horizontal change is called the runThe horizontal change between any two points on a line..

The rise and the run can be positive or negative. A positive rise corresponds to a vertical change up and a negative rise corresponds to a vertical change down. A positive run denotes a horizontal change to the right and a negative run corresponds to a horizontal change to the left. Given the graph, we can calculate the slope by determining the vertical and horizontal changes between any two points.
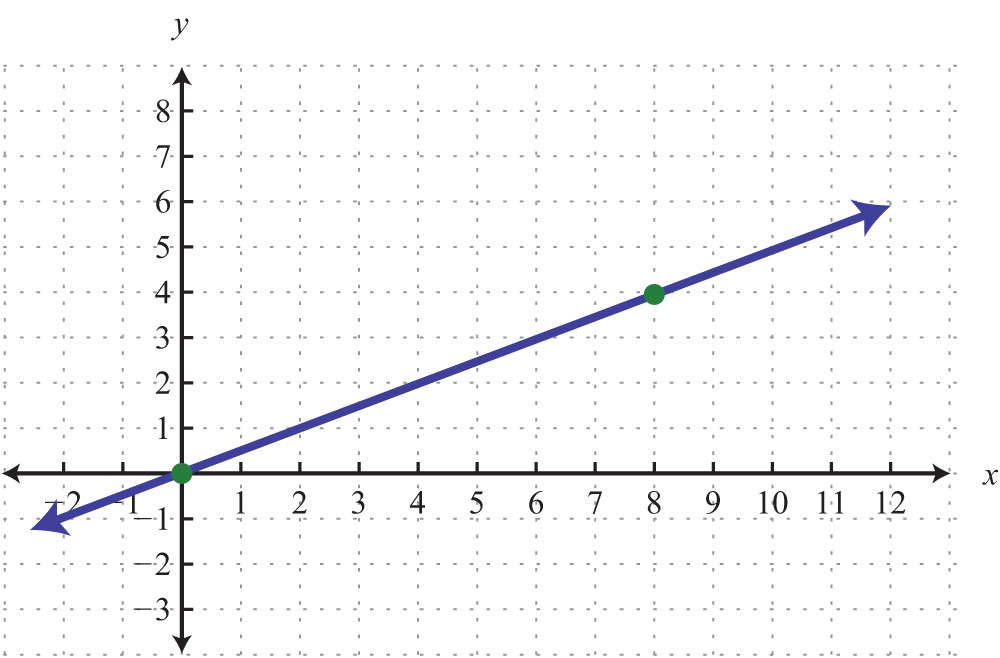
Example 1: Find the slope of the given line:
Solution: From the given points on the graph, count 3 units down and 4 units right.

Answer:
Here we have a negative slope, which means that for every 4 units of movement to the right, the vertical change is 3 units downward. There are four geometric cases for the value of the slope.
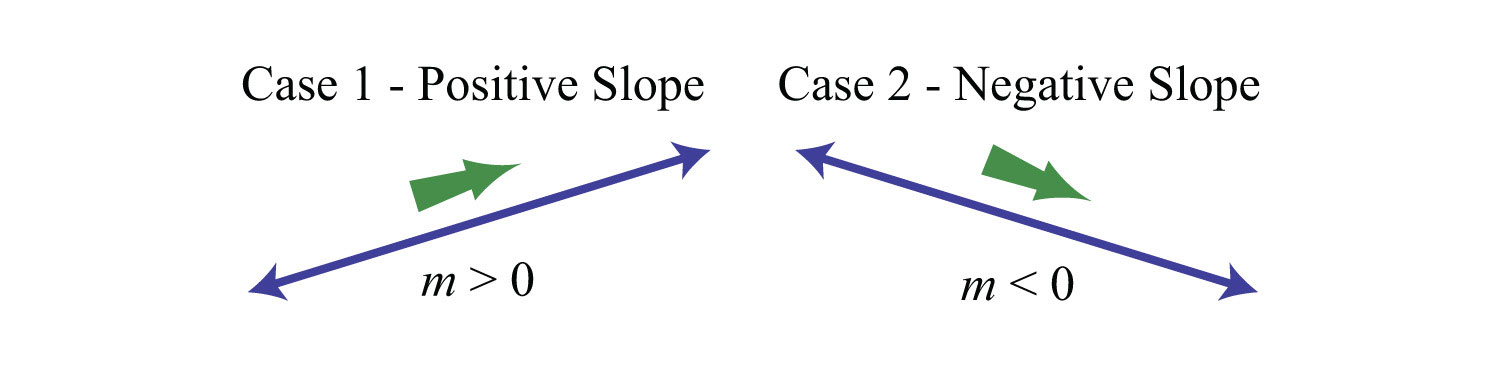
Reading the graph from left to right, we see that lines with an upward incline have positive slopes and lines with a downward incline have negative slopes.
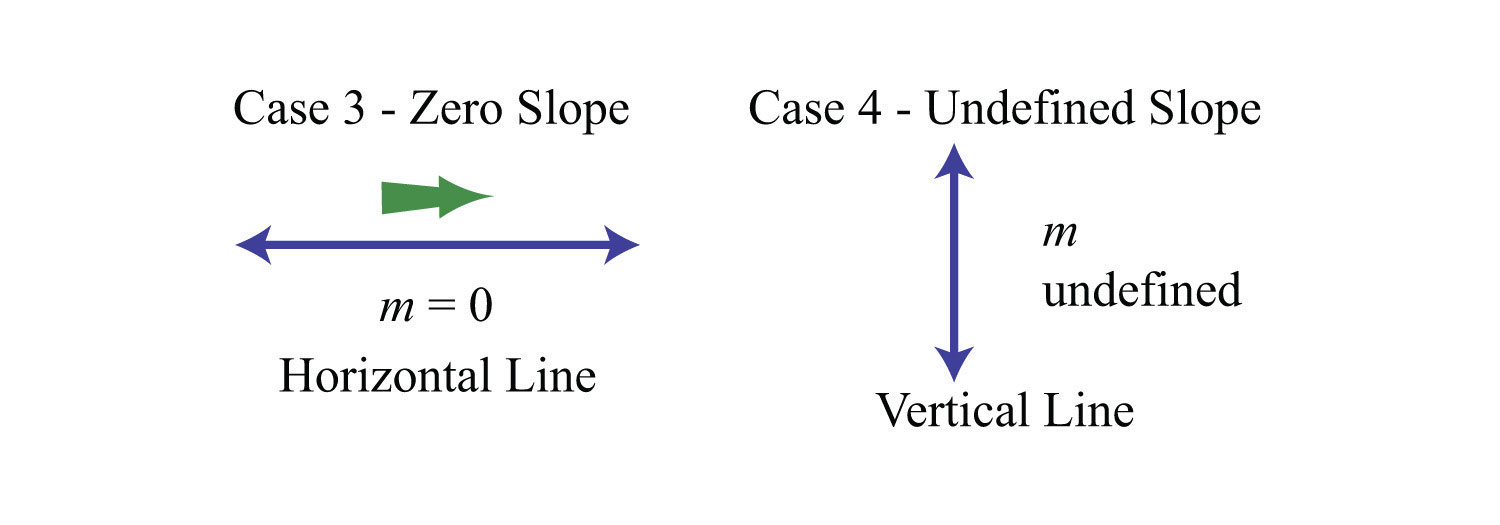
If the line is horizontal, then the rise is 0:

The slope of a horizontal line is 0. If the line is vertical, then the run is 0:

The slope of a vertical line is undefined.
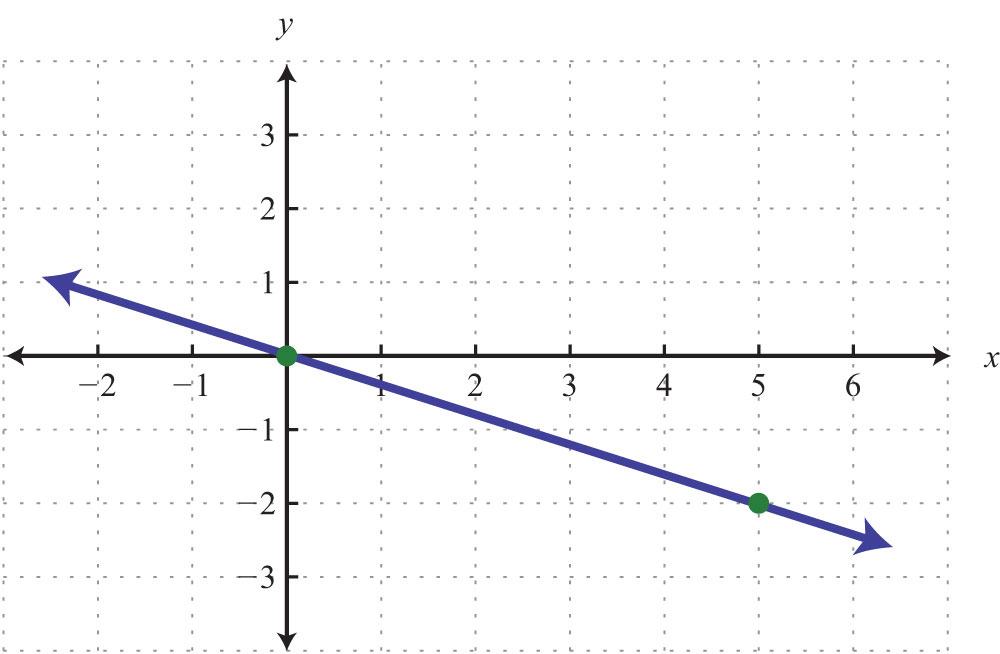
Try this! Find the slope of the given line:
Answer:
Video Solution
(click to see video)Calculating the slope can be difficult if the graph does not have points with integer coordinates. Therefore, we next develop a formula that allows us to calculate the slope algebraically. Given any two points and , we can obtain the rise and run by subtracting the corresponding coordinates.

This leads us to the slope formulaGiven two points and , then the slope of the line is given by the formula .. Given any two points and , the slope is given by

Example 2: Find the slope of the line passing through (−3, −5) and (2, 1).
Solution: Given (−3, −5) and (2, 1), calculate the difference of the y-values divided by the difference of the x-values. Since subtraction is not commutative, take care to be consistent when subtracting the coordinates.
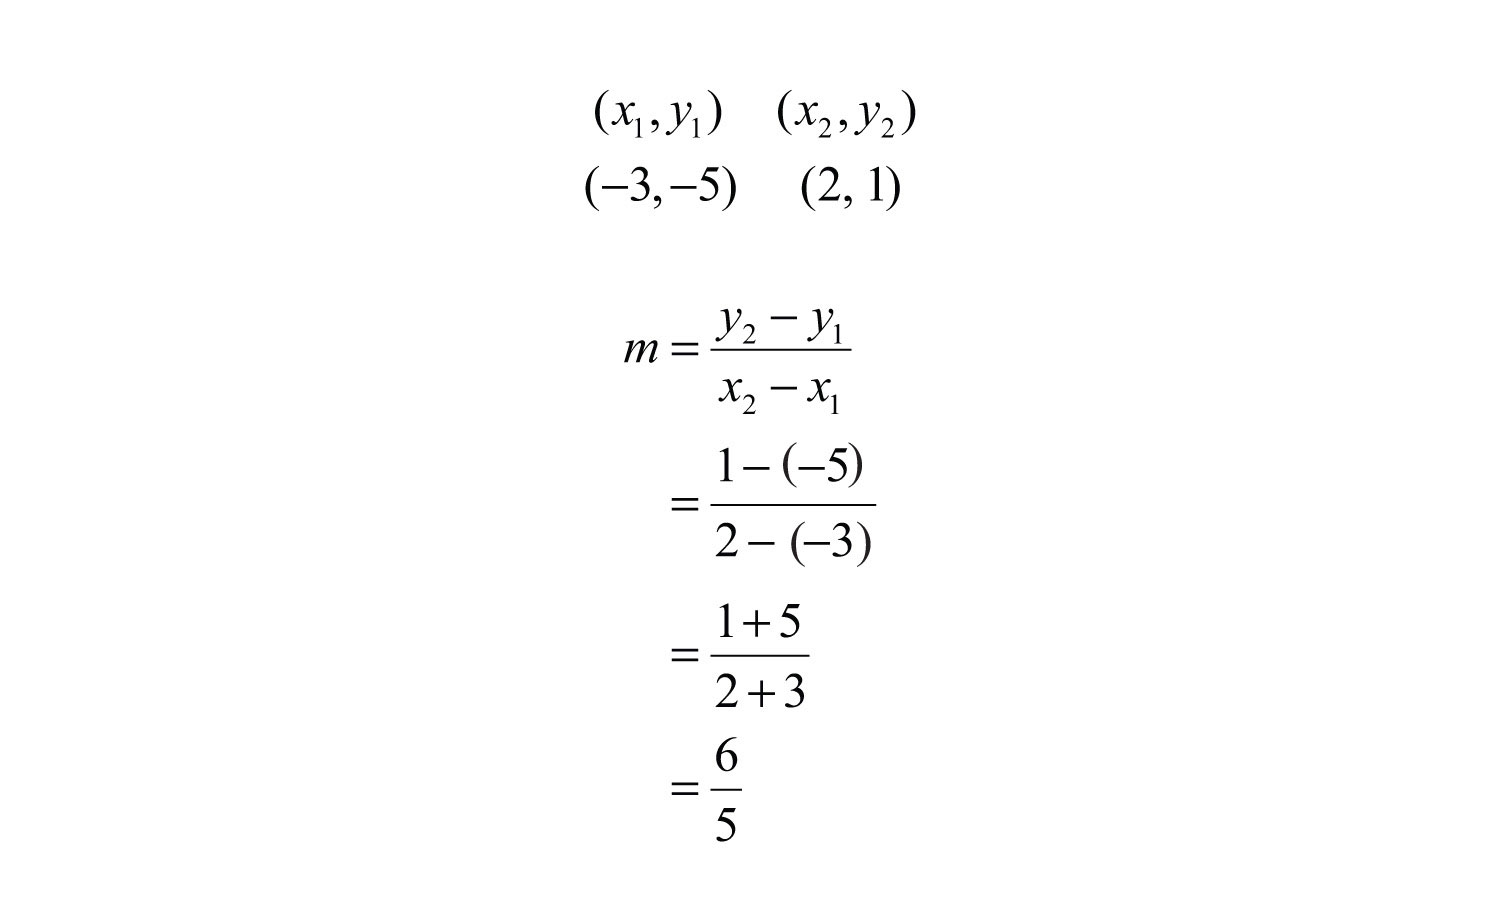
Answer:
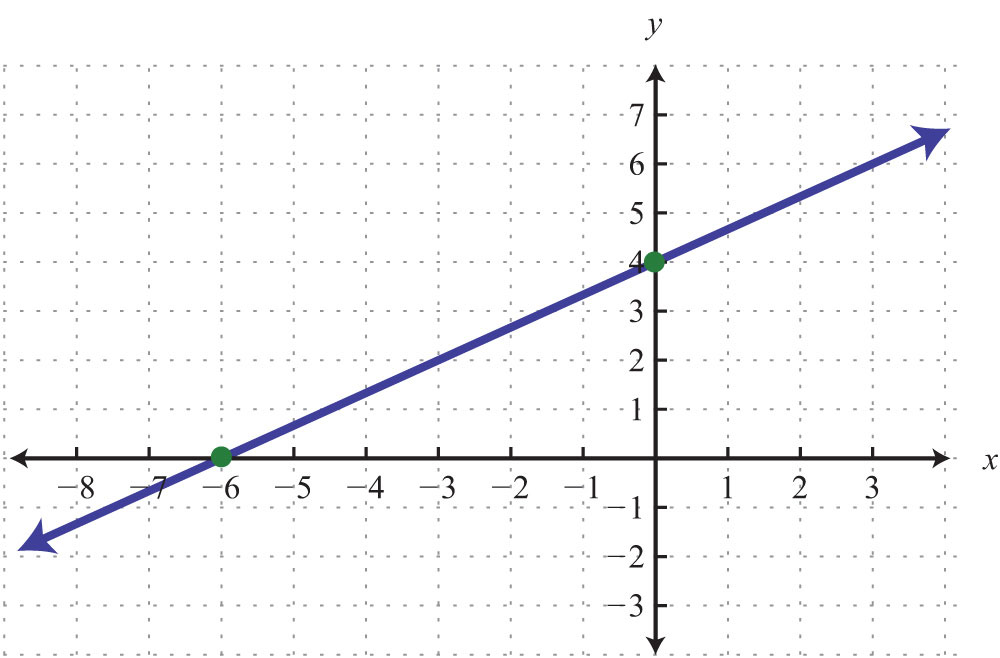
We can graph the line described in the previous example and verify that the slope is 6/5.
Certainly the graph is optional; the beauty of the slope formula is that we can obtain the slope, given two points, using only algebra.
Example 3: Find the slope of the line passing through (−4, 3) and (−1, −7).
Solution:
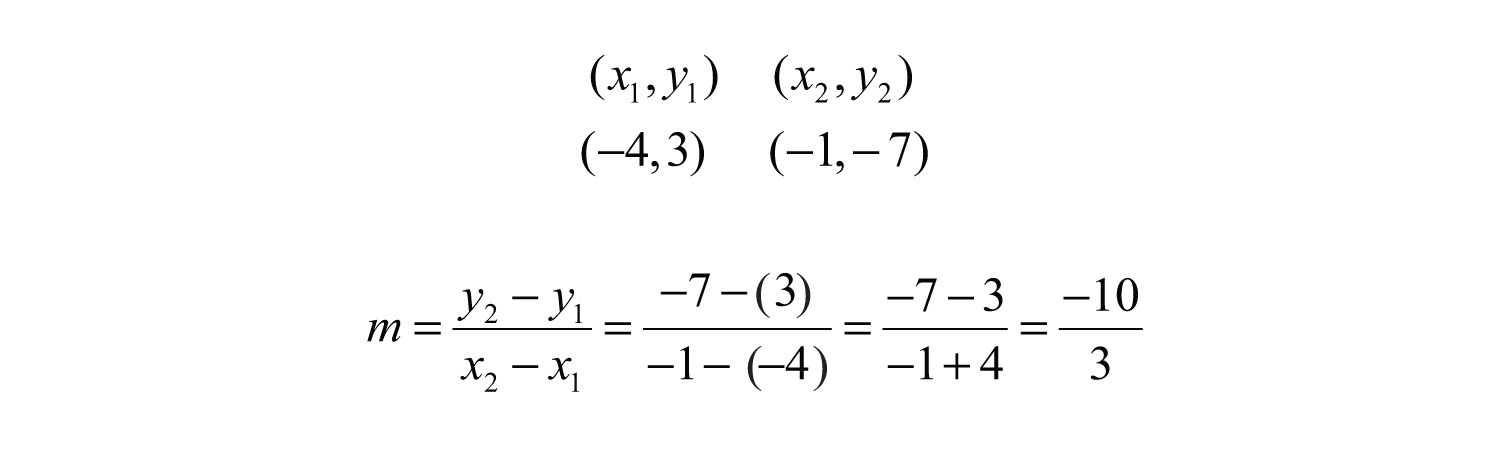
Answer:
When using the slope formula, take care to be consistent since order does matter. You must subtract the coordinates of the first point from the coordinates of the second point for both the numerator and the denominator in the same order.
Example 4: Find the slope of the line passing through (7, −2) and (−5, −2).
Solution:
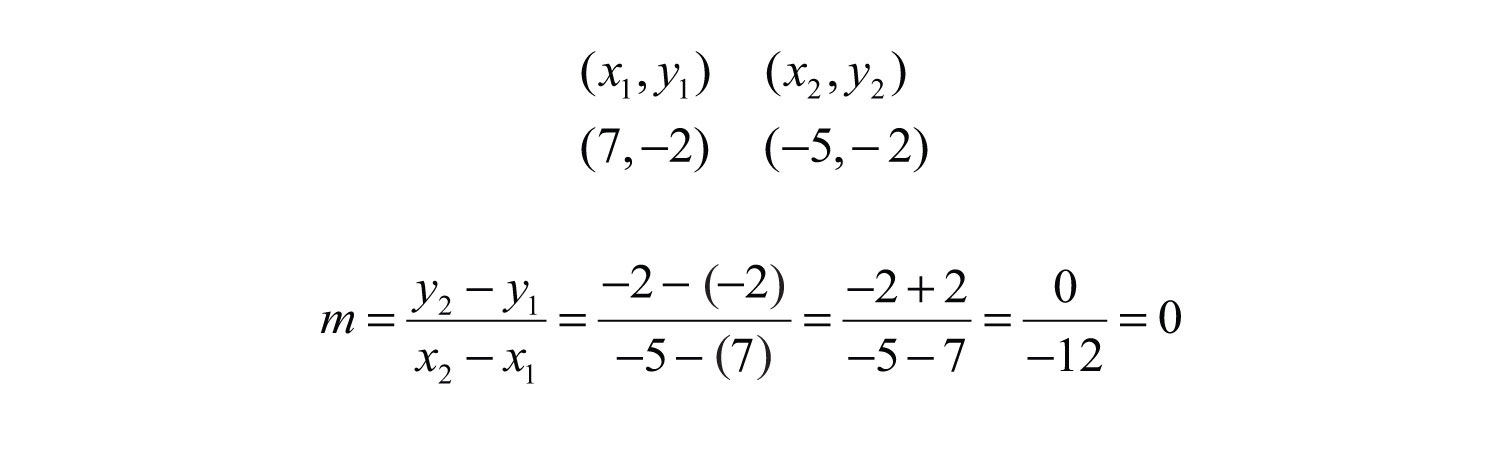
Answer: . As an exercise, plot the given two points and verify that they lie on a horizontal line.
Example 5: Find the slope of the line passing through (−4, −3) and (−4, 5).
Solution:
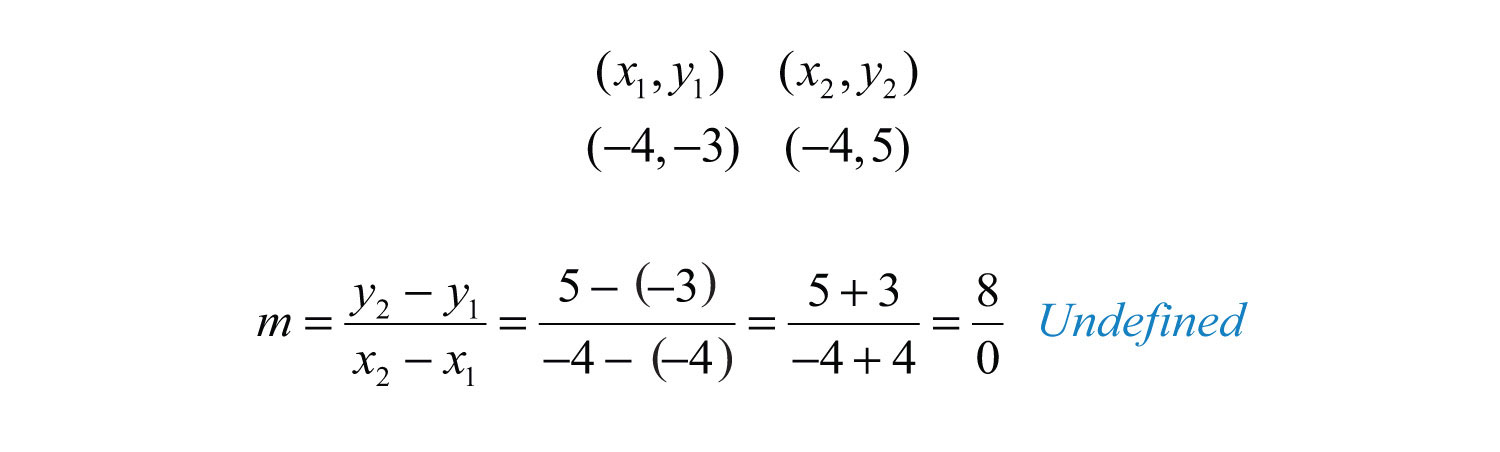
Answer: The slope m is undefined. As an exercise, plot the given two points and verify that they lie on a vertical line.
Try this! Calculate the slope of the line passing through (−2, 3) and (5, −5).
Answer:
Video Solution
(click to see video)When considering the slope as a rate of change it is important to include the correct units.
Example 6: A Corvette Coupe was purchased new in 1970 for about $5,200 and depreciated in value over time until it was sold in 1985 for $1,300. At this point, the car was beginning to be considered a classic and started to increase in value. In the year 2000, when the car was 30 years old, it sold at auction for $10,450. The following line graph depicts the value of the car over time.
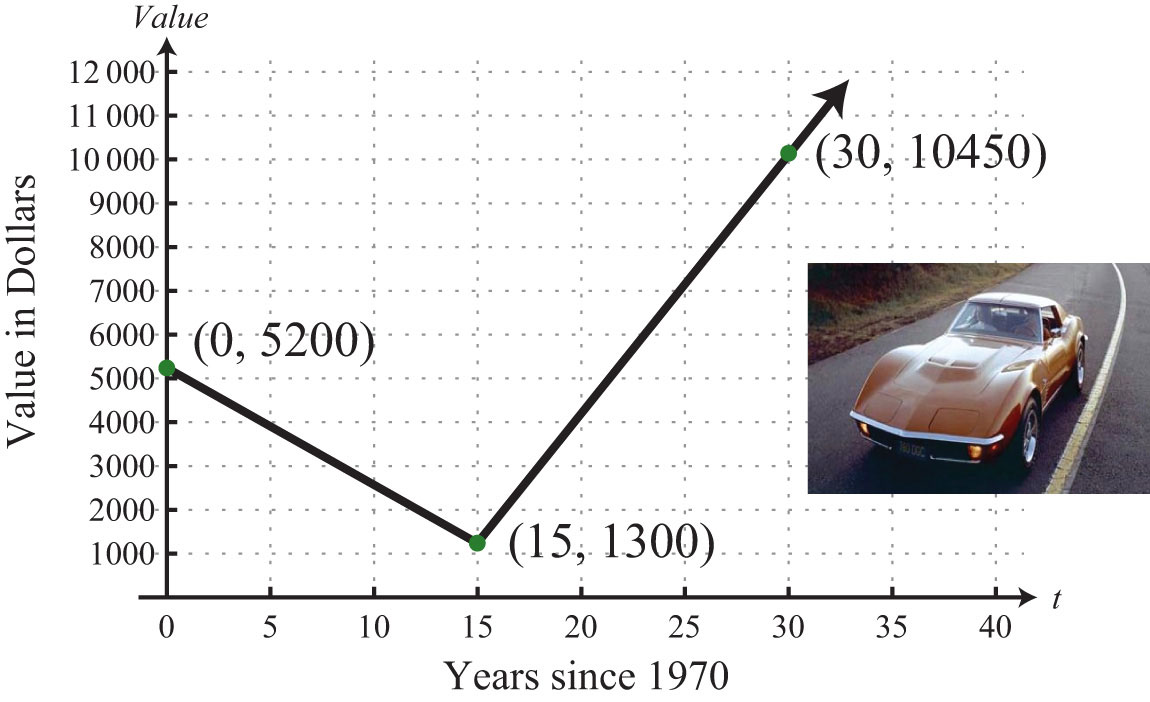
a. Determine the rate at which the car depreciated in value from 1970 to 1985.
b. Determine the rate at which the car appreciated in value from 1985 to 2000.
Solution: Notice that the value depends on the age of the car and that the slope measures the rate in dollars per year.
a. The slope of the line segment depicting the value for the first 15 years is
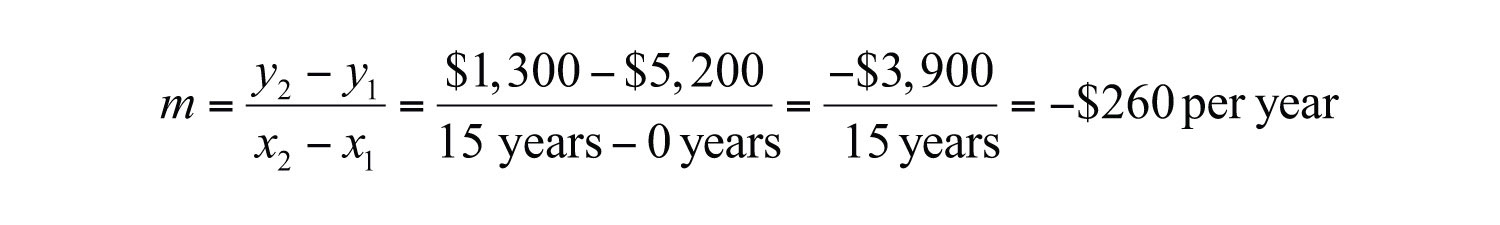
Answer: The value of the car depreciated $260 per year from 1970 to 1985.
b. The slope of the line segment depicting the value for the next 15 years is
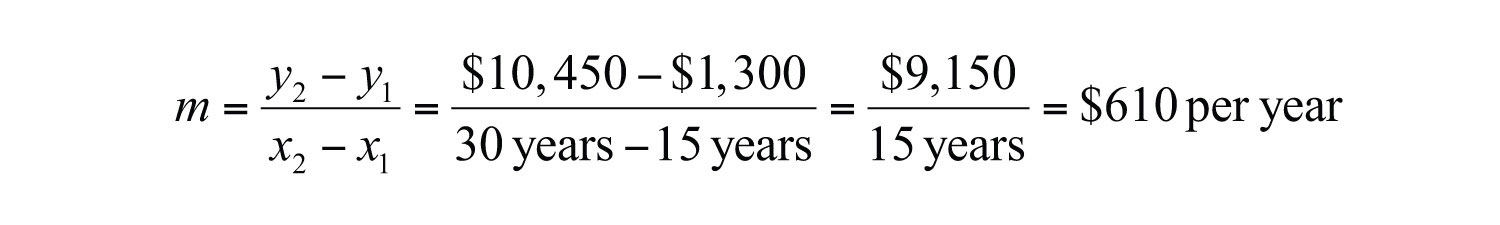
Answer: The value of the car appreciated $610 per year from 1985 to 2000.
Slope-Intercept Form of a Line
To this point, we have learned how to graph lines by plotting points and by using the x- and y-intercepts. In addition, we have seen that we need only two points to graph a line. In this section, we outline a process to easily determine two points using the y-intercept and the slope. The equation of any nonvertical line can be written in slope-intercept formAny nonvertical line can be written in the form , where m is the slope and (0, b) is the y-intercept. . In this form, we can identify the slope, m, and the y-intercept, (0, b).
Example 7: Determine the slope and y-intercept: .
Solution: In this form, the coefficient of x is the slope, and the constant is the y-value of the y-intercept. Therefore, by inspection, we have

Answer: The y-intercept is (0, 7), and the slope is .
It is not always the case that the linear equation is given in slope-intercept form. When it is given in standard form, you have to first solve for y to obtain slope-intercept form.
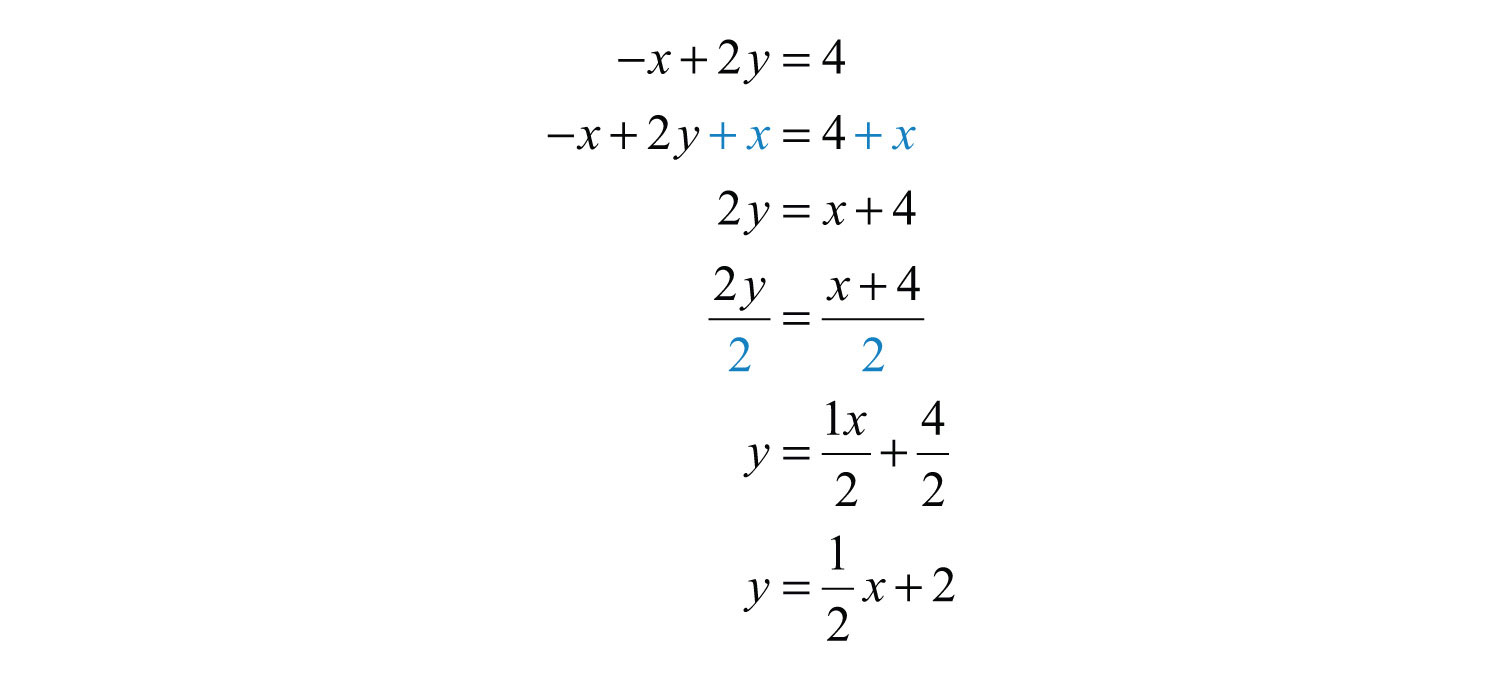
Example 8: Express in slope-intercept form and then identify the slope and y-intercept.
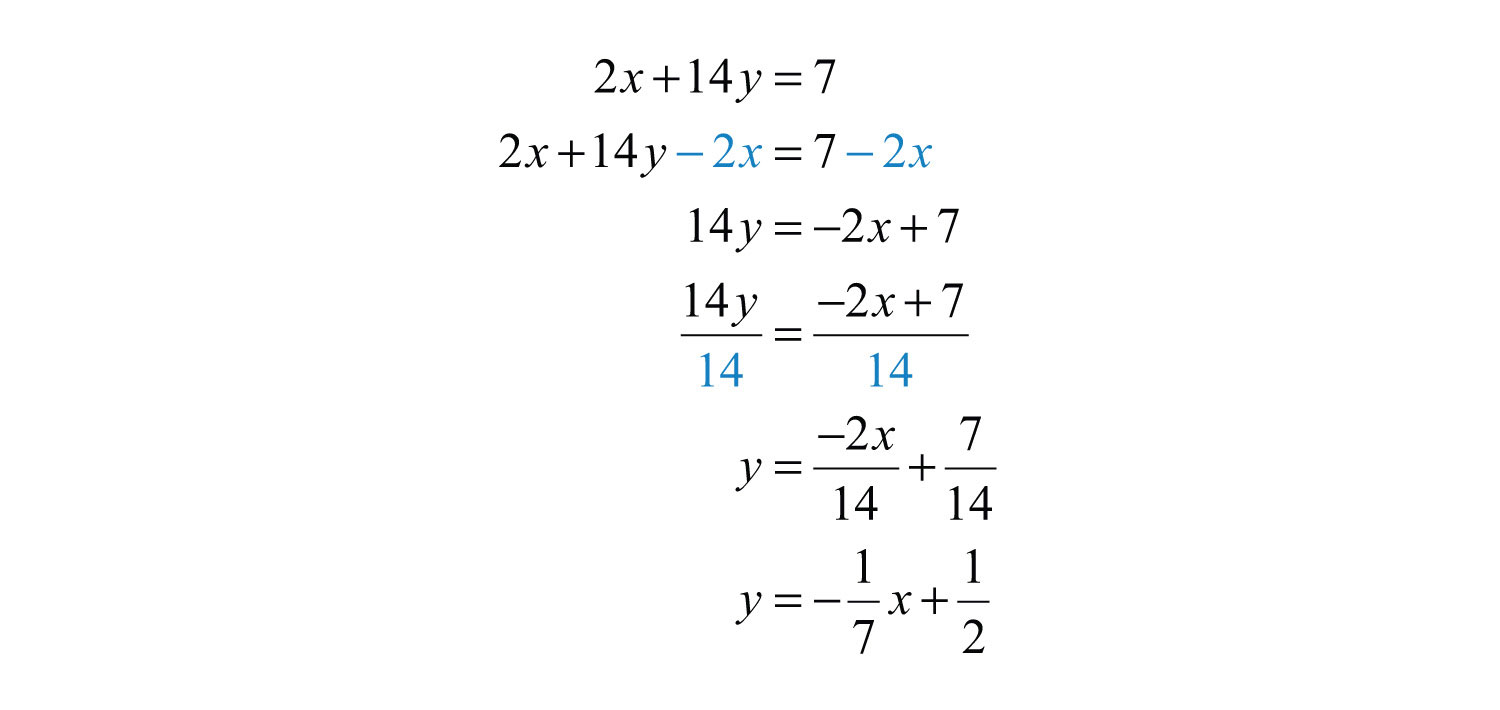
Solution: Begin by solving for y. To do this, apply the properties of equality to first isolate 5y and then divide both sides by 5.
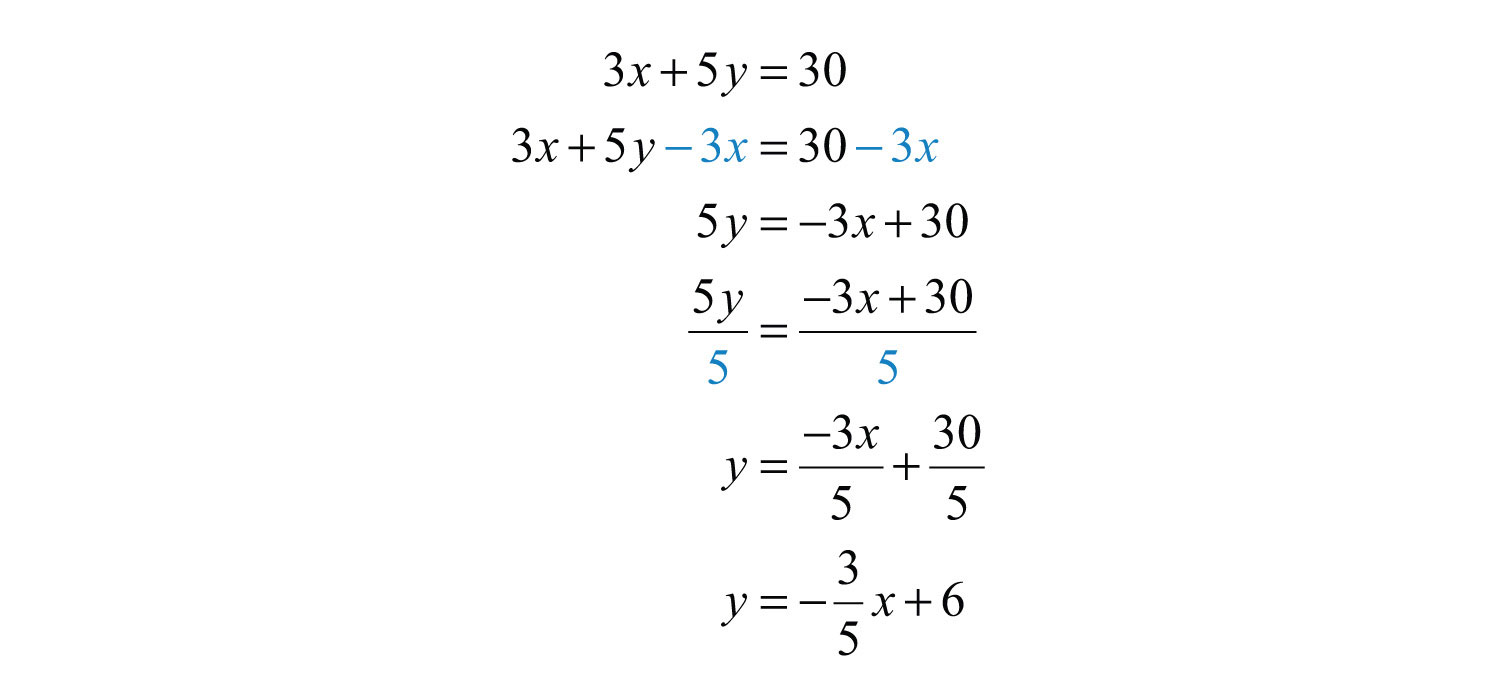
Answer: Slope-intercept form: ; y-intercept: (0, 6); slope:
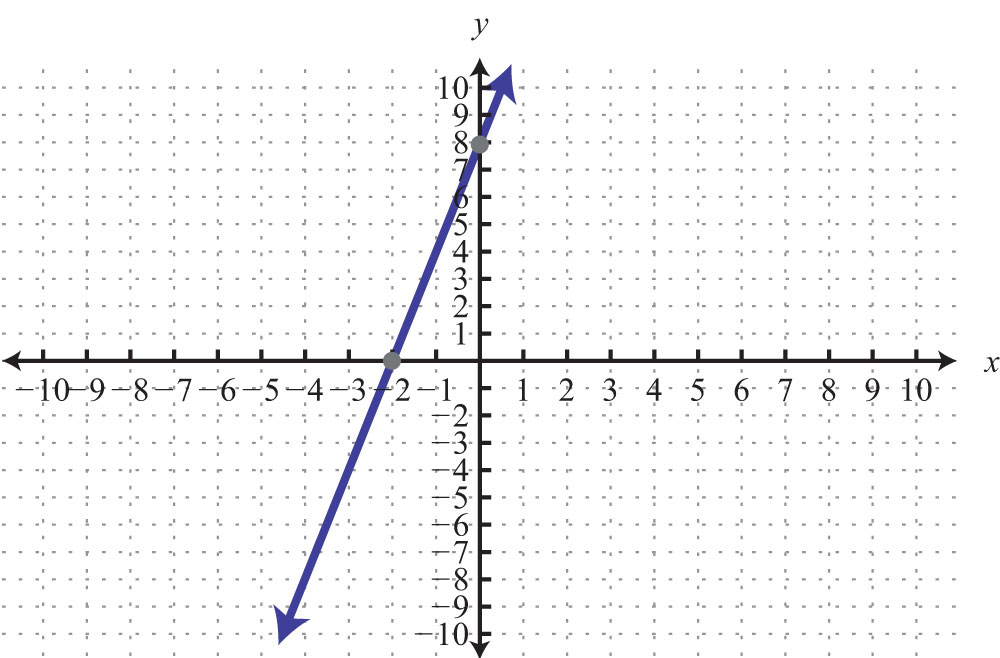
Once the equation is in slope-intercept form, we immediately have one point to plot, the y-intercept. From the intercept, you can mark off the slope to plot another point on the line. From the previous example we have

Starting from the point (0, 6), use the slope to mark another point 3 units down and 5 units to the right.
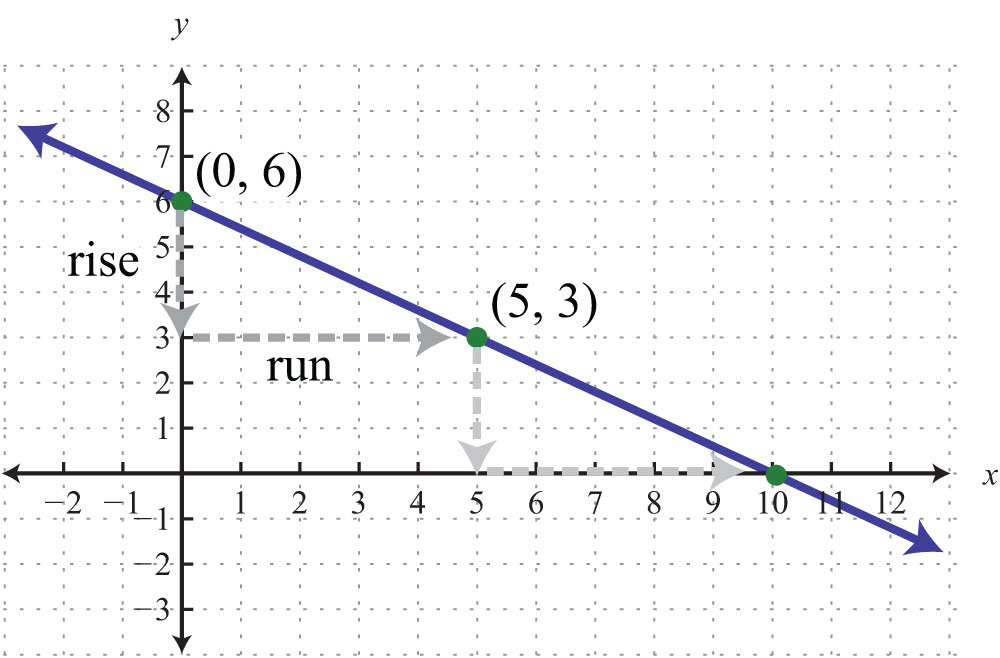
It is not necessary to check that the second point, (5, 3), solves the original linear equation. However, we do it here for the sake of completeness.

Marking off the slope in this fashion produces as many ordered pair solutions as we desire. Notice that if we mark off the slope again, from the point (5, 3), then we obtain the x-intercept, (10, 0).
Example 9: Graph: .
Solution: In this example, we outline the general steps for graphing a line using slope-intercept form.
Step 1: Solve for y to obtain slope-intercept form.
Step 2: Identify the y-intercept and slope.

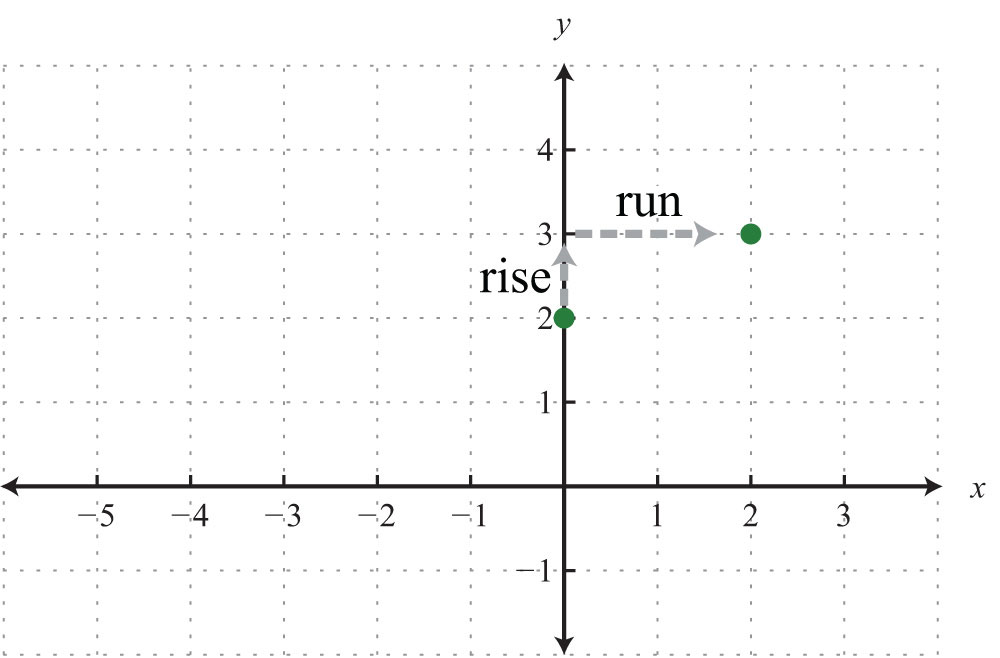
Step 3: Plot the y-intercept and use the slope to find another ordered pair solution. Starting from the y-intercept, mark off the slope and identify a second point. In this case, mark a point after a rise of 1 unit and a run of 2 units.
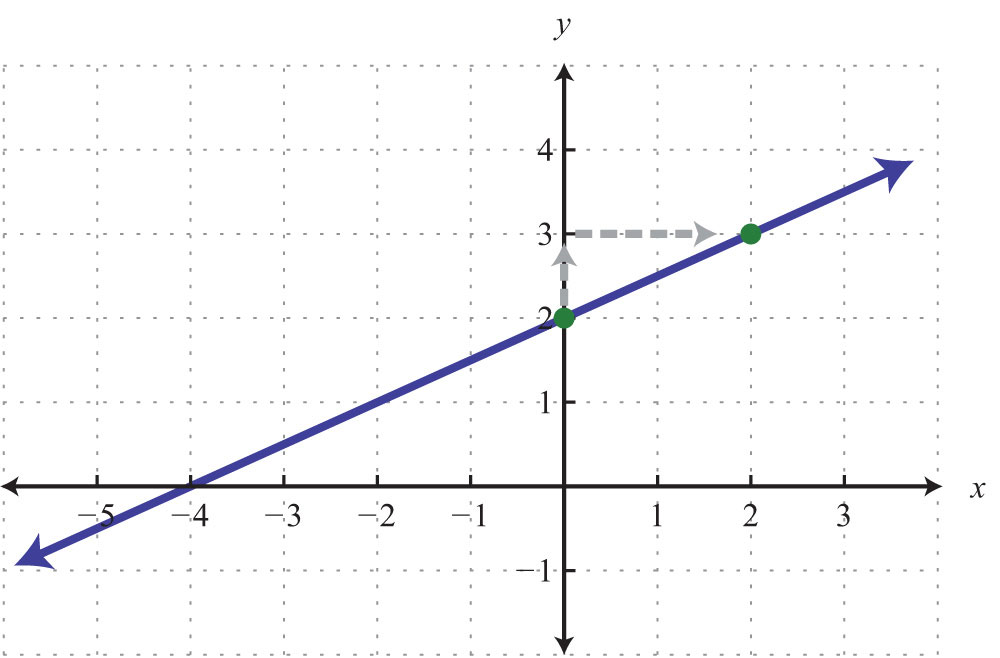
Step 4: Draw the line through the two points with a straightedge.
Answer:
In this example, we notice that we could get the x-intercept by marking off the slope in a different but equivalent manner. Consider the slope as the ratio of two negative numbers as follows:

We could obtain another point on the line by marking off the equivalent slope down 1 unit and left 2 units. We do this twice to obtain the x-intercept, (−4, 0).
Marking off the slope multiple times is not necessarily always going to give us the x-intercept, but when it does, we obtain a valuable point with little effort. In fact, it is a good practice to mark off the slope multiple times; doing so allows you to obtain more points on the line and produce a more accurate graph.
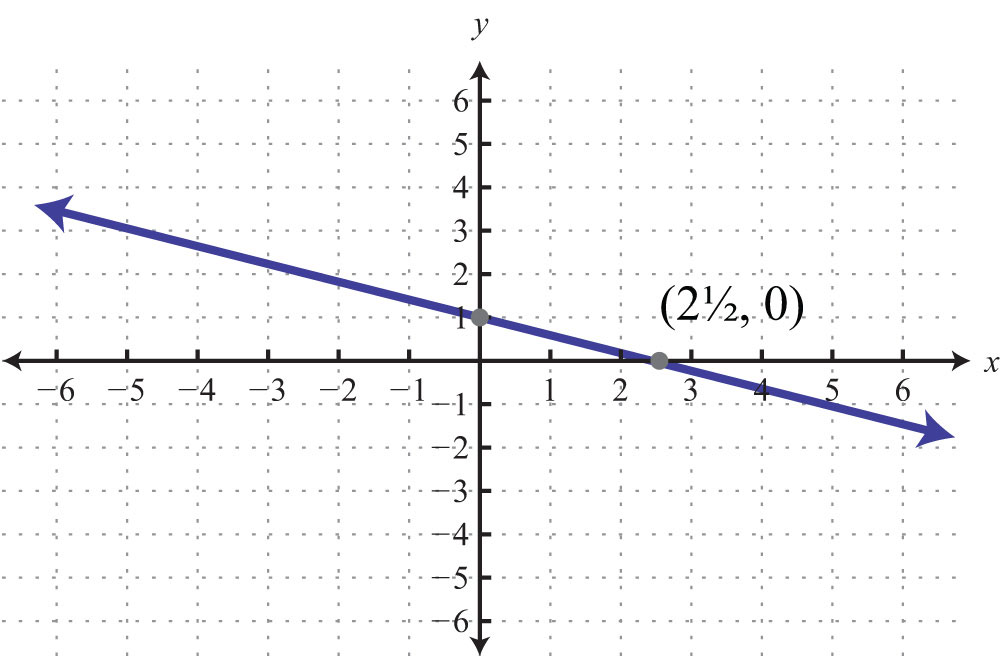
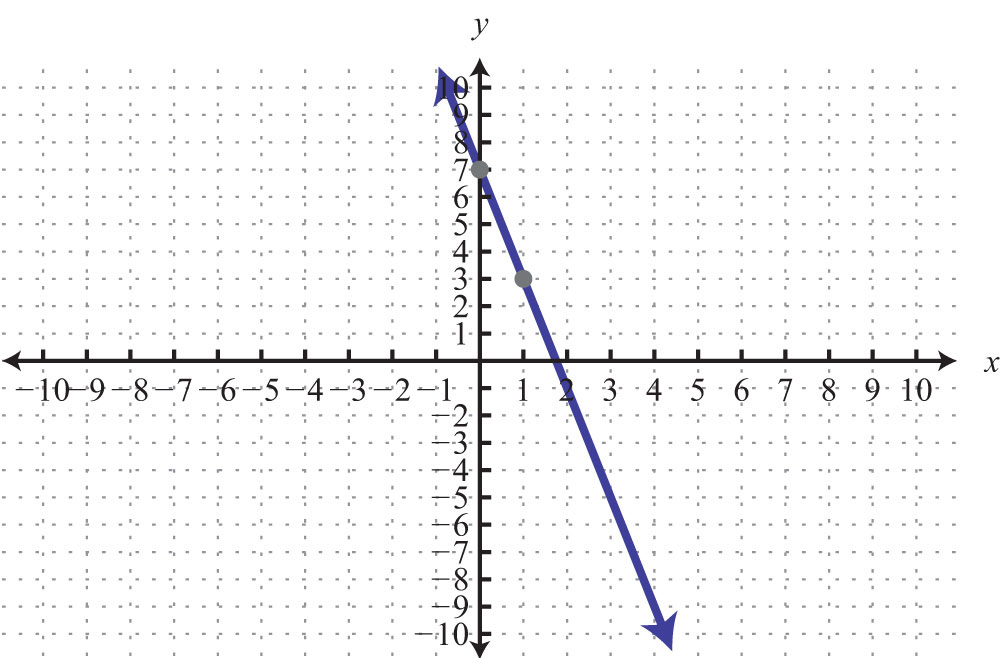
Example 10: Graph and find the x-intercept: .
Solution: The equation is given in slope-intercept form. Therefore, by inspection, we have the y-intercept and slope.

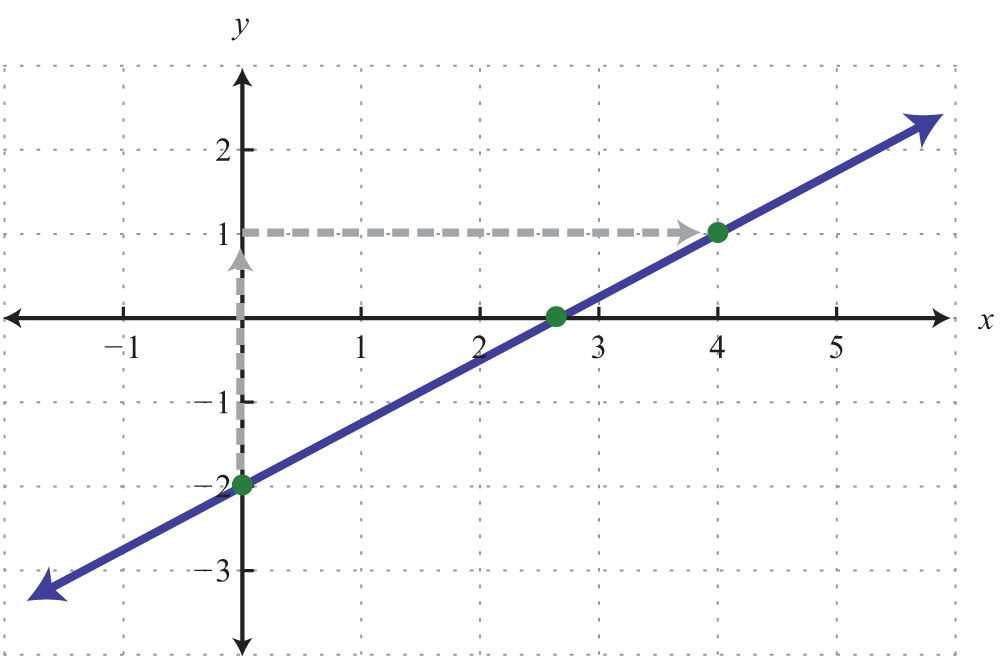
We can see that the x-value of the x-intercept is a mixed number between 2 and 3. To algebraically find x-intercepts, recall that we must set y = 0 and solve for x.
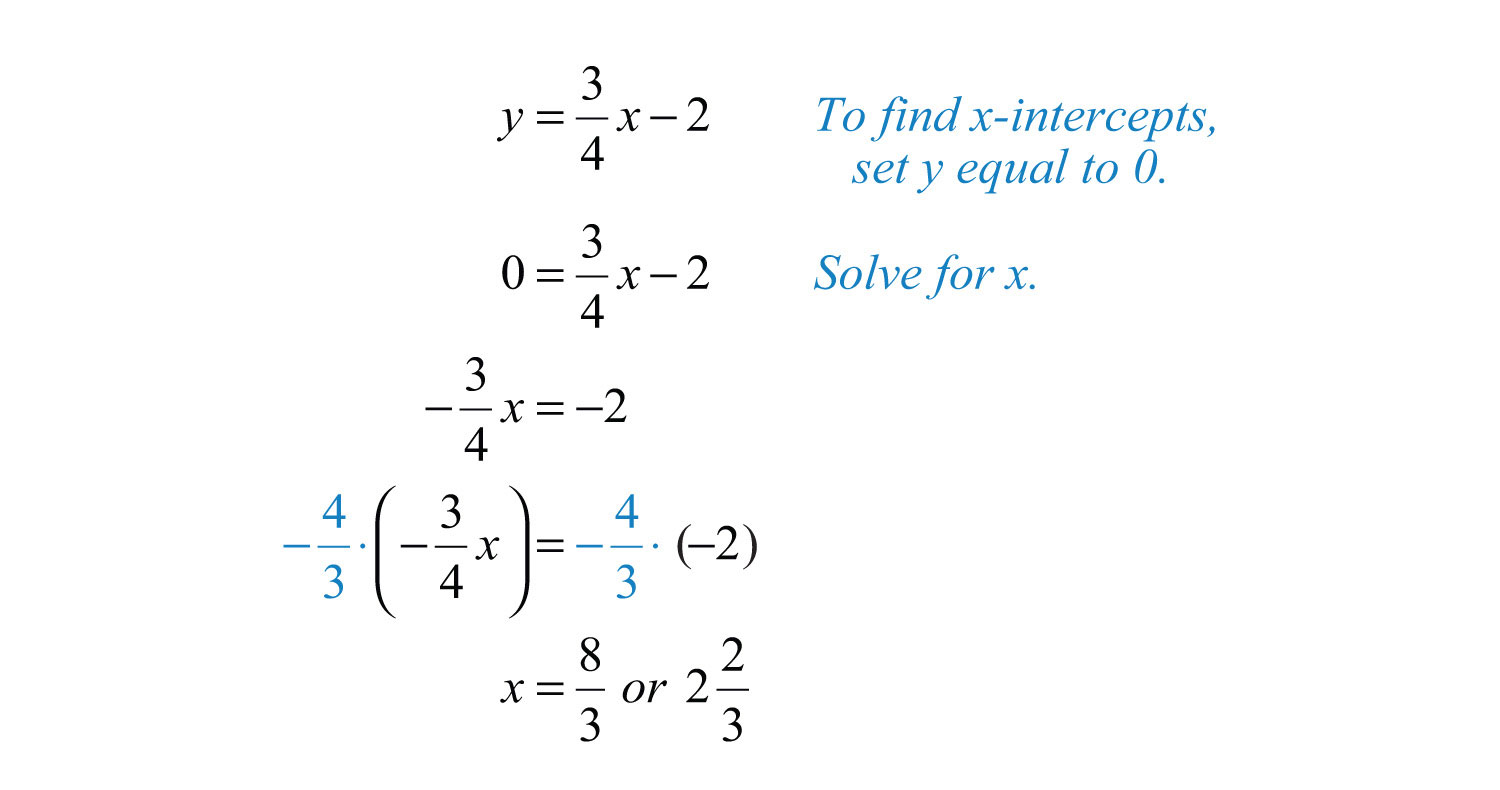
Answer: The x-intercept is .
Example 11: Graph: .
Solution: Begin by solving for y.

The equation can be written , and we have

Answer:
Try this! Graph and label the x-intercept.
Answer:
Video Solution
(click to see video)Key Takeaways
- Slope measures the steepness of a line as rise over run. A positive rise denotes a vertical change up, and a negative rise denotes a vertical change down. A positive run denotes a horizontal change right, and a negative run denotes a horizontal change left.
- Horizontal lines have a slope of zero, and vertical lines have undefined slopes.
- Given any two points on a line, we can algebraically calculate the slope using the slope formula, .
- Any nonvertical line can be written in slope-intercept form, , from which we can determine, by inspection, the slope m and y-intercept (0, b).
- If we know the y-intercept and slope of a line, then we can easily graph it. First, plot the y-intercept, and from this point use the slope as rise over run to mark another point on the line. Finally, draw a line through these two points with a straightedge and add an arrow on either end to indicate that it extends indefinitely.
- We can obtain as many points on the line as we wish by marking off the slope multiple times.
Topic Exercises
Part A: Slope
Determine the slope and the y-intercept of the given graph.
1.
2.
3.
4.
5.
6.

Determine the slope, given two points.
7. (3, 2) and (5, 1)
8. (7, 8) and (−3, 5)
9. (2, −3) and (−3, 2)
10. (−3, 5) and (7, −5)
11. (−1, −6) and (3, 2)
12. (5, 3) and (4, 12)
13. (−9, 3) and (−6, −5)
14. (−22, 4) and (−8, −12)
15. and
16. and
17. and
18. and
19. (3, −5) and (5, −5)
20. (−3, 1) and (−14, 1)
21. (−2, 3) and (−2, −4)
22. (−4, −4) and (5, 5)
23. A roof drops 4 feet for every 12 feet forward. Determine the slope of the roof.
24. A road drops 300 feet for every 5,280 feet forward. Determine the slope of the road.
25. The following graph gives the US population of persons 65 years old and over. At what rate did this population increase from 2000 to 2008?
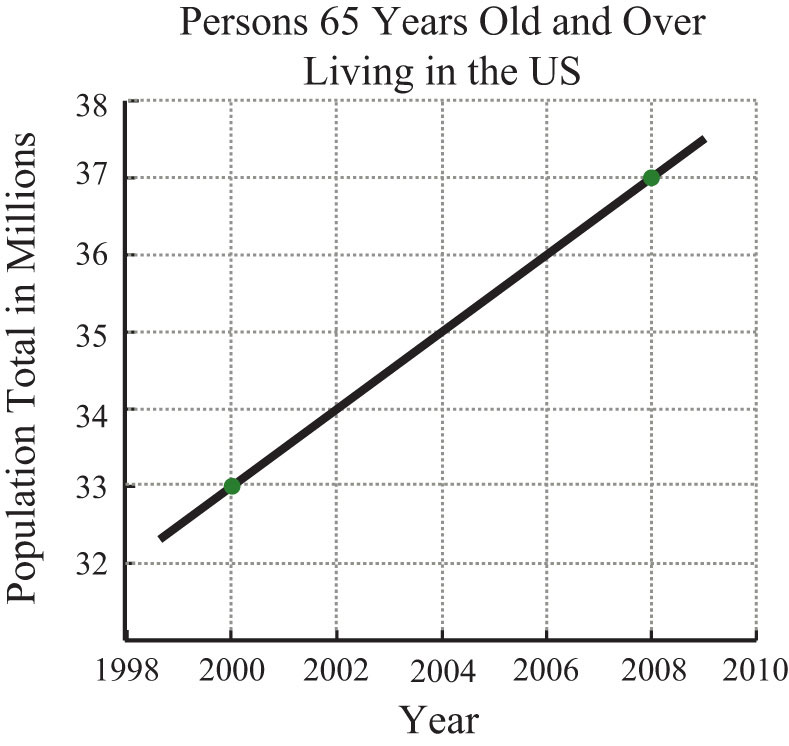
Source: US Census Bureau.
26. The following graph gives total consumer credit outstanding in the United States. At what rate did consumer credit increase from 2002 to 2008?
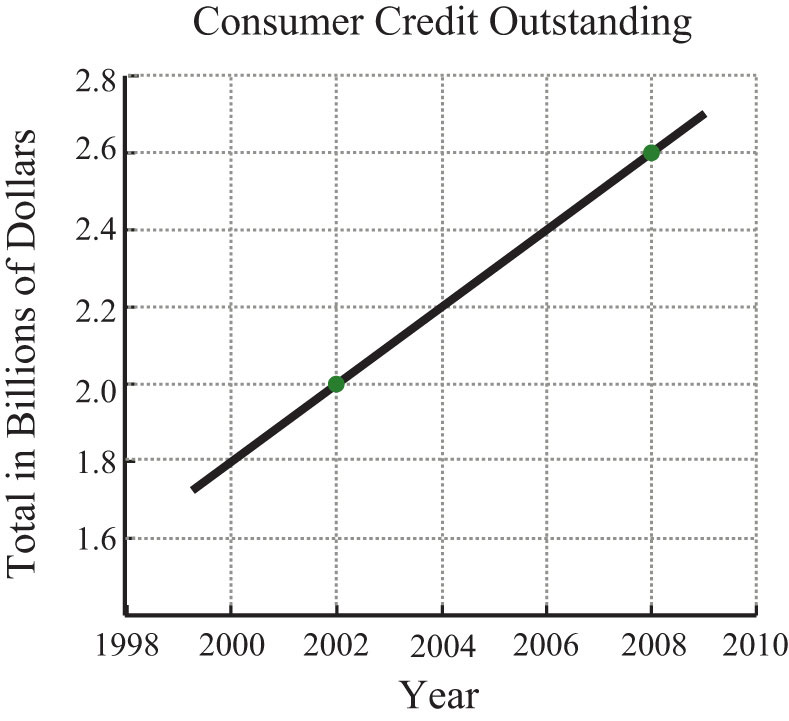
Source: US Census Bureau.
27. A commercial van was purchased new for $20,000 and is expected to be worth $4,000 in 8 years. Determine the rate at which the van depreciates in value.
28. A commercial-grade copy machine was purchased new for $4,800 and will be considered worthless in 6 years. Determine the rate at which the copy machine depreciates in value.
29. Find y if the slope of the line passing through (−2, 3) and (4, y) is 12.
30. Find y if the slope of the line passing through (5, y) and (6, −1) is 10.
31. Find y if the slope of the line passing through (5, y) and (−4, 2) is 0.
32. Find x if the slope of the line passing through (−3, 2) and (x, 5) is undefined.
Part B: Slope-Intercept Form
Express the given linear equation in slope-intercept form and identify the slope and y-intercept.
33.
34.
35.
36.
37.
38.
39.
40.
Graph the line given the slope and the y-intercept.
41. and (0, −2)
42. and (0, 4)
43. and (0, 1)
44. and (0, −1)
45. and (0, 5)
46. m undefined and (0, 0)
47. and (0, 0)
48. and (0, 0)
49. and (0, 20)
50. and (0, −5)
Graph using the slope and y-intercept.
51.
52.
53.
54.
55.
56.
57.
58.
59.
60.
61.
62.
63.
64.
65.
66.
67.
68.
69.
70.
71.
72.
73. On the same set of axes, graph the three lines, where and b = {−2, 0, 2}.
74. On the same set of axes, graph the three lines, where and m = {−1/2, 0, 1/2}.
Part C: Discussion Board Topics
75. Name three methods for graphing lines. Discuss the pros and cons of each method.
76. Choose a linear equation and graph it three different ways. Scan the work and share it on the discussion board.
77. Why do we use the letter m for slope?
78. How are equivalent fractions useful when working with slopes?
79. Can we graph a line knowing only its slope?
80. Research and discuss the alternative notation for slope: .
81. What strategies for graphing lines should be brought to an exam? Explain.
Answers
1: y-intercept: (0, 3); slope: m = −3/4
3: y-intercept: (0, 2); slope: m = 0
5: y-intercept: (0, 0); slope: m = 2
7: −1/2
9: −1
11: 2
13: −8/3
15: −1
17: −33/20
19: 0
21: Undefined
23: −1/3
25: ½ million per year
27: $2,000 per year
29: 75
31: 2
33: ; slope: 6/5; y-intercept: (0, −6)
35: ; slope: 9; y-intercept: (0, −17)
37: ; slope: 2/3; y-intercept: (0, 0)
39: ; slope: 8/15; y-intercept: (0, −8)
41:
43:
45:
47:
49:
51:
53:
55:
57:
59:
61:
63:
65:
67:
69:
71:
73:
3.5 Finding Linear Equations
Learning Objectives
- Given a graph, identify the slope and y-intercept.
- Find the equation of the line using the slope and y-intercept.
- Find the equation of the line using point-slope form.
Finding Equations Using Slope-Intercept Form
Given the algebraic equation of a line, we are able to graph it in a number of ways. In this section, we will be given a geometric description of a line and be asked to find the algebraic equation. Finding the equation of a line can be accomplished in a number of ways, the first of which makes use of slope-intercept form, . If we know the slope, m, and the y-intercept, (0, b), we can construct the equation.
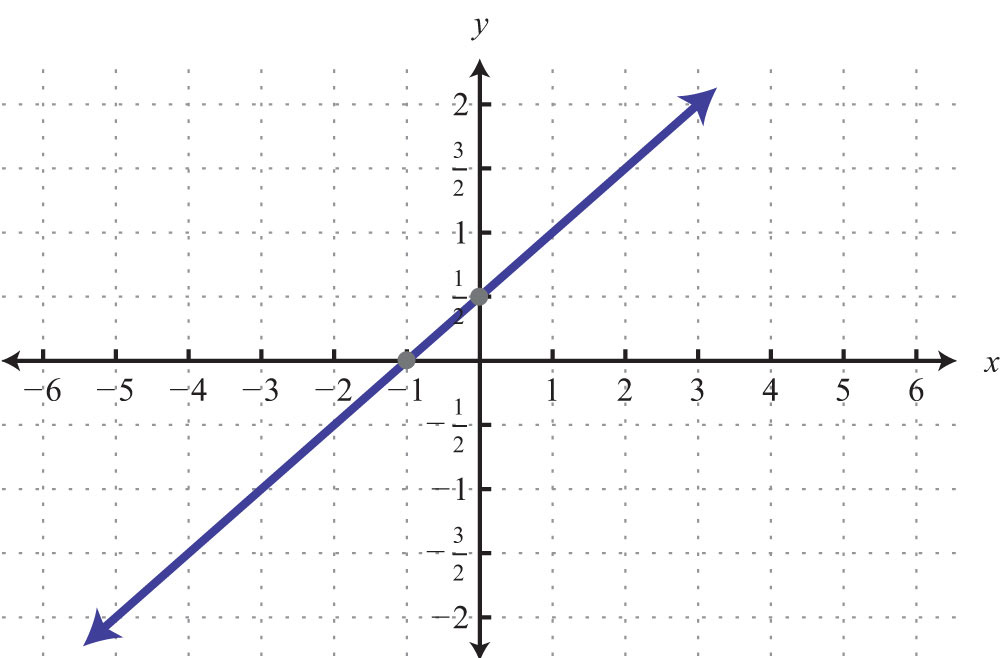
Example 1: Find the equation of a line with slope and y-intercept (0, 1).
Solution: The given y-intercept implies that . Substitute the slope m and the y-value of the y-intercept b into the equation .

Answer:
Finding a linear equation is very straightforward if the slope and y-intercept are given. This is certainly not always the case; however, the example demonstrates that the algebraic equation of a line depends on these two pieces of information. If the graph is given, then we can often read it to determine the y-intercept and slope.
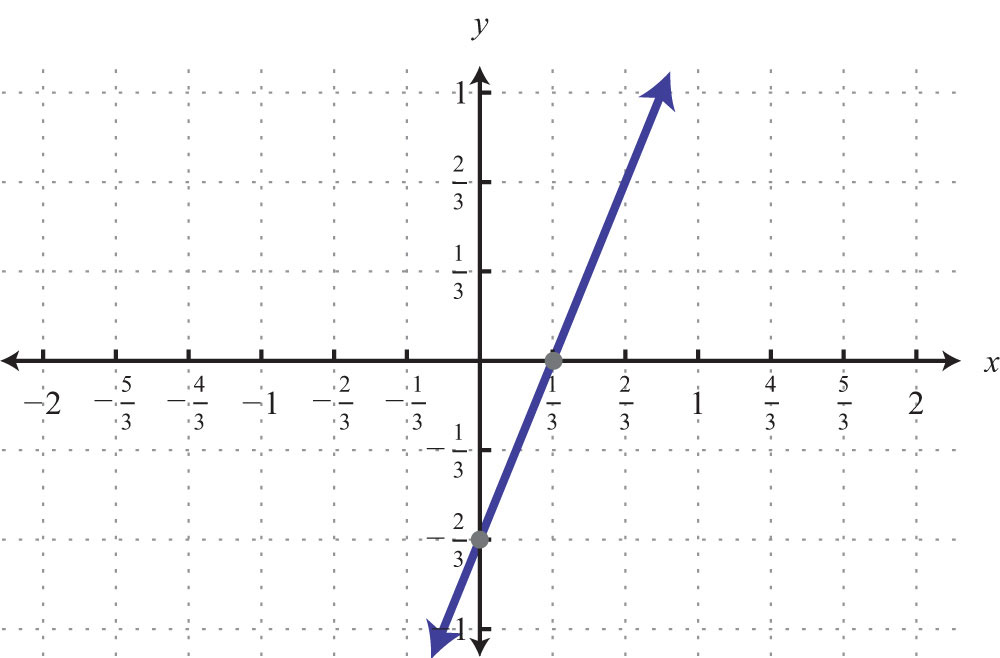
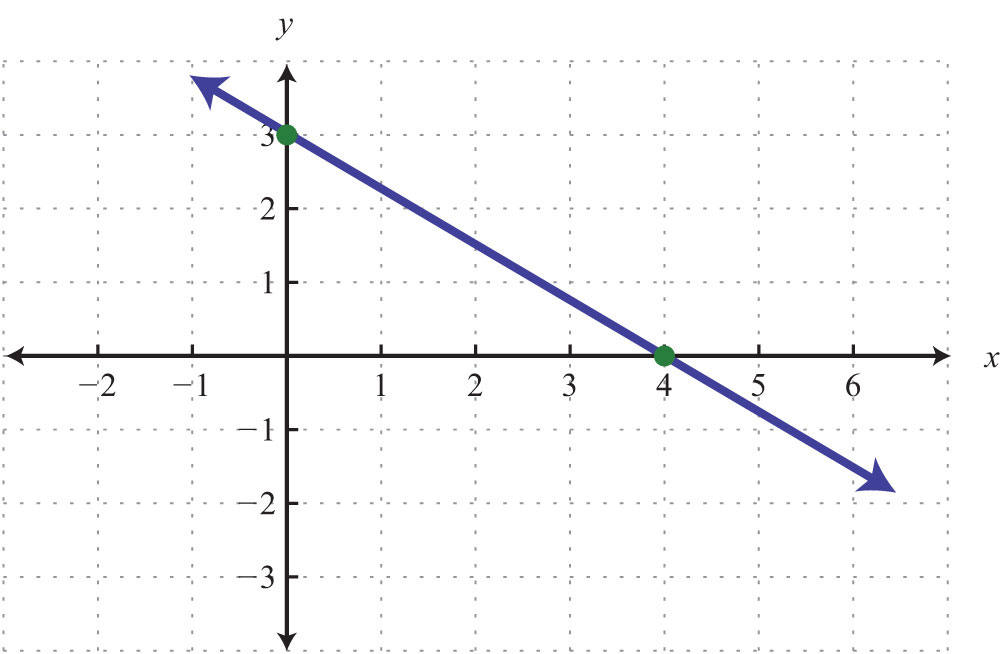
Example 2: Find the equation of the line given the graph:
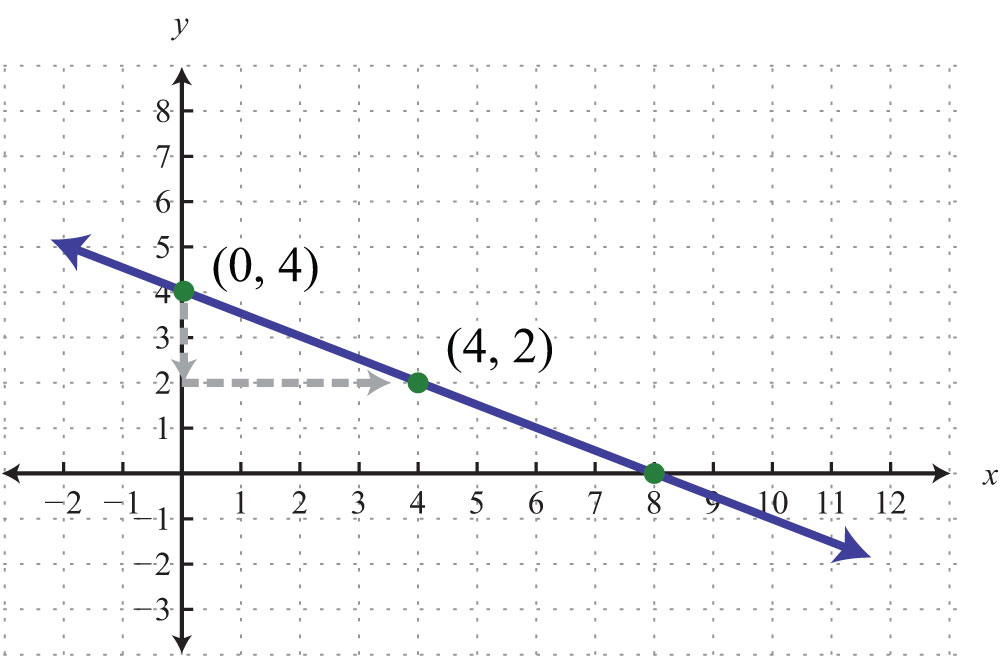
Solution: By reading the graph, we can see that the y-intercept is (0, 4), and thus

Furthermore, from the points (0, 4) to (4, 2), we can see that the rise is −2 units and the run is 4 units.

Now substitute m and b into slope-intercept form:

Answer:
Often the y-intercept and slope will not be given or are not easily discernible from the graph. For this reason, we will develop some algebraic techniques that allow us to calculate these quantities.
Example 3: Find the equation of the line with slope passing through (−6, 3).
Solution: Begin by substituting the given slope into slope-intercept form.

For the ordered pair (−6, 3) to be a solution, it must solve the equation. Therefore, we can use it to find b. Substitute the appropriate x- and y-values as follows:

After substituting the appropriate values, solve for the only remaining variable, b.

Once we have b, we can then complete the equation:

As a check, verify that (−6, 3) solves this linear equation as follows:

Answer:
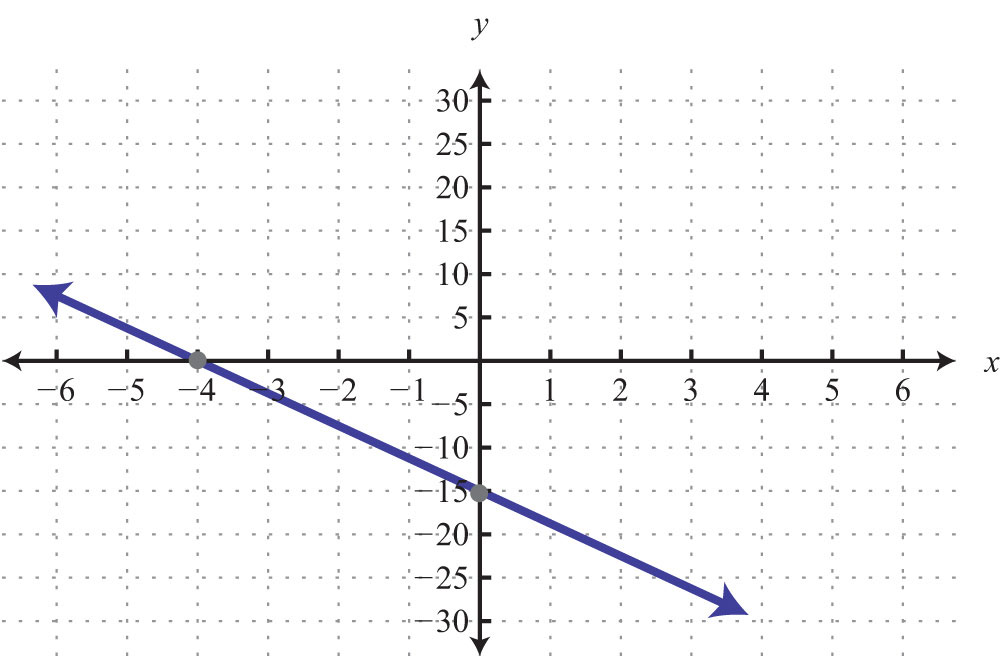
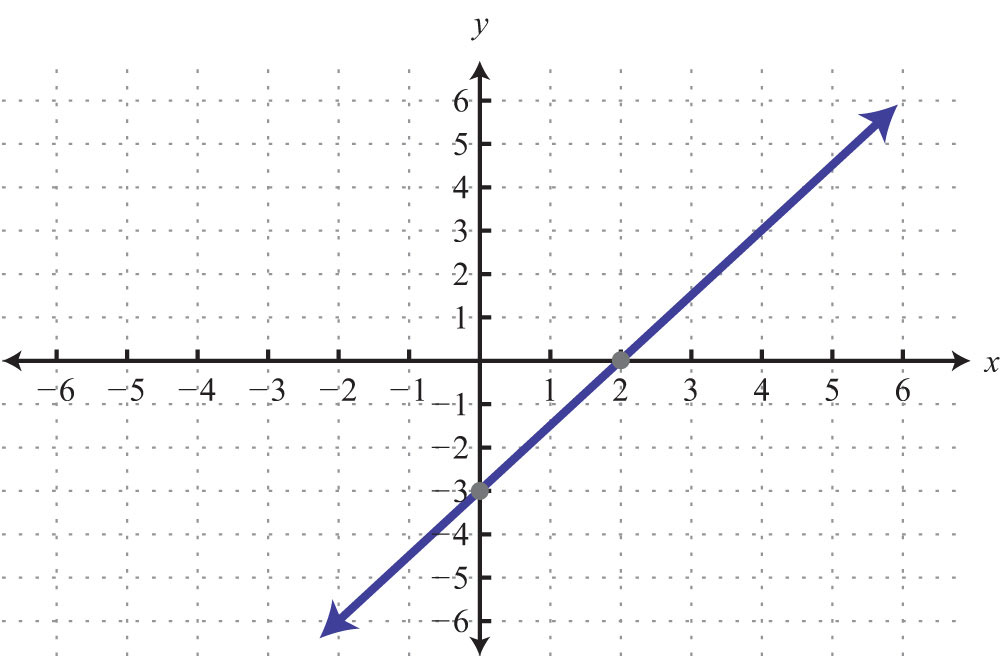
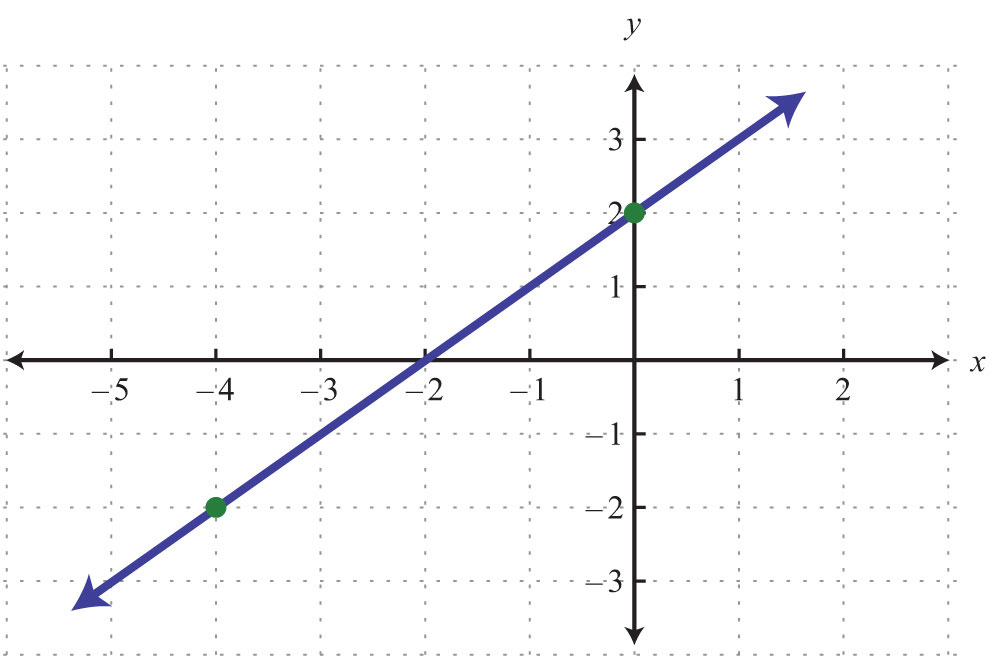
Example 4: Find the equation of the line given the graph:
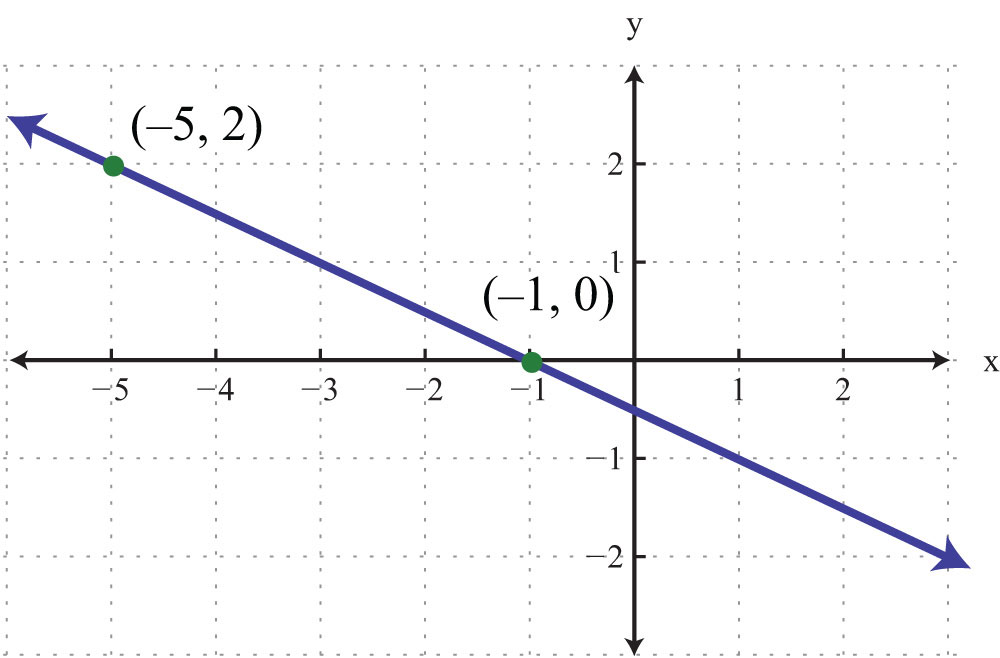
Solution: Use the graph to determine the slope. From the points (−5, 2) to (−1, 0), we can see that the rise between the points is −2 units and the run is 4 units. Therefore, we calculate the slope as follows:

Substitute the slope into slope-intercept form.

Now substitute the coordinates of one of the given points to find b. It does not matter which one you choose. Here choose (−1, 0):
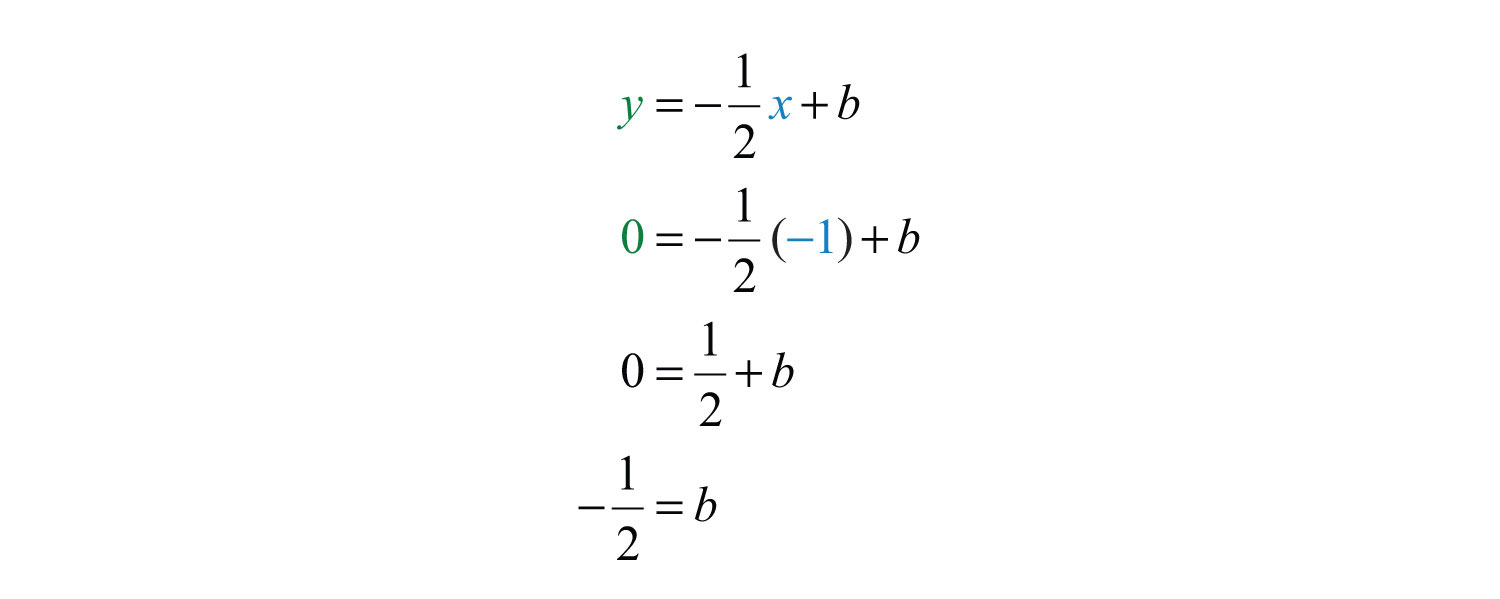
Next, put it all together.

Answer:
As an exercise, substitute the coordinates of the point (−5, 2) to see that b will turn out to be the same value. In fact, you can substitute any ordered pair solution of the line to find b. We next outline an algebraic technique for finding the equation of a nonvertical line passing through two given points.
Example 5: Find the equation of the line passing through (−4, −2) and (1, 3).
Solution: When finding a linear equation using slope-intercept form , the goal is to find m and then b.
Step 1: Find the slope m. In this case, given two points, use the slope formula.
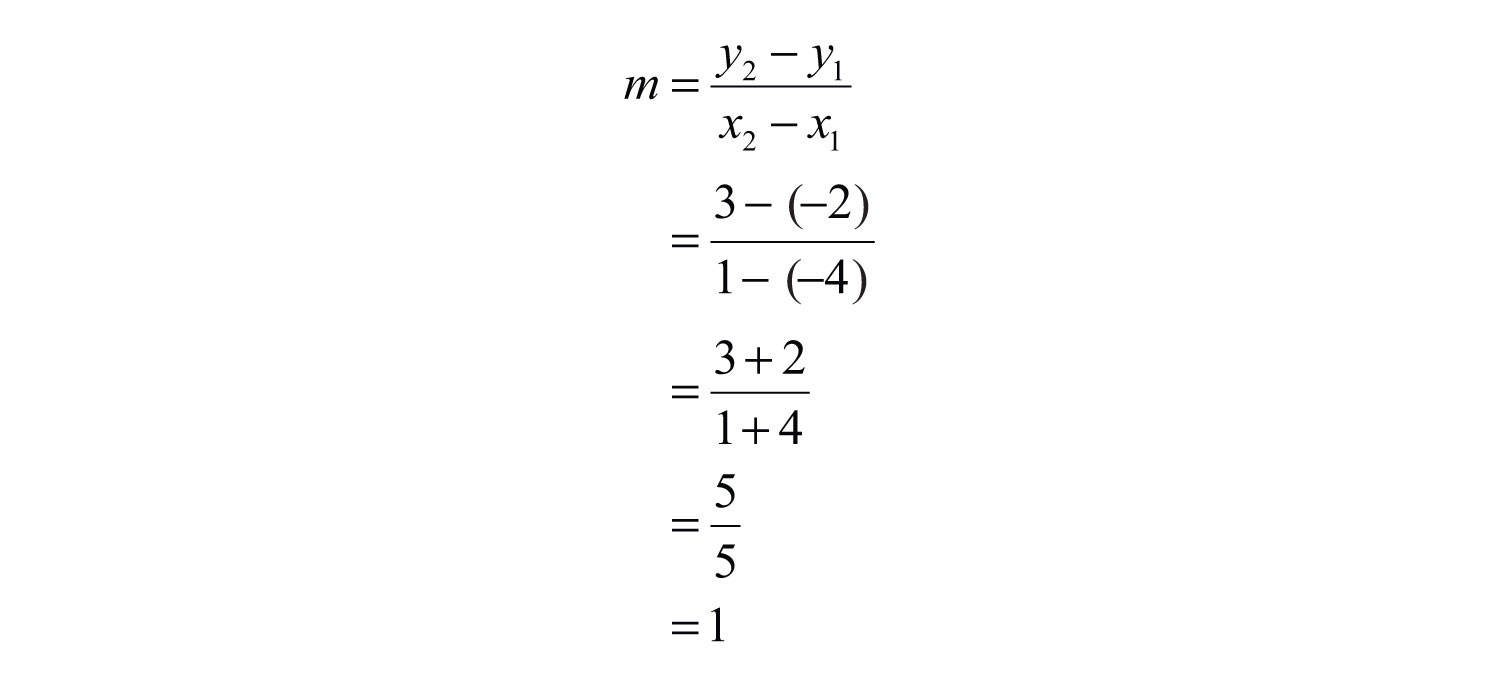
Substitute into slope-intercept form.

Step 2: Find b. To do this, substitute the coordinates of any given ordered pair solution. Use (1, 3):

Step 3: Finish building the equation by substituting in the value for b. In this case, we use .

Answer:
These three steps outline the process for finding the equation of any nonvertical line in slope-intercept form. This is a completely algebraic method, but always keep in mind the geometry behind the technique.
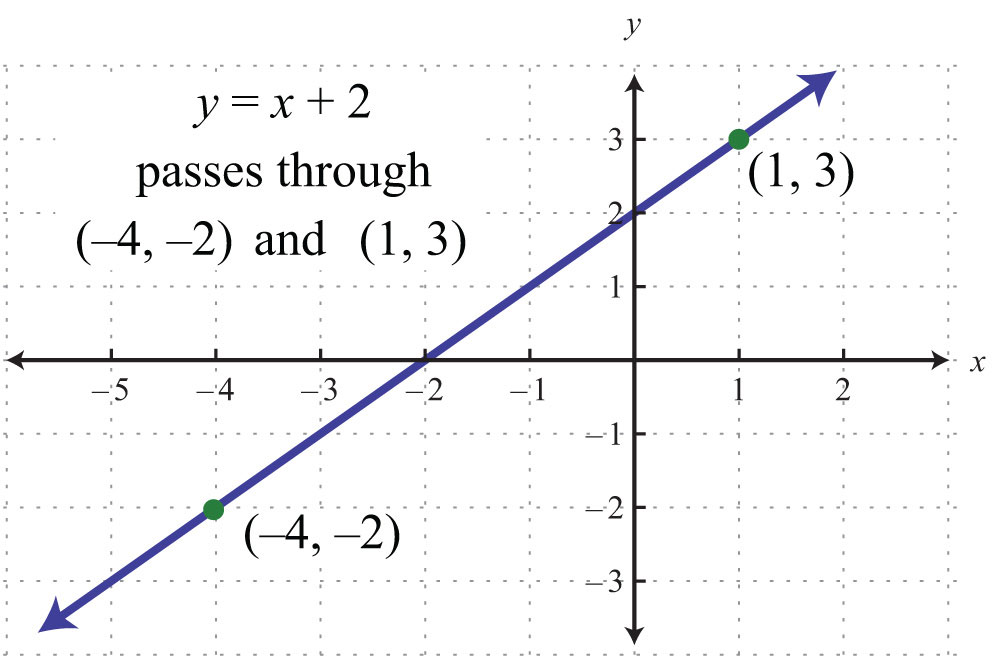
Note that the line has a y-intercept at (0, 2), with slope .
Example 6: Find the equation of the line passing through (−1, 3) and (5, 1).
Solution: First, find m, the slope. Given two points, use the slope formula as follows:
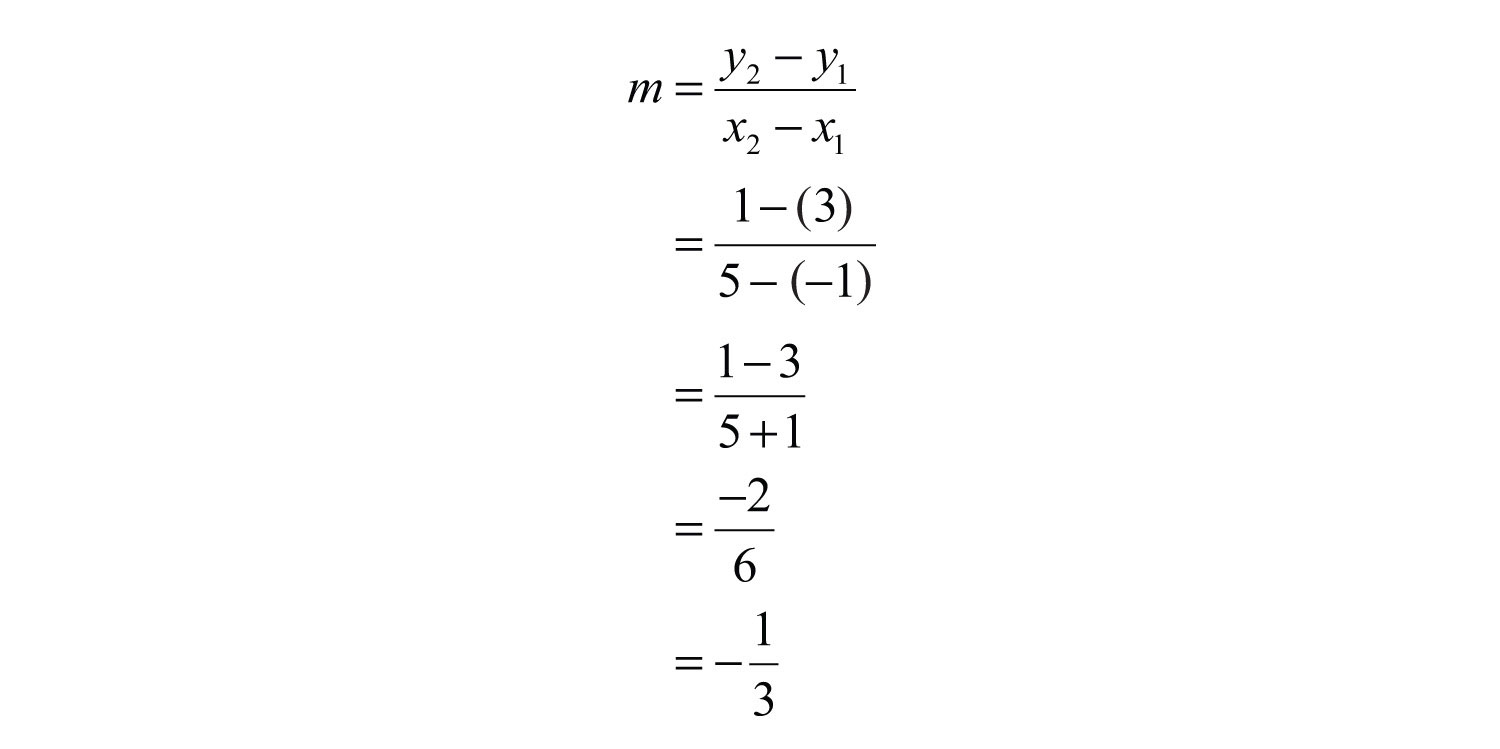
Substitute into slope-intercept form.

Next, find b. Substitute the coordinates of the point (−1, 3).
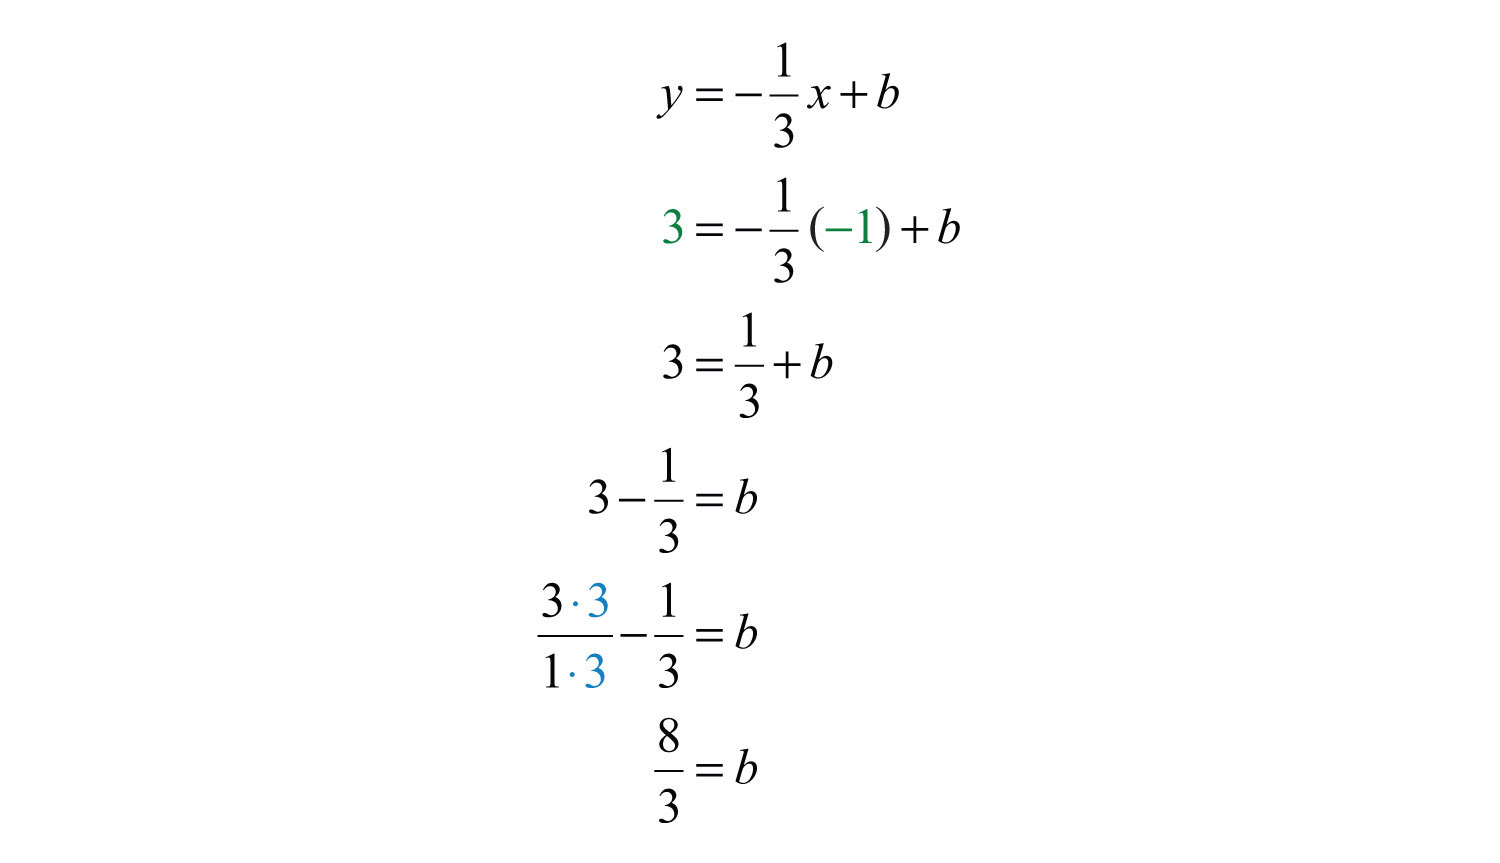
Finally, substitute into the equation.

Answer:
Try this! Find the equation of the line passing through (−3, 4) and (6, −2).
Answer:
Video Solution
(click to see video)Finding Equations Using a Point and the Slope
Given any point on a line and its slope, we can find the equation of that line. Begin by applying the slope formula with a given point and a variable point .
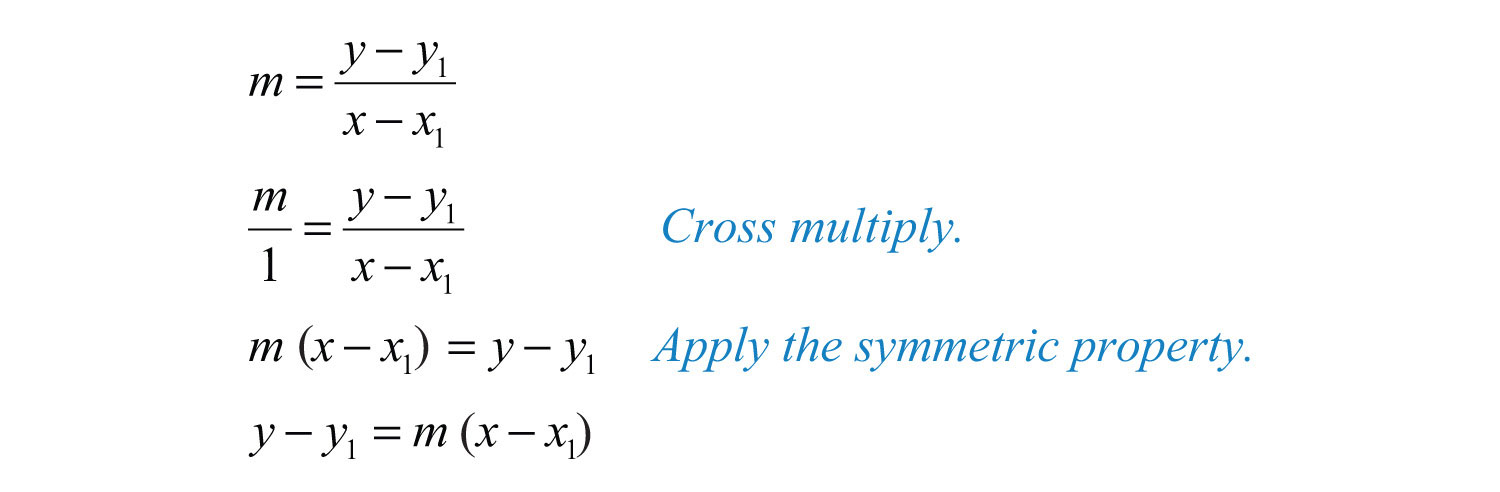
The equation is called the point-slope form of a lineAny nonvertical line can be written in the form , where m is the slope and is any point on the line.. Any nonvertical linear equation can be written in this form. It is useful for finding the equation of a line given the slope and any ordered pair solution.
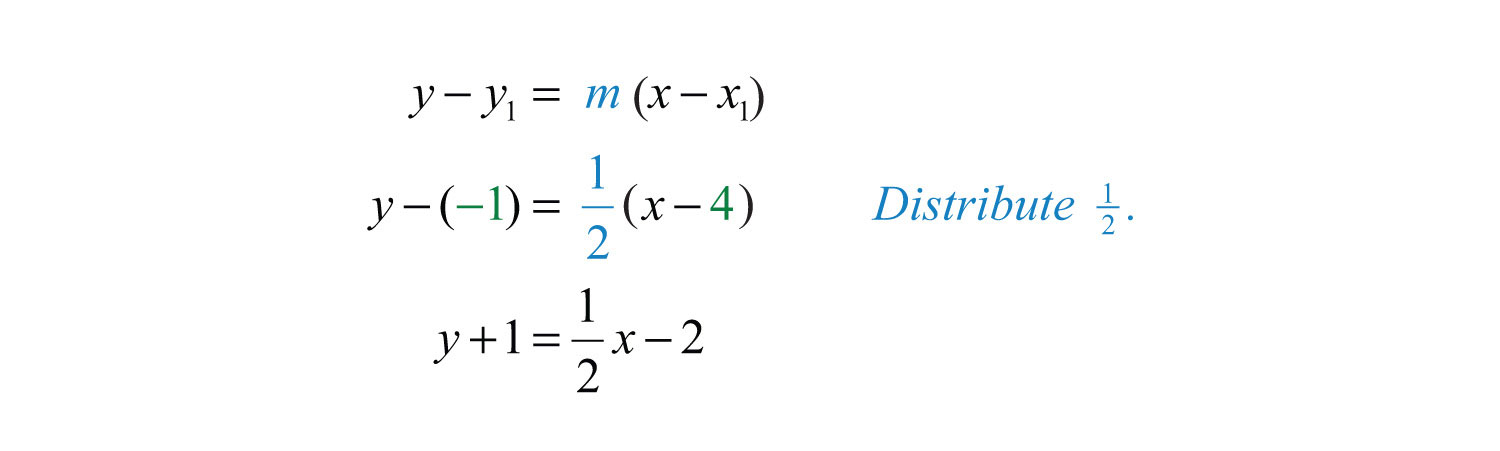
Example 7: Find the equation of the line with slope passing through (4, −1).
Solution: Use point-slope form, where and .
At this point, we must choose to present the equation of our line in either standard form or slope-intercept form.
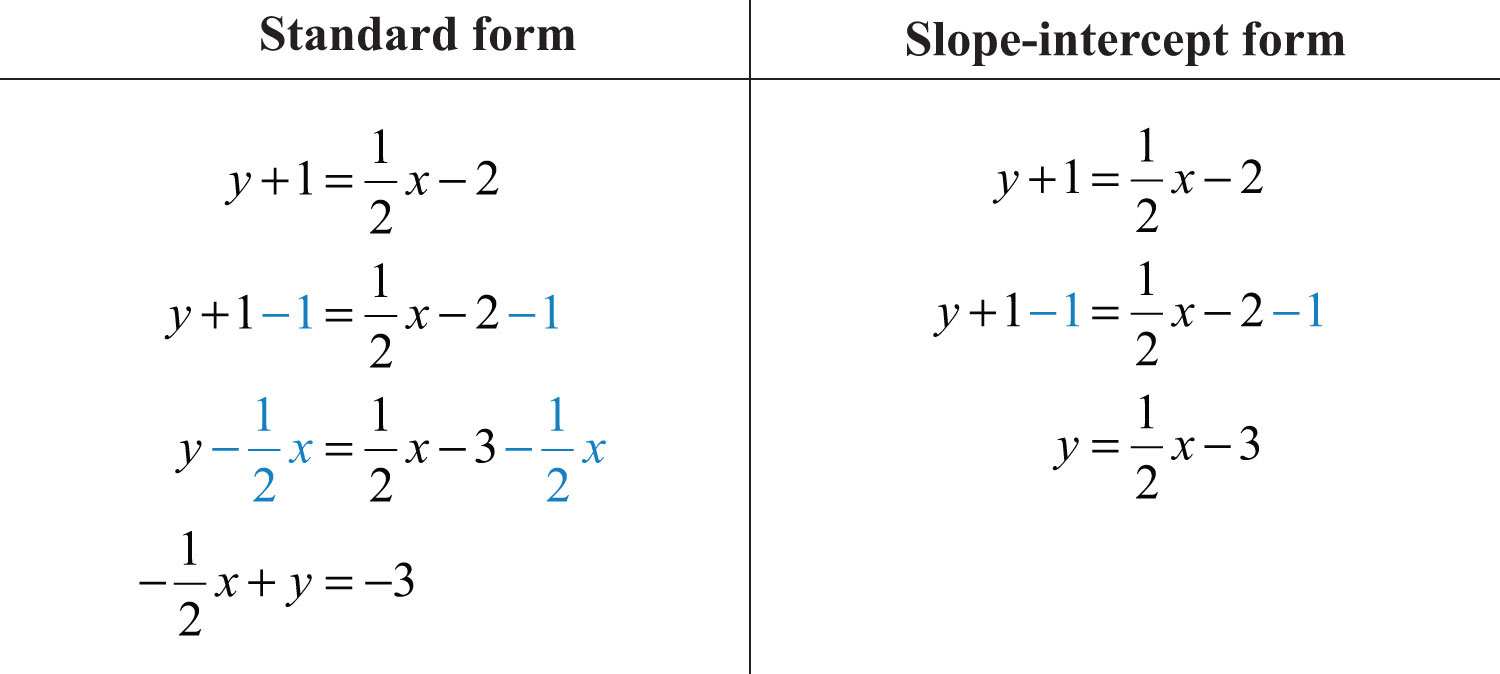
In this textbook, we will present our lines in slope-intercept form. This facilitates future graphing.
Answer:
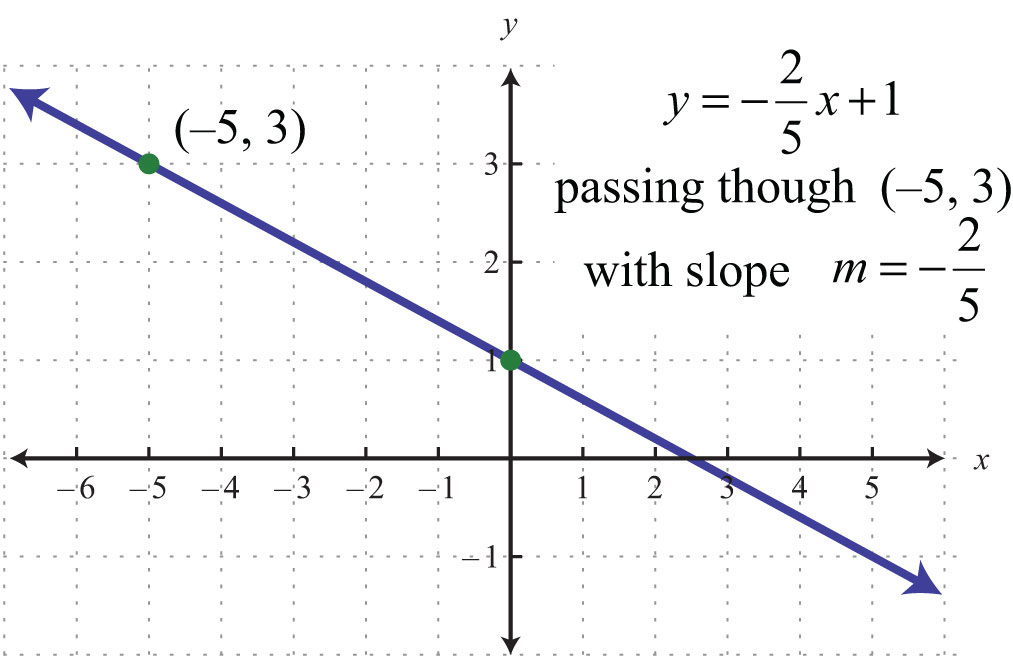
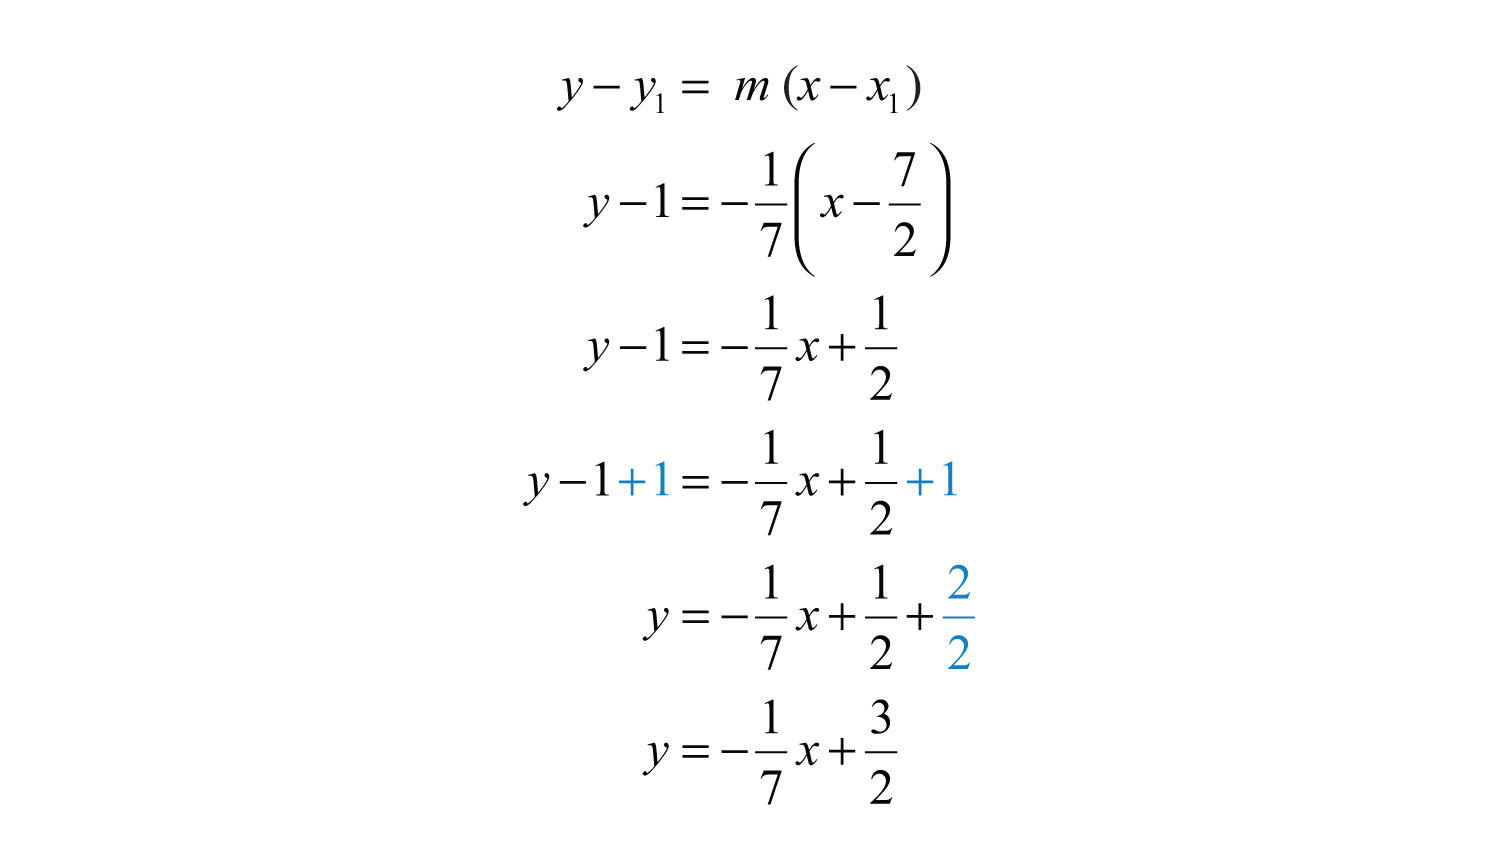
Example 8: Find the equation of the line passing through (−5, 3) with slope .
Solution: Substitute (−5, 3) and into point-slope form.
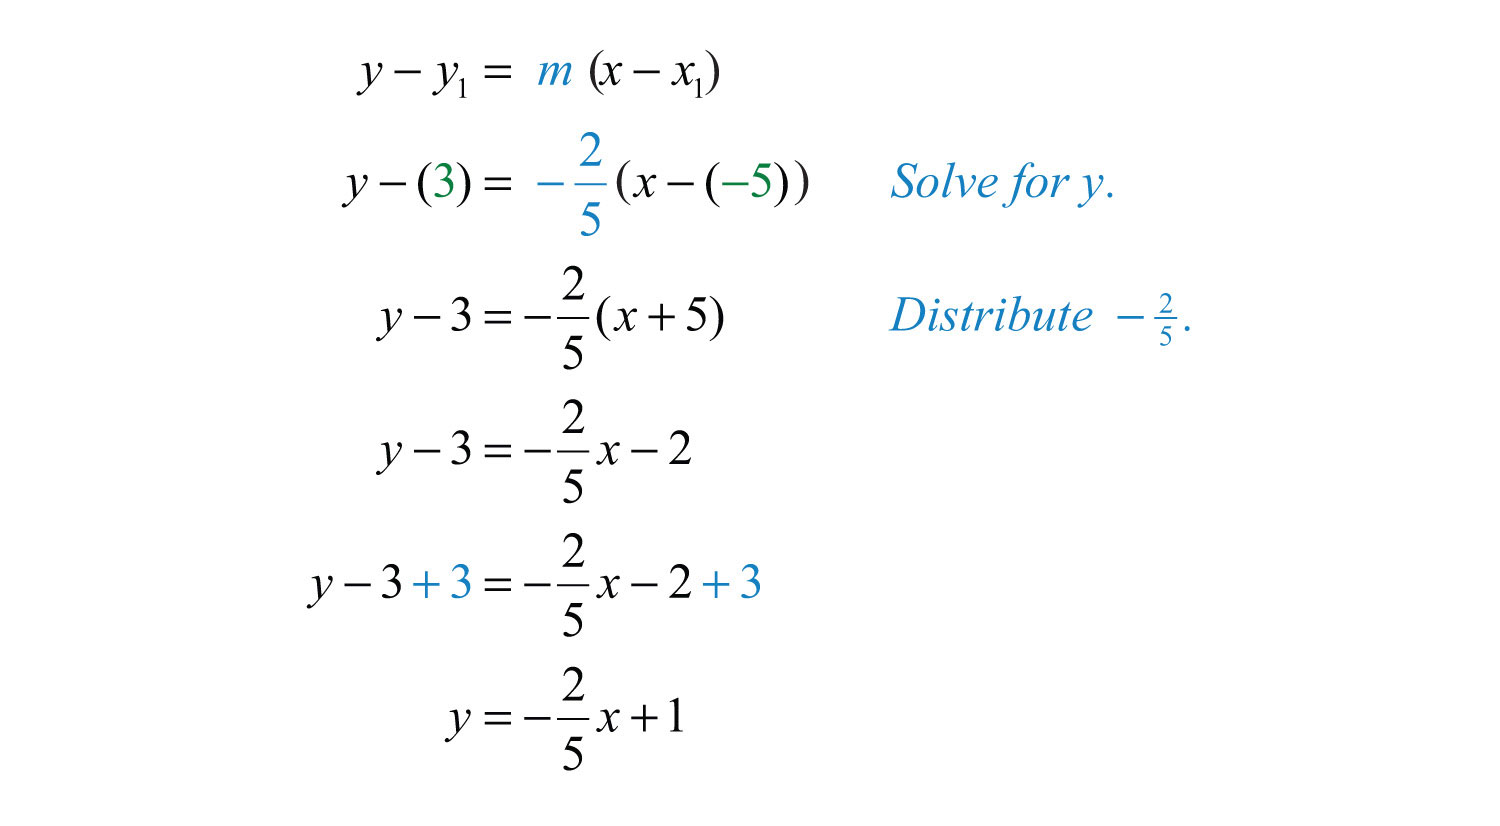
Answer:
It is always important to understand what is occurring geometrically. Compare the answer for the last example to the corresponding graph below.
The geometric understanding is important because you will often be given graphs from which you will need to determine a point on the line and the slope.
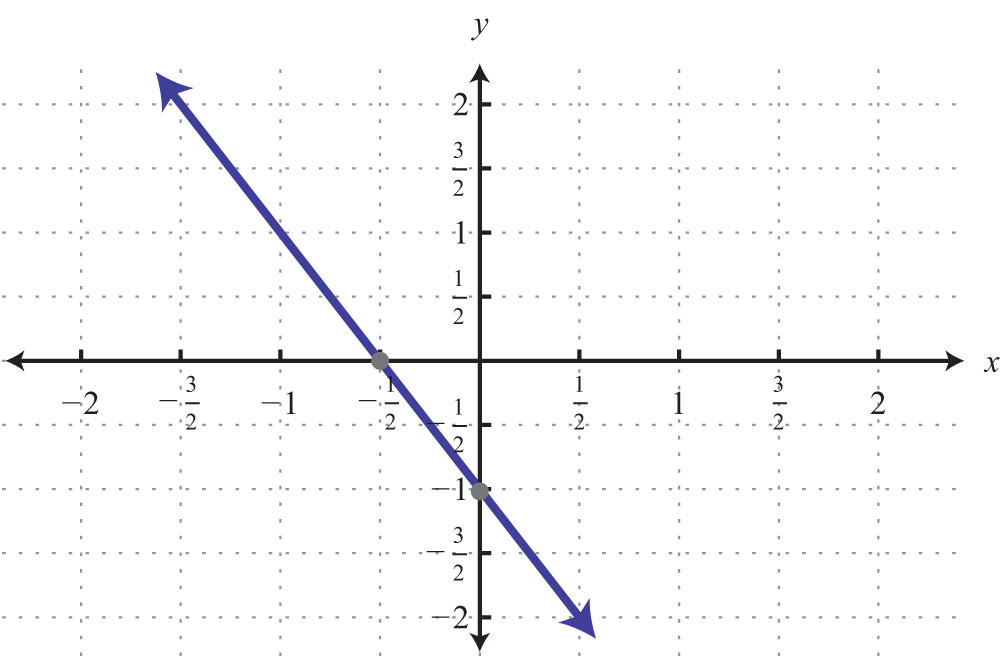
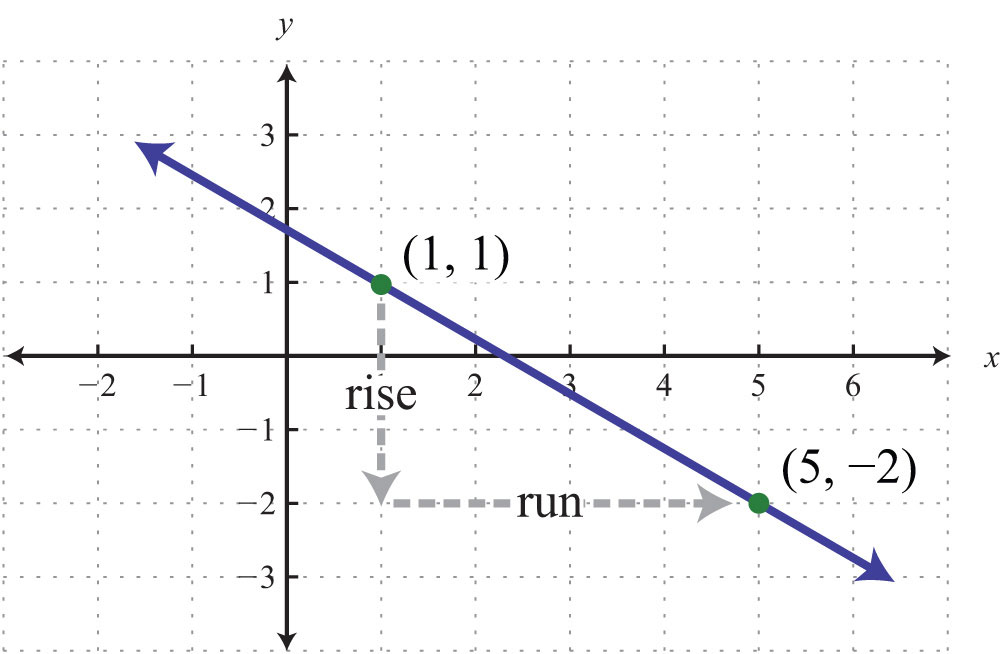
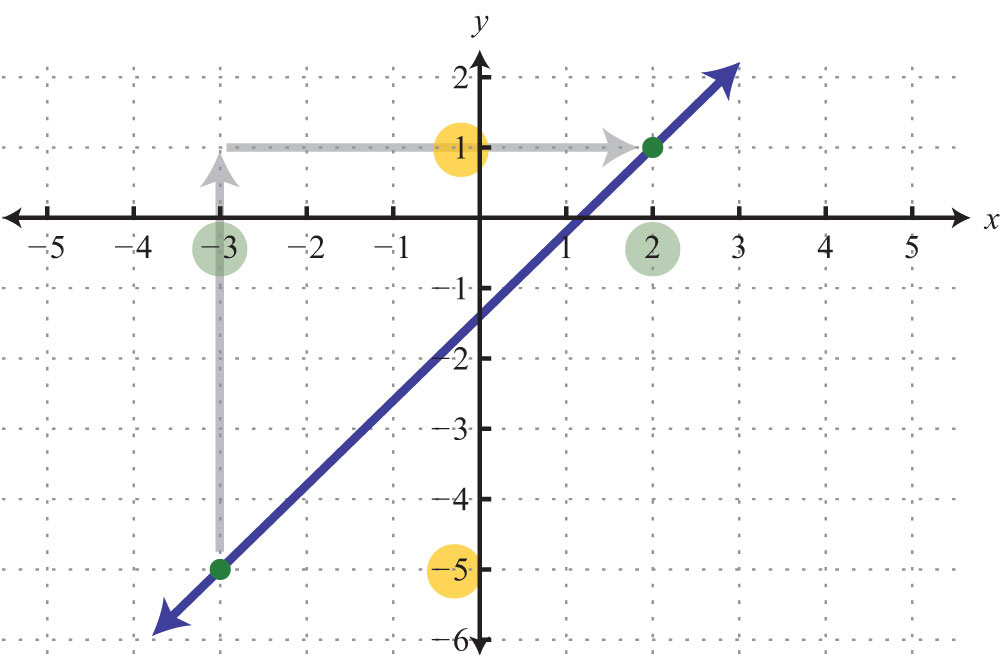
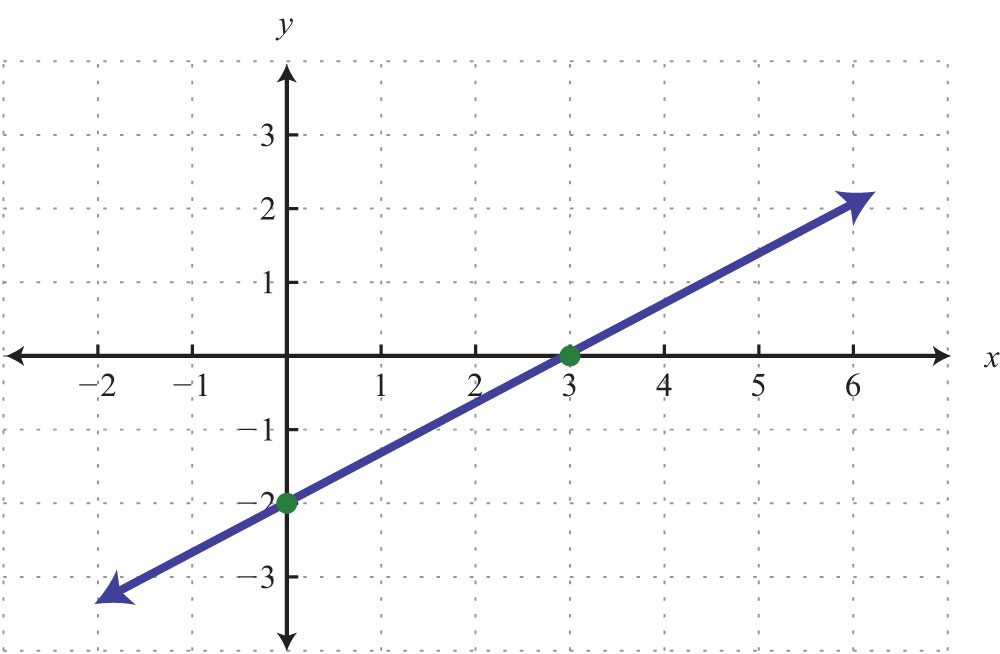
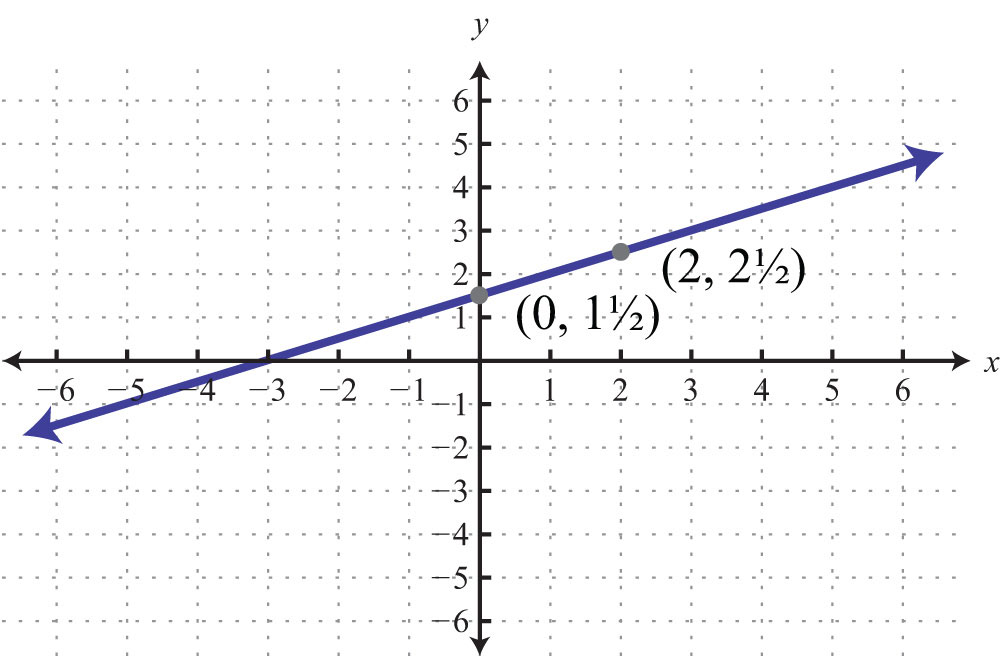
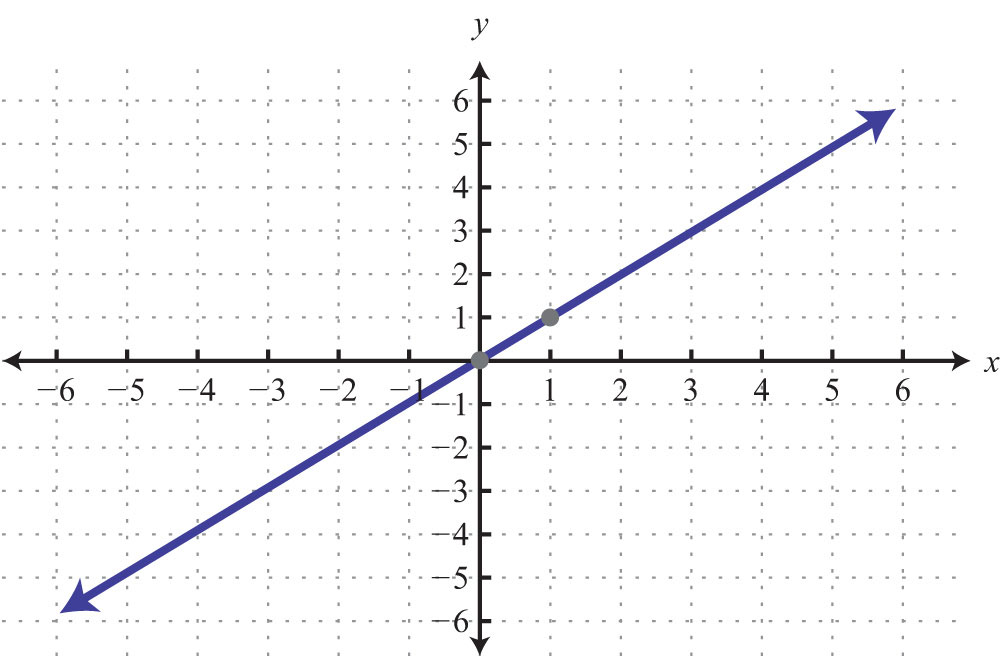
Example 9: Find an equation of the given graph:
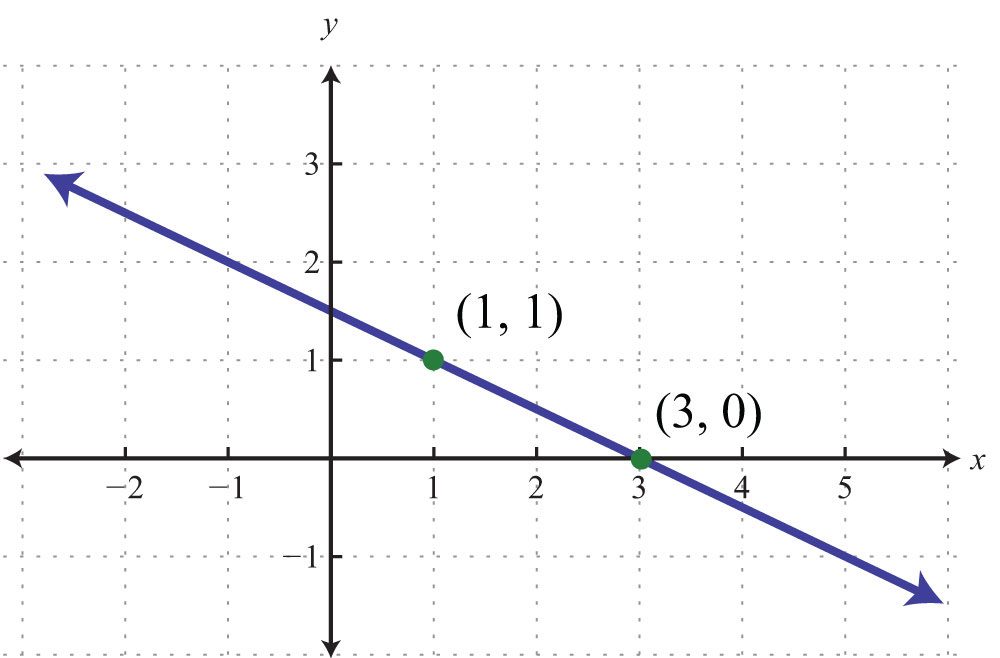
Solution: Between the points (1, 1) to (3, 0), we can see that the rise is −1 unit and the run is 2 units. The slope of the line is . Use this and the point (3, 0) to find the equation as follows:

Answer:
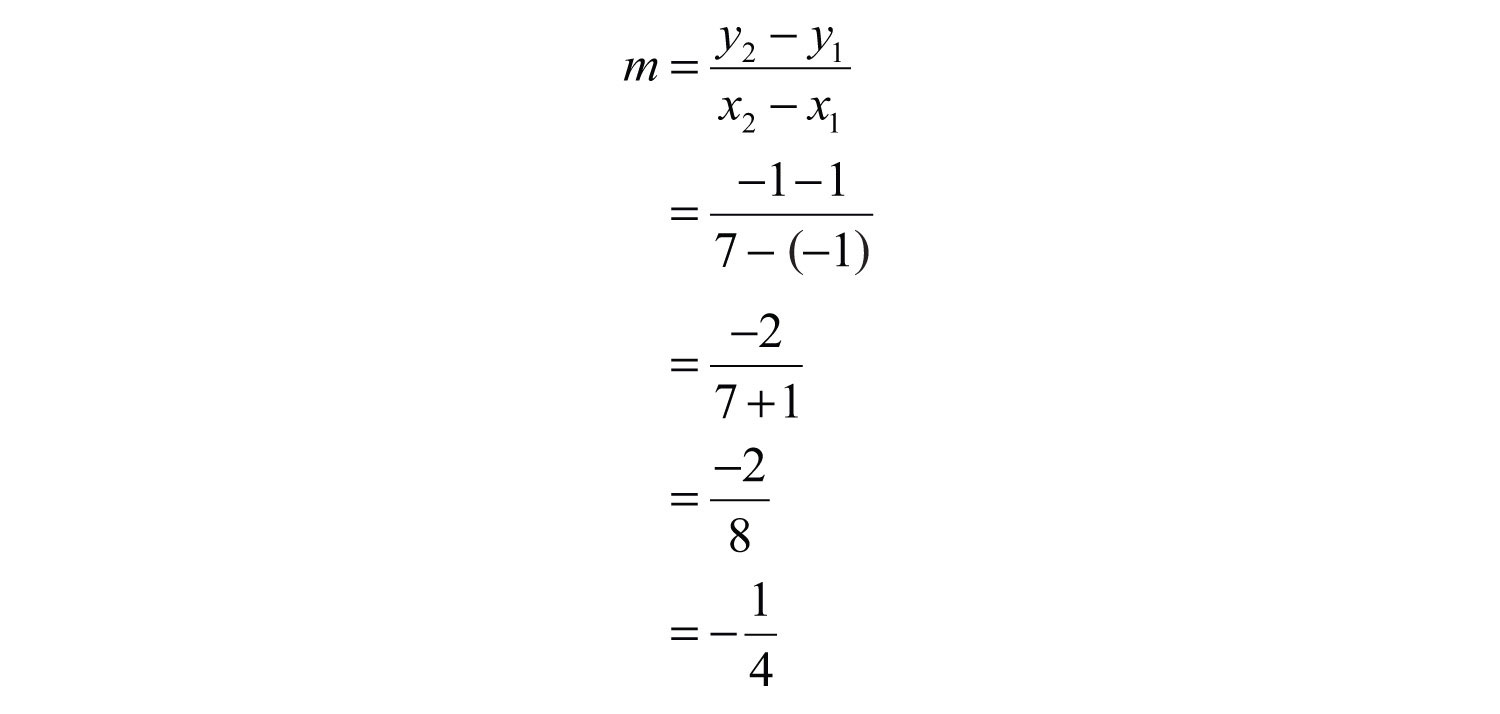
Example 10: Find the equation of the line passing through (−1, 1) and (7, −1).
Solution: Begin by calculating the slope using the slope formula.
Next, substitute into point-slope form using one of the given points; it does not matter which point is used. Use and the point (−1, 1).
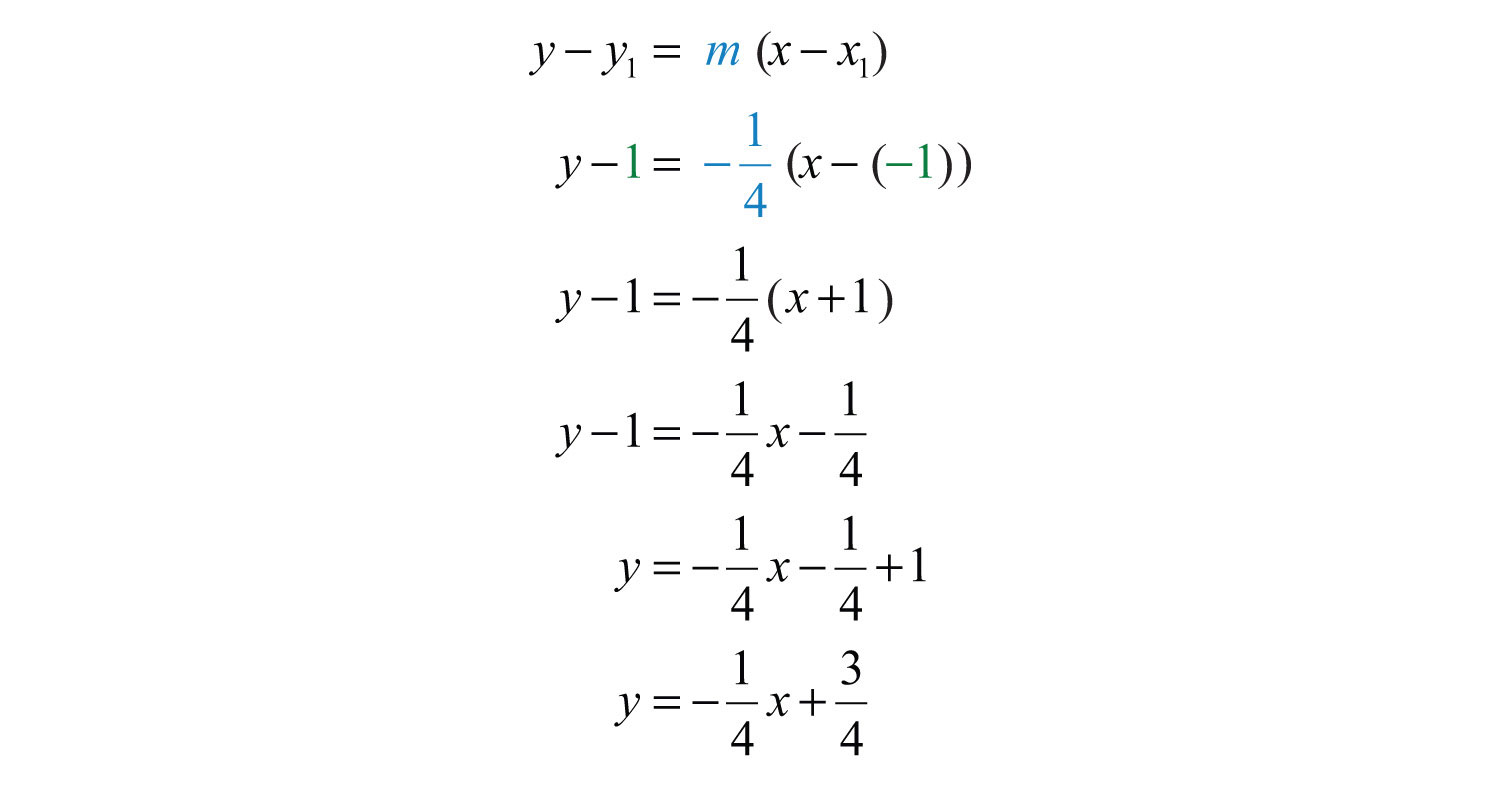
Answer:
Try this! Find the equation of the line passing through (4, −5) and (−4, 1).
Answer:
Video Solution
(click to see video)Key Takeaways
- Given the graph of a line, you can determine the equation in two ways, using slope-intercept form, , or point-slope form, .
- The slope and one point on the line is all that is needed to write the equation of a line.
- All nonvertical lines are completely determined by their y-intercept and slope.
- If the slope and y-intercept can be determined, then it is best to use slope-intercept form to write the equation.
- If the slope and a point on the line can be determined, then it is best to use point-slope form to write the equation.
Topic Exercises
Part A: Slope-Intercept Form
Determine the slope and y-intercept.
1.
2.
3.
4.
5.
6.
7.
8.
9.
10.
11.
12.
Part B: Finding Equations in Slope-Intercept Form
Given the slope and y-intercept, determine the equation of the line.
13. m = 1/2; (0, 5)
14. m = 4; (0, −1)
15. m = −2/3; (0, −4)
16. m = −3; (0, 9)
17. m = 0; (0, −1)
18. m = 5; (0, 0)
Given the graph, find the equation in slope-intercept form.
19.
20.
21.
22.
23.
24.
Find the equation, given the slope and a point.
25. m = 2/3; (−9, 2)
26. m = −1/5; (5, −5)
27. m = 0; (−4, 3)
28. m = 3; (−2, 1)
29. m = −5; (−2, 8)
30. m = −4; (1/2, −3/2)
31. m = −1/2; (3, 2)
32. m = 3/4; (1/3, 5/4)
33. m = 0; (3, 0)
34. m undefined; (3, 0)
Given two points, find the equation of the line.
35. (−6, 6), (2, 2)
36. (−10, −3), (5, 0)
37. (0, 1/2), (1/2, −1)
38. (1/3, 1/3), (2/3, 1)
39. (3, −4), (−6, −7)
40. (−5, 2), (3, 2)
41. (−6, 4), (−6, −3)
42. (−4, −4), (−1, −1)
43. (3, −3), (−5, 5)
44. (0, 8), (−4, 0)
Part C: Equations Using Point-Slope Form
Find the equation, given the slope and a point.
45. m = 1/2; (4, 3)
46. m = −1/3; (9, −2)
47. m = 6; (1, −5)
48. m = −10; (1, −20)
49. m = −3; (2, 3)
50. m = 2/3; (−3, −5)
51. m = −3/4; (−8, 3)
52. m = 5; (1/5, −3)
53. m = −3; (−1/9, 2)
54. m = 0; (4, −6)
55. m = 0; (−5, 10)
56. m = 5/8; (4, 3)
57. m = −3/5; (−2, −1)
58. m = 1/4; (12, −2)
59. m = 1; (0, 0)
60. m = −3/4; (0, 0)
Given the graph, use the point-slope formula to find the equation.
61.
62.
63.
64.
65.
66.
Use the point-slope formula to find the equation of the line passing through the two points.
67. (−4, 0), (0, 5)
68. (−1, 2), (0, 3)
69. (−3, −2), (3, 2)
70. (3, −1), (2, −3)
71. (−2, 4), (2, −4)
72. (−5, −2), (5, 2)
73. (−3, −1), (3, 3)
74. (1, 5), (0, 5)
75. (1, 2), (2, 4)
76. (6, 3), (2, −3)
77. (10, −3), (5, −4)
78. (−3, 3), (−1, 12)
79. (4/5, −1/3), (−1/5, 2/3)
80. (5/3, 1/3), (−10/3, −5/3)
81. (3, −1/4), (4, −1/2)
82. (0, 0), (−5, 1)
83. (2, −4), (0, 0)
84. (3, 5), (3, −2)
85. (−4, 7), (−1, 7)
86. (−8, 0), (6, 0)
Part D: Applications
87. Joe has been keeping track of his cellular phone bills for the last two months. The bill for the first month was $38.00 for 100 minutes of usage. The bill for the second month was $45.50 for 150 minutes of usage. Find a linear equation that gives the total monthly bill based on the minutes of usage.
88. A company in its first year of business produced 150 training manuals for a total cost of $2,350. The following year, the company produced 50 more manuals at a cost of $1,450. Use this information to find a linear equation that gives the total cost of producing training manuals from the number of manuals produced.
89. A corn farmer in California was able to produce 154 bushels of corn per acre 2 years after starting his operation. Currently, after 7 years of operation, he has increased his yield to 164 bushels per acre. Use this information to write a linear equation that gives the total yield per acre based on the number of years of operation, and use it to predict the yield for next year.
90. A Webmaster has noticed that the number of registered users has been steadily increasing since beginning an advertising campaign. Before starting to advertise, he had 1,200 registered users, and after 3 months of advertising he now has 1,590 registered users. Use this data to write a linear equation that gives the total number of registered users, given the number of months after starting to advertise. Use the equation to predict the number of users 7 months into the advertising campaign.
91. A car purchased new cost $22,000 and was sold 10 years later for $7,000. Write a linear equation that gives the value of the car in terms of its age in years.
92. An antique clock was purchased in 1985 for $1,500 and sold at auction in 1997 for $5,700. Determine a linear equation that models the value of the clock in terms of years since 1985.
Part E: Discussion Board Topics
93. Discuss the merits and drawbacks of point-slope form and y-intercept form.
94. Research and discuss linear depreciation. In a linear depreciation model, what do the slope and y-intercept represent?
Answers
1: m = 5/3; (0, −6)
3: m = 1; (0, −5)
5: m = 4/5; (0, −3)
7: m = 0; (0, 3)
9: m = 3/5; (0, 3)
11: m = 4/15; (0, 1/2)
13:
15:
17:
19:
21:
23:
25:
27:
29:
31:
33:
35:
37:
39:
41:
43:
45:
47:
49:
51:
53:
55:
57:
59:
61:
63:
65:
67:
69:
71:
73:
75:
77:
79:
81:
83:
85:
87:
89: ; 166 bushels
91:
3.6 Parallel and Perpendicular Lines
Learning Objectives
- Determine the slopes of parallel and perpendicular lines.
- Find equations of parallel and perpendicular lines.
Definition of Parallel and Perpendicular
Parallel linesLines in the same plane that do not intersect; their slopes are the same. are lines in the same plane that never intersect. Two nonvertical lines in the same plane, with slopes and , are parallel if their slopes are the same, . Consider the following two lines:

Consider their corresponding graphs:
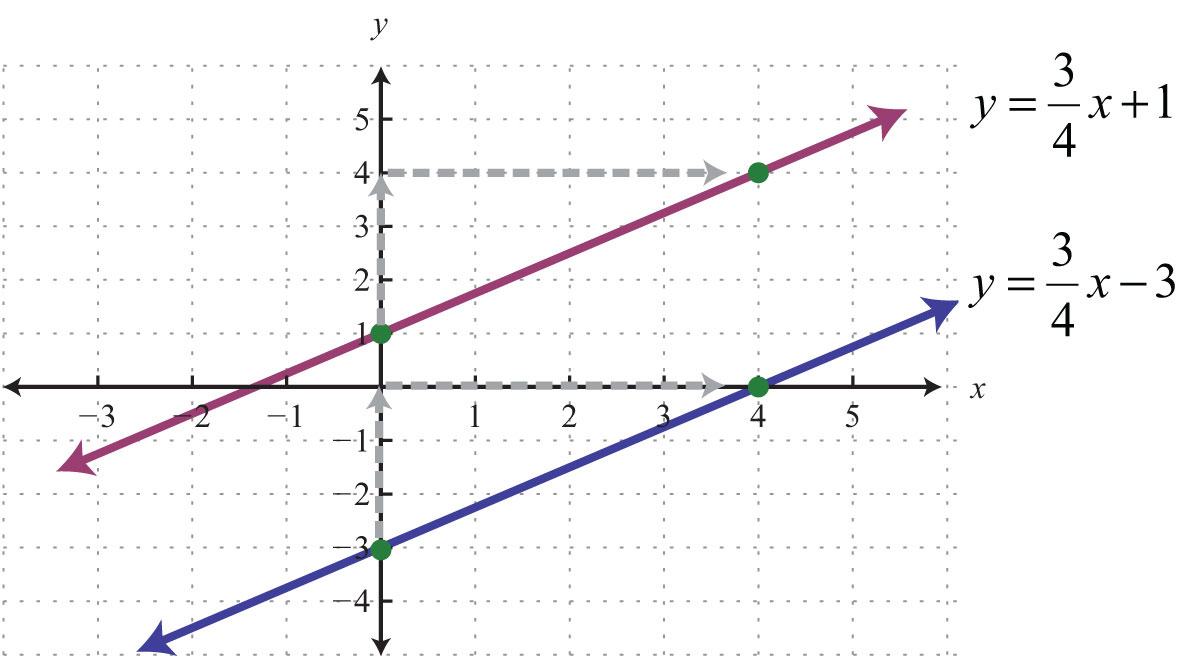
Both lines have a slope and thus are parallel.
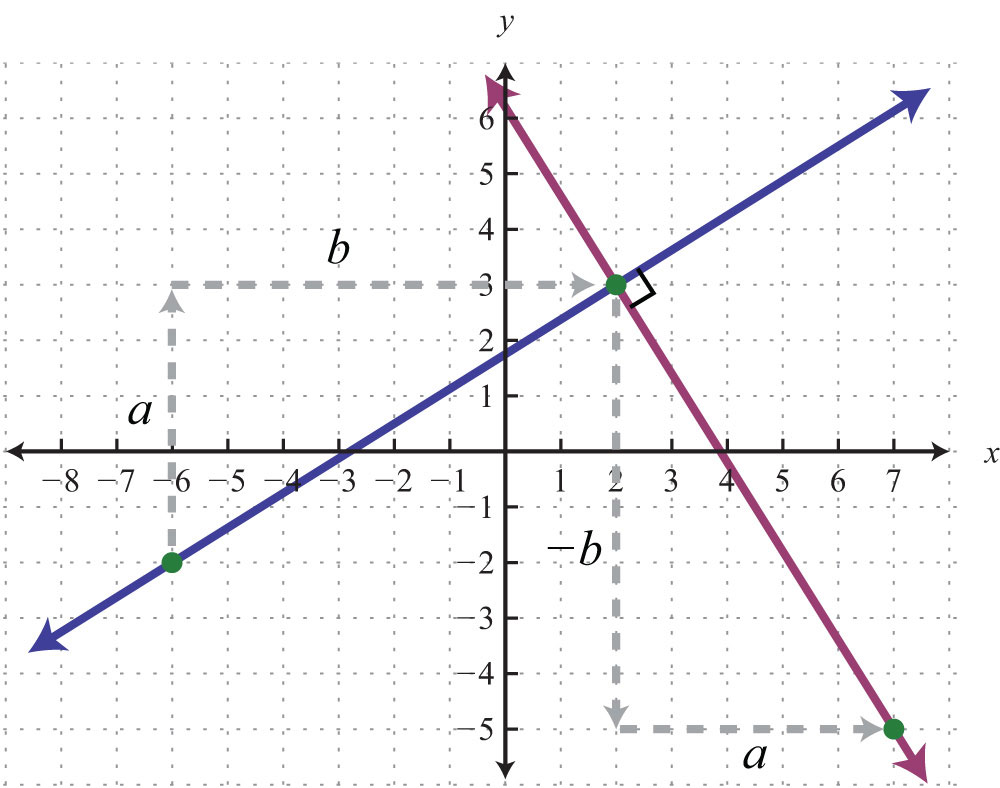
Perpendicular linesLines in the same plane that intersect at right angles; their slopes are opposite reciprocals. are lines in the same plane that intersect at right angles (90 degrees). Two nonvertical lines in the same plane, with slopes and , are perpendicular if the product of their slopes is −1: . We can solve for and obtain . In this form, we see that perpendicular lines have slopes that are negative reciprocals, or opposite reciprocalsTwo real numbers whose product is −1. Given a real number , the opposite reciprocal is .. For example, if given a slope

then the slope of a perpendicular line is the opposite reciprocal:

The mathematical notation reads “m perpendicular.” We can verify that two slopes produce perpendicular lines if their product is −1.

Geometrically, we note that if a line has a positive slope, then any perpendicular line will have a negative slope. Furthermore, the rise and run between two perpendicular lines are interchanged.
Perpendicular lines have slopes that are opposite reciprocals, so remember to find the reciprocal and change the sign. In other words,

Determining the slope of a perpendicular line can be performed mentally. Some examples follow.
| Given slope | Slope of perpendicular line |
|---|---|
Example 1: Determine the slope of a line parallel to .
Solution: Since the given line is in slope-intercept form, we can see that its slope is . Thus the slope of any line parallel to the given line must be the same, . The mathematical notation reads “m parallel.”
Answer:
Example 2: Determine the slope of a line perpendicular to .
Solution: First, solve for y and express the line in slope-intercept form.
In this form, we can see that the slope of the given line is , and thus .
Answer:
Try this! Find the slope of the line perpendicular to .
Answer:
Video Solution
(click to see video)Finding Equations of Parallel and Perpendicular Lines
We have seen that the graph of a line is completely determined by two points or one point and its slope. Often you will be asked to find the equation of a line given some geometric relationship—for instance, whether the line is parallel or perpendicular to another line.
Example 3: Find the equation of the line passing through (6, −1) and parallel to .
Solution: Here the given line has slope , and the slope of a line parallel is . Since you are given a point and the slope, use the point-slope form of a line to determine the equation.
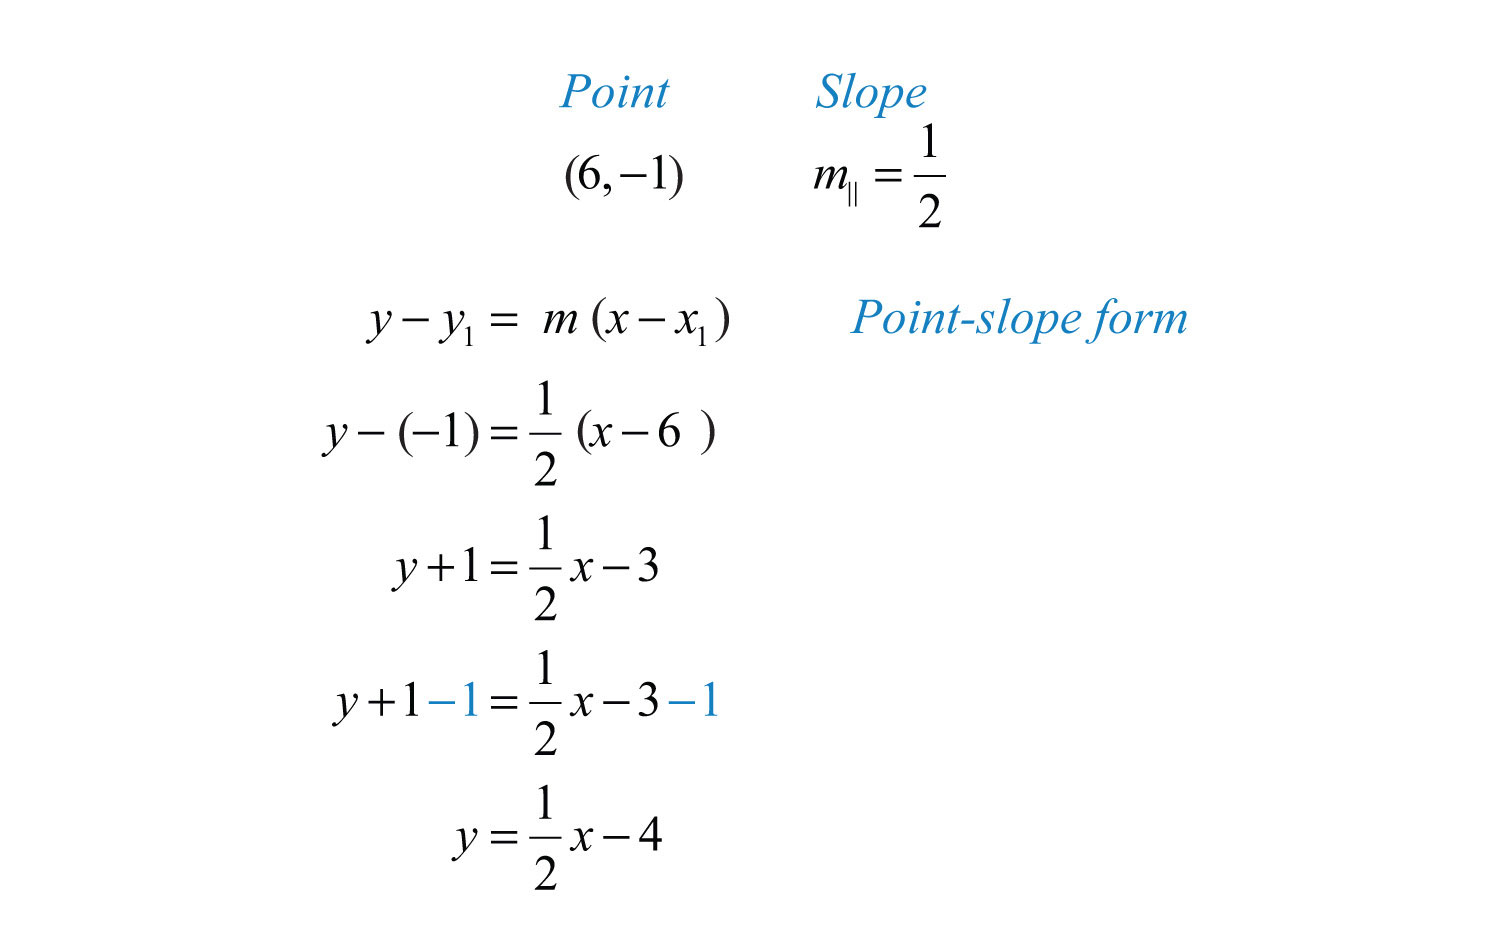
Answer:
It is important to have a geometric understanding of this question. We were asked to find the equation of a line parallel to another line passing through a certain point.
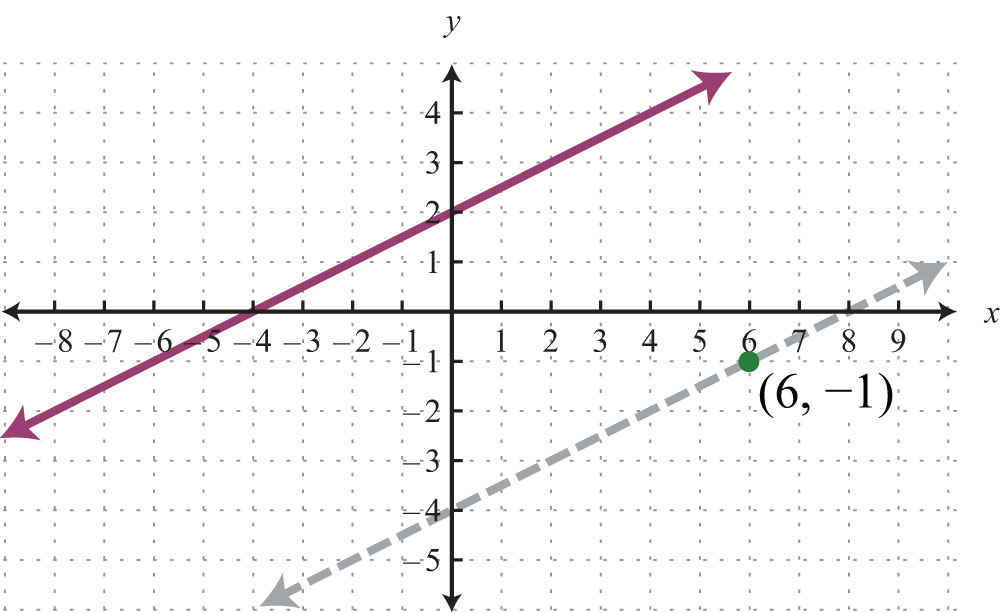
Through the point (6, −1) we found a parallel line, , shown dashed. Notice that the slope is the same as the given line, but the y-intercept is different. If we keep in mind the geometric interpretation, then it will be easier to remember the process needed to solve the problem.
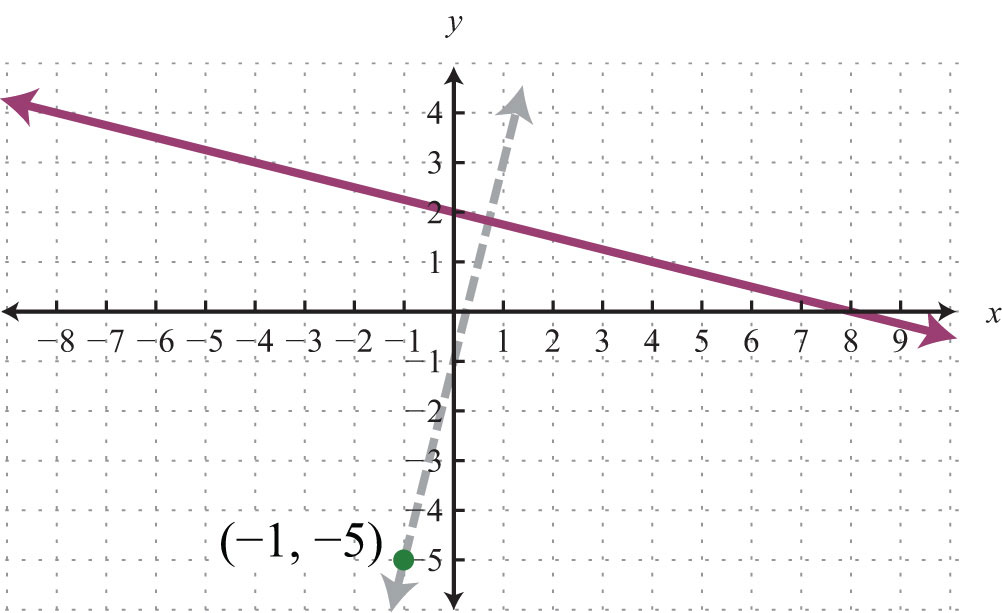
Example 4: Find the equation of the line passing through (−1, −5) and perpendicular to .
Solution: The given line has slope , and thus . Substitute this slope and the given point into point-slope form.
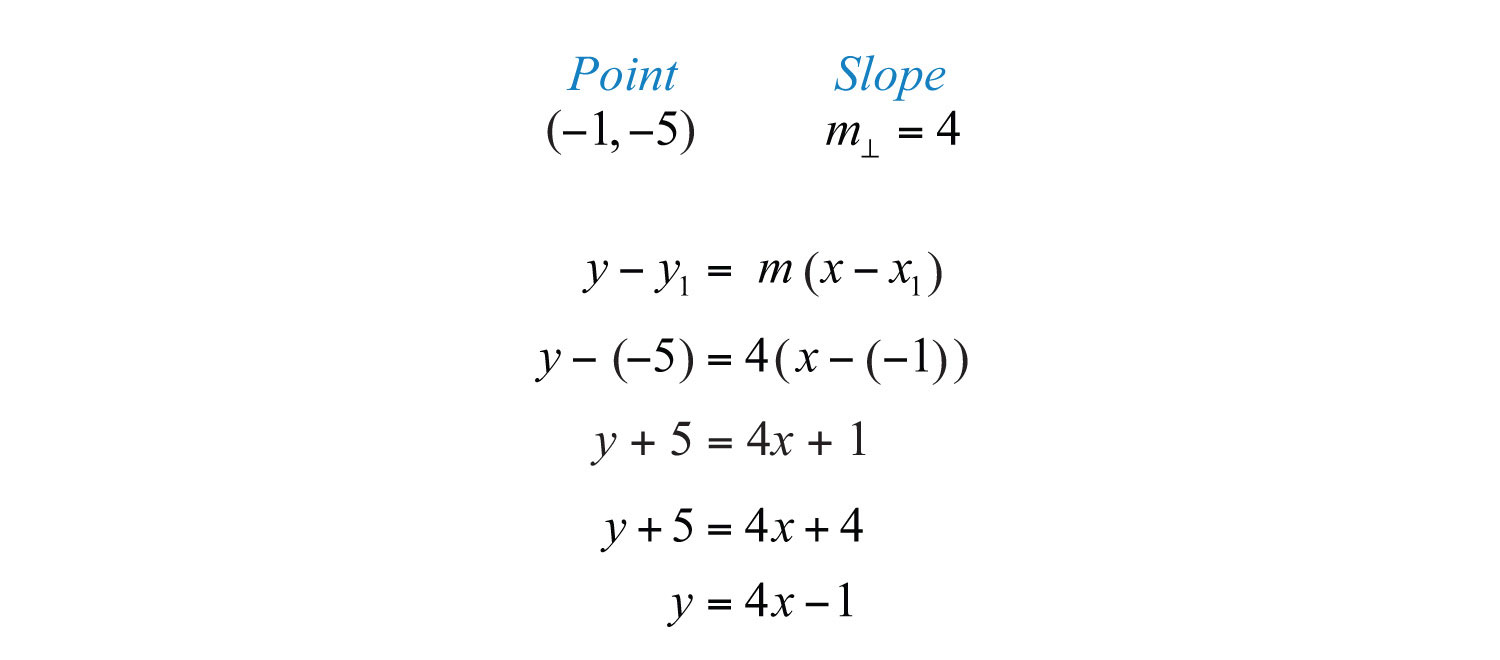
Answer:
Geometrically, we see that the line , shown dashed below, passes through (−1, −5) and is perpendicular to the given line.
It is not always the case that the given line is in slope-intercept form. Often you have to perform additional steps to determine the slope. The general steps for finding the equation of a line are outlined in the following example.
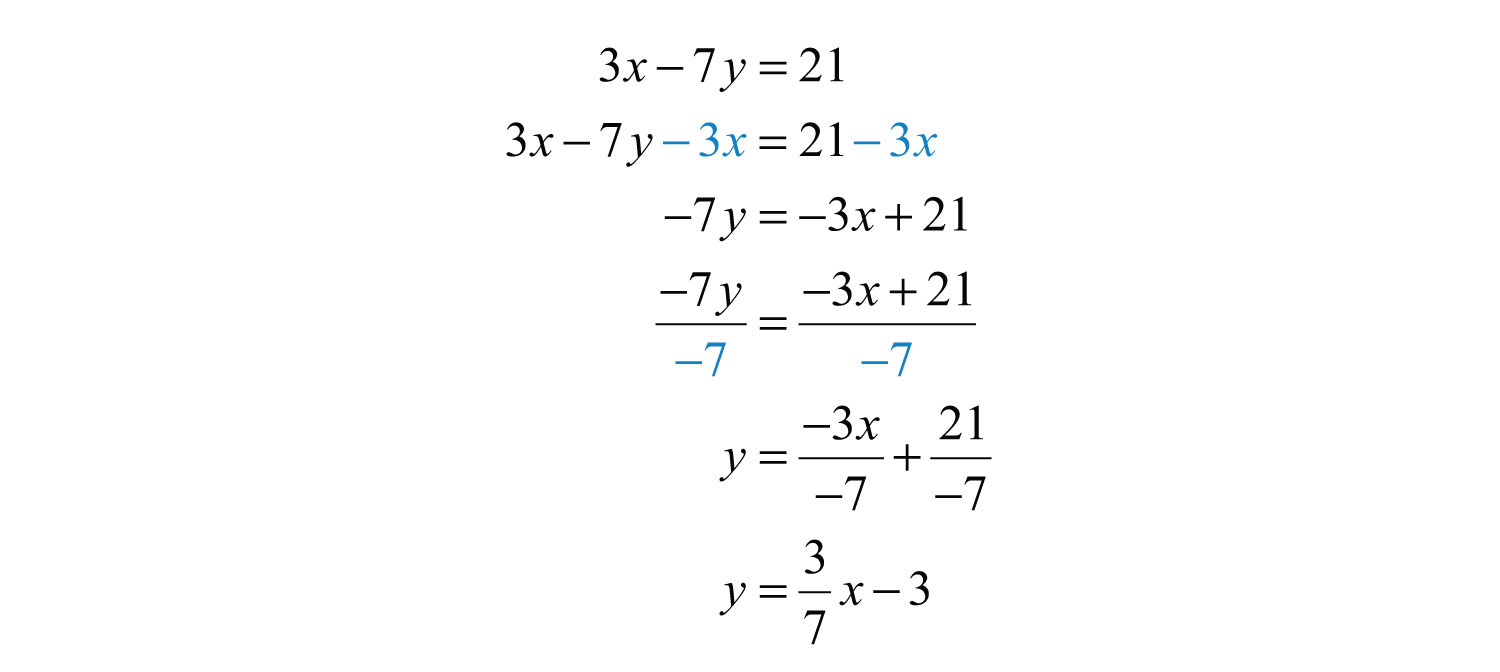
Example 5: Find the equation of the line passing through (8, −2) and perpendicular to .
Solution:
Step 1: Find the slope m. First, find the slope of the given line. To do this, solve for y to change standard form to slope-intercept form, .
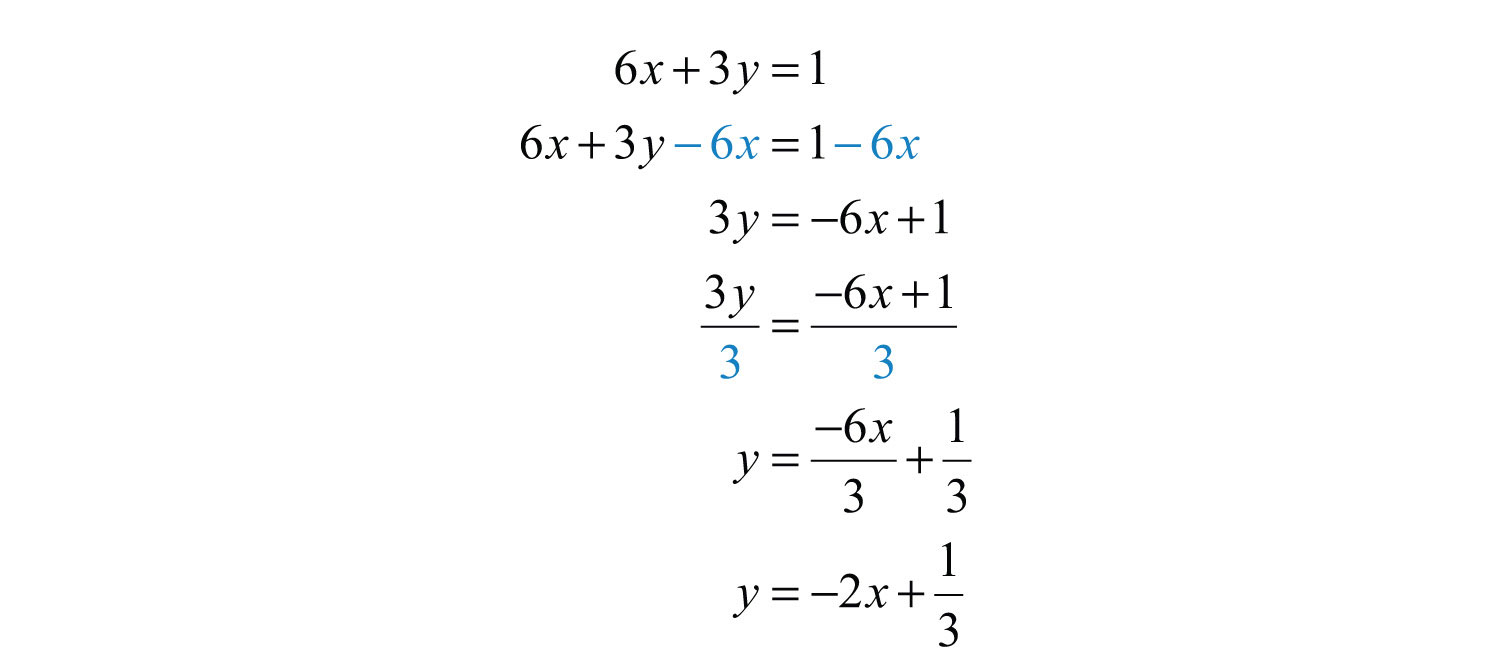
In this form, you can see that the slope is , and thus .
Step 2: Substitute the slope you found and the given point into the point-slope form of an equation for a line. In this case, the slope is and the given point is (8, −2).

Step 3: Solve for y.

Answer:
Example 6: Find the equation of the line passing through and parallel to .
Solution: Find the slope m by solving for y.
The given line has the slope , and so . We use this and the point in point-slope form.
Answer:
Try this! Find the equation of the line perpendicular to and passing through .
Answer:
Video Solution
(click to see video)When finding an equation of a line perpendicular to a horizontal or vertical line, it is best to consider the geometric interpretation.
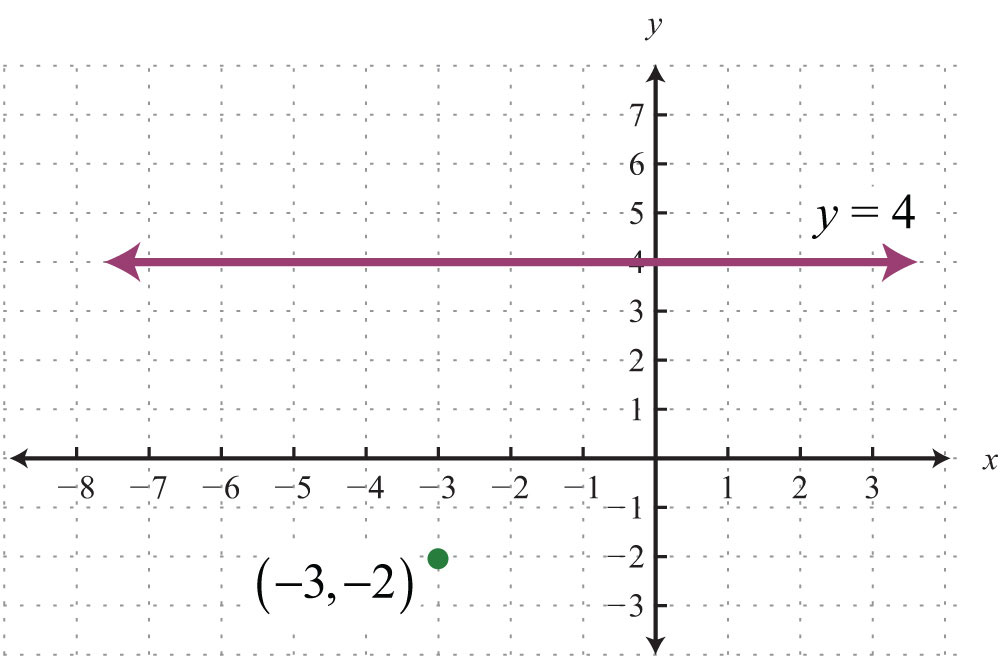
Example 7: Find the equation of the line passing through (−3, −2) and perpendicular to .
Solution: We recognize that is a horizontal line and we want to find a perpendicular line passing through (−3, −2).
If we draw the line perpendicular to the given horizontal line, the result is a vertical line.
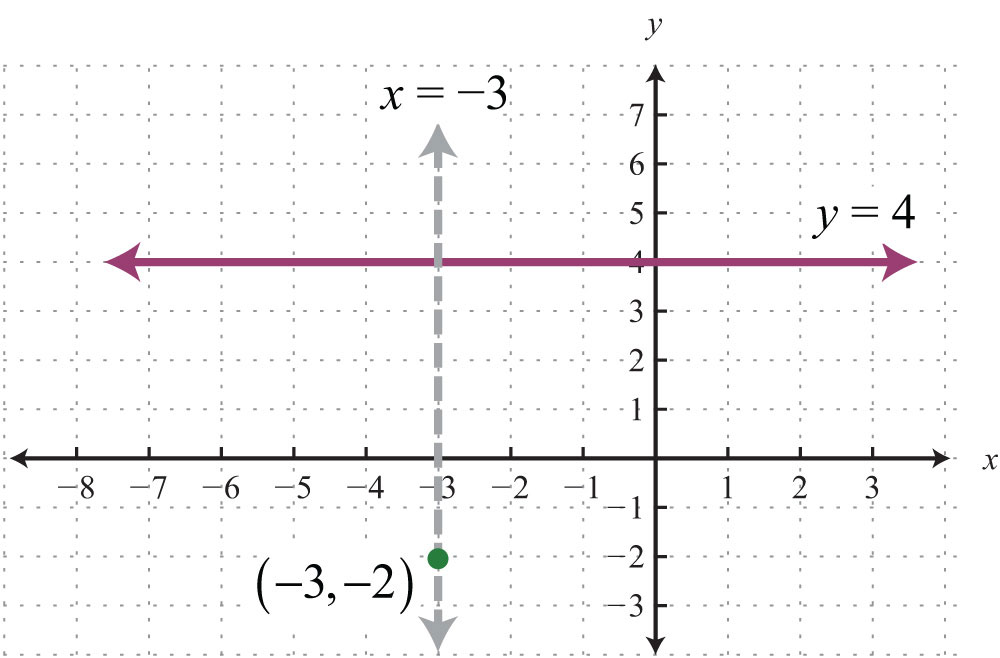
Equations of vertical lines look like . Since it must pass through (−3, −2), we conclude that is the equation. All ordered pair solutions of a vertical line must share the same x-coordinate.
Answer:
We can rewrite the equation of any horizontal line, , in slope-intercept form as follows:

Written in this form, we see that the slope is . If we try to find the slope of a perpendicular line by finding the opposite reciprocal, we run into a problem: , which is undefined. This is why we took care to restrict the definition to two nonvertical lines. Remember that horizontal lines are perpendicular to vertical lines.
Key Takeaways
- Parallel lines have the same slope.
- Perpendicular lines have slopes that are opposite reciprocals. In other words, if , then .
- To find an equation of a line, first use the given information to determine the slope. Then use the slope and a point on the line to find the equation using point-slope form.
- Horizontal and vertical lines are perpendicular to each other.
Topic Exercises
Part A: Parallel and Perpendicular Lines
Determine the slope of parallel lines and perpendicular lines.
1.
2.
3.
4.
5.
6.
7.
8.
9.
10.
11.
12.
13.
14.
15.
16.
17.
18.
19.
20.
Determine if the lines are parallel, perpendicular, or neither.
21.
22.
23.
24.
25.
26.
27.
28.
29.
30.
31.
32.
33.
34.
35.
36.
Part B: Equations in Point-Slope Form
Find the equation of the line.
37. Parallel to and passing through (6, −1).
38. Parallel to and passing through (−8, 2).
39. Perpendicular to and passing through (−3, 2).
40. Perpendicular to and passing through (4, −3).
41. Perpendicular to and passing through (−1, 5).
42. Perpendicular to and passing through (5, −3).
43. Parallel to and passing through (2, 4).
44. Parallel to and passing through (7, −3).
45. Perpendicular to and passing through (7, −13).
46. Perpendicular to and passing through (3, −1).
47. Parallel to and passing through (−2, 1).
48. Parallel to and passing through (4, 1/4).
49. Parallel to and passing through (6, −2).
50. Parallel to and passing through (9, 7).
51. Perpendicular to and passing through (−9, 10).
52. Perpendicular to and passing through (6, −8).
53. Parallel to and passing through (−15, 6).
54. Parallel to and passing through (−1, 1/2).
55. Perpendicular to and passing through (−10, 3).
56. Perpendicular to and passing through (−4, 0).
57. Parallel to and passing through (−1, −2).
58. Parallel to and passing through (2, −3).
59. Perpendicular to and passing through (8, −2).
60. Perpendicular to and passing through (−1, −1).
61. Parallel to and passing through .
62. Parallel to and passing through .
63. Perpendicular to and passing through (−6, 12).
64. Perpendicular to and passing through (5, −10).
Answers
1: and
3: and
5: and
7: and
9: and undefined
11: and
13: and
15: and
17: and
19: and
21: Parallel
23: Perpendicular
25: Perpendicular
27: Perpendicular
29: Parallel
31: Neither
33: Parallel
35: Parallel
37:
39:
41:
43:
45:
47:
49:
51:
53:
55:
57:
59:
61:
63:
3.7 Introduction to Functions
Learning Objectives
- Identify a function.
- State the domain and range of a function.
- Use function notation.
Relations, Functions, Domain, and Range
Relationships between sets occur often in everyday life. For example, for each month in Cape Canaveral, we can associate an average amount of rainfall. In this case, the amount of precipitation depends on the month of the year, and the data can be written in tabular form or as a set of ordered pairs.
| Month | Precipitation | Ordered pairs |
|---|---|---|
| January | 2.4 in | (January, 2.4) |
| February | 3.3 in | (February, 3.3) |
| March | 3.1 in | (March, 3.1) |
| April | 2.0 in | (April, 2.0) |
| May | 3.8 in | (May, 3.8) |
| June | 6.8 in | (June, 6.8) |
| July | 8.1 in | (July, 8.1) |
| August | 7.6 in | (August, 7.6) |
| September | 7.3 in | (September, 7.3) |
| October | 4.1 in | (October, 4.1) |
| November | 3.3 in | (November, 3.3) |
| December | 2.4 in | (December, 2.4) |
We define a relationAny set of ordered pairs. as any set of ordered pairs. Usually we write the independent component of the relation in the first column and the dependent component in the second column. In the opening example, notice that it makes sense to relate the average amount of precipitation as dependent on the month of year. The set of all elements in the first column of a relation is called the domainThe set of first components of a relation. The x-values define the domain in relations consisting of points (x, y) in the rectangular coordinate plane.. The set of all elements that compose the second column is called the rangeThe set of second components of a relation. The y-values define the range in relations consisting of points (x, y) in the rectangular coordinate plane.. In this example, the domain consists of the set of all months of the year, and the range consists of the values that represent the average rainfall for each month.
In the context of algebra, the relations of interest are sets of ordered pairs (x, y) in the rectangular coordinate plane. In this case, the x-values define the domain and the y-values define the range. Of special interest are relations where every x-value corresponds to exactly one y-value; these relations are called functionsRelations where every x-value corresponds to exactly one y-value. With the definition comes new notation: , which is read “f of x is equal to y.”.
Example 1: Determine the domain and range of the following relation and state whether or not it is a function: {(−1, 4), (0, 7), (2, 3), (3, 3), (4, −2)}.
Solution: Here we separate the domain and range and depict the correspondence between the values with arrows.
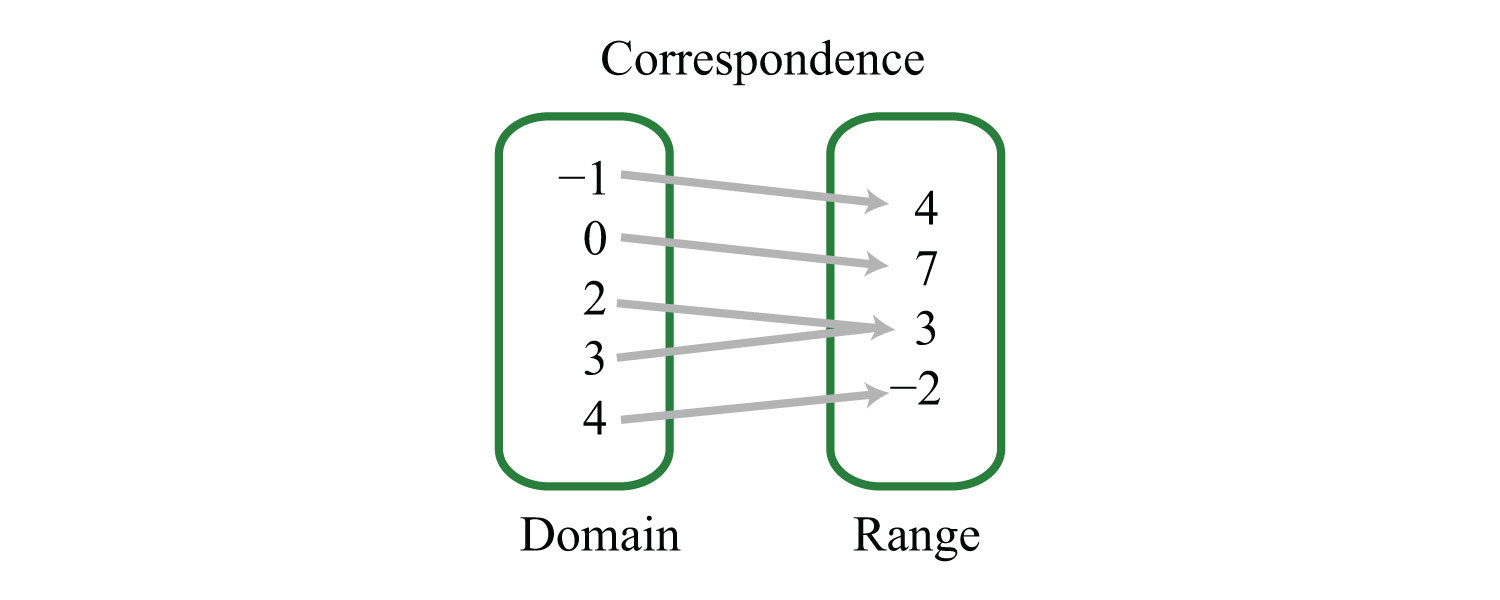
Answer: The domain is {−1, 0, 2, 3, 4}, and the range is {−2, 3, 4, 7}. The relation is a function because each x-value corresponds to exactly one y-value.
Example 2: Determine the domain and range of the following relation and state whether or not it is a function: {(−4, −3), (−2, 6), (0, 3), (3, 5), (3, 7)}.
Solution:
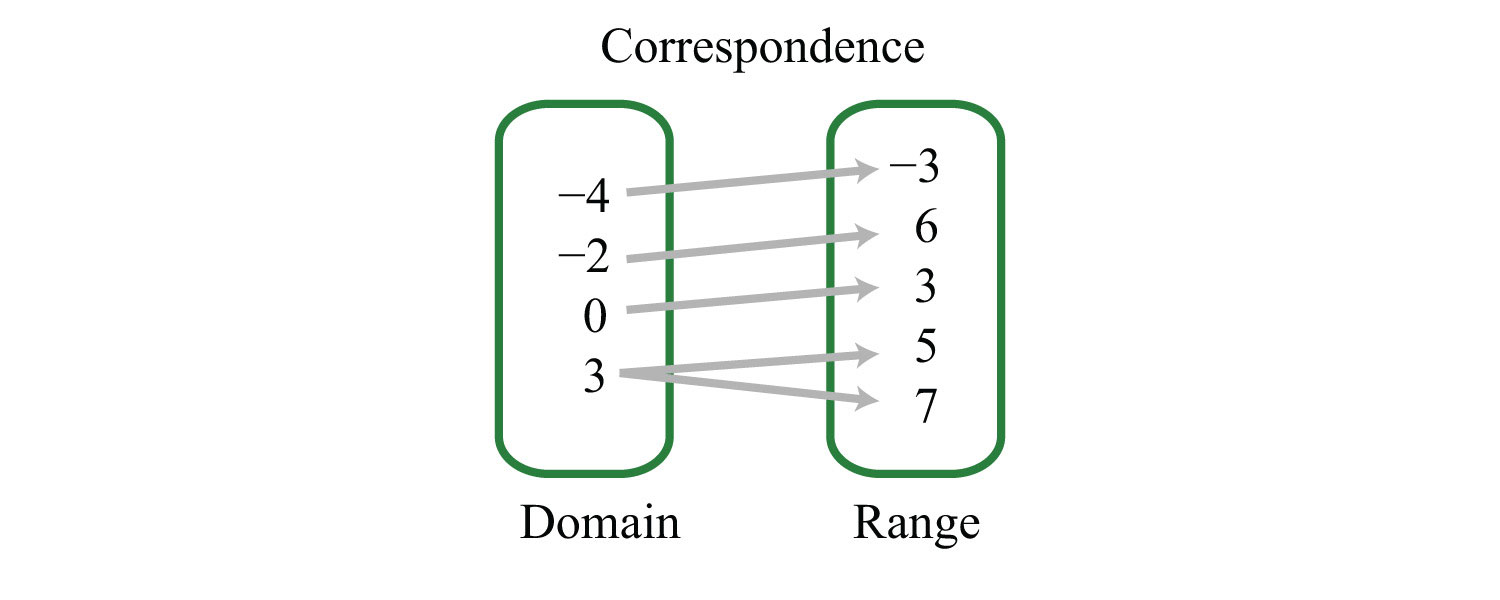
Answer: The domain is {−4, −2, 0, 3}, and the range is {−3, 3, 5, 6, 7}. This relation is not a function because the x-value 3 has two corresponding y-values.
In the previous example, the relation is not a function because it contains ordered pairs with the same x-value, (3, 5) and (3, 7). We can recognize functions as relations where no x-values are repeated.
In algebra, equations such as define relations. This linear equation can be graphed as follows:
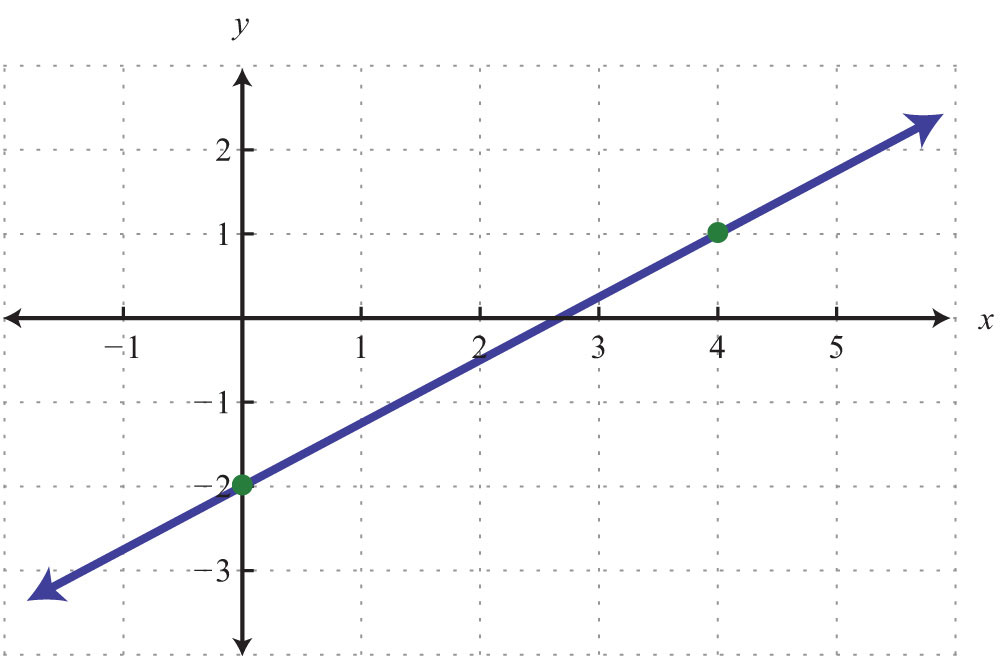
The graph is a relation since it represents the infinite set of ordered pair solutions to . The domain is the set of all x-values, and in this case consists of all real numbers. The range is the set of all possible y-values, and in this case also consists of all real numbers. Furthermore, the graph is a function because for each x-value there is only one corresponding y-value. In fact, any nonvertical or nonhorizontal line is a function with domain and range consisting of all real numbers.
Any graph is a set of ordered pairs and thus defines a relation. Consider the following graph of a circle:
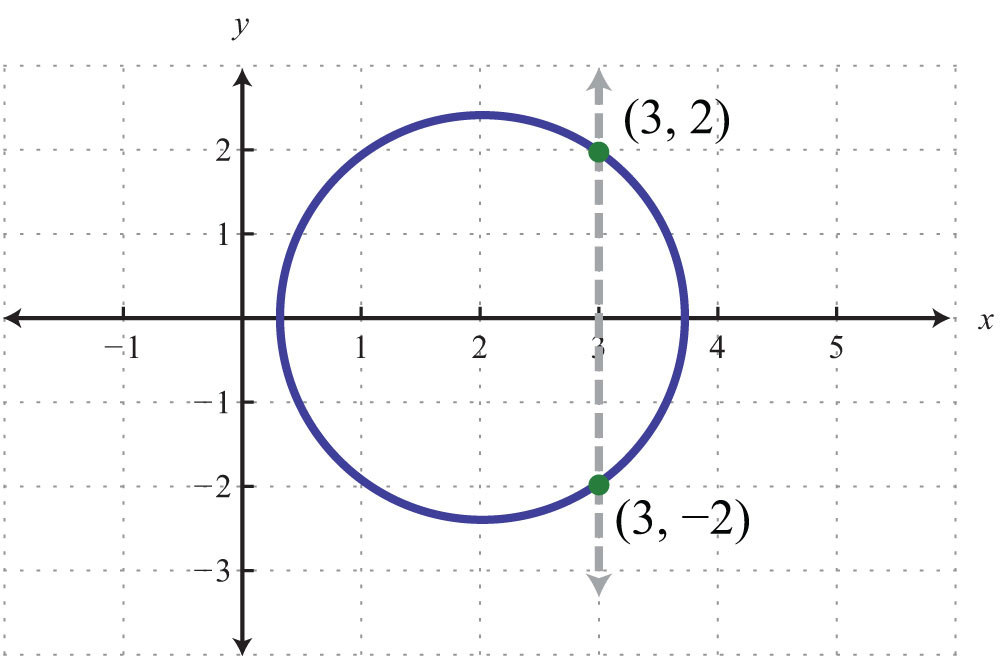
Here the graph represents a relation where many x-values in the domain correspond to two y-values. If we draw a vertical line, as illustrated, we can see that (3, 2) and (3, −2) are two ordered pairs with the same x-value. Therefore, the x-value 3 corresponds to two y-values; hence the graph does not represent a function. The illustration suggests that if any vertical line intersects a graph more than once, then the graph does not represent a function. This is called the vertical line testIf a vertical line intersects a graph more than once, then the graph does not represent a function..
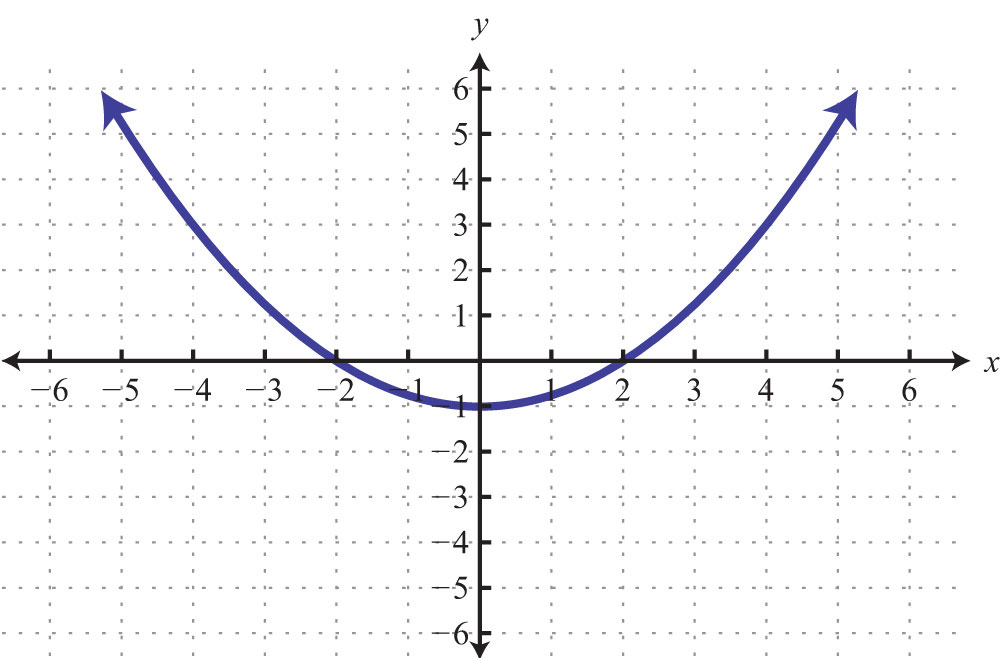
Example 3: Given the following graph, determine the domain and range and state whether or not it is a function.
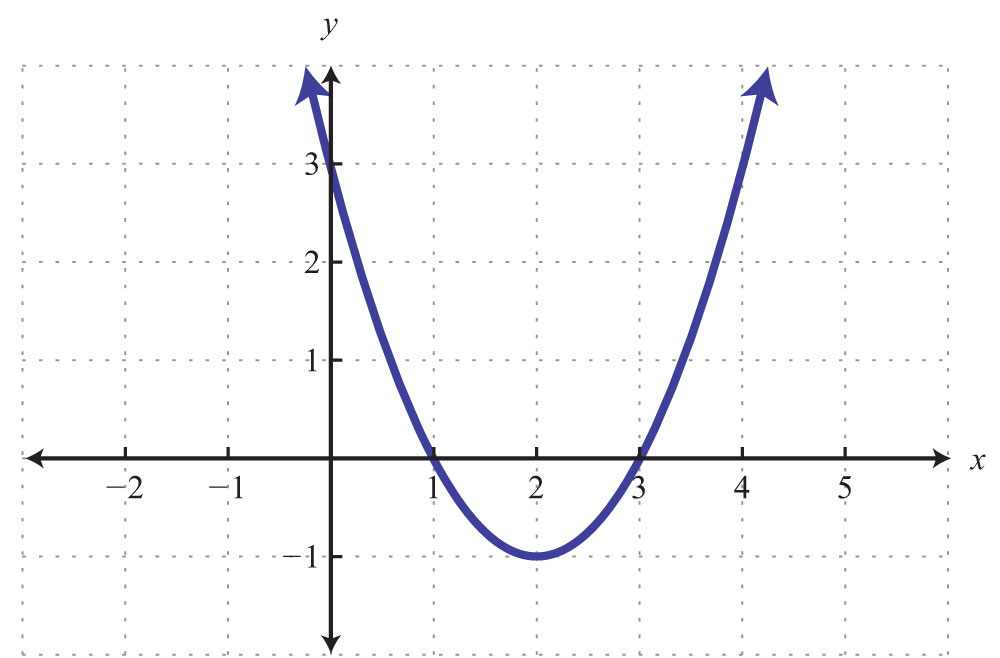
Solution: The given shape is called a parabola and extends indefinitely to the left and right as indicated by the arrows. This suggests that if we choose any x-value, then we will be able to find a corresponding point on the graph; therefore, the domain consists of all real numbers. Furthermore, the graph shows that −1 is the minimum y-value, and any y-value greater than that is represented in the relation. Hence the range consists of all y-values greater than or equal to −1, or in interval notation, .
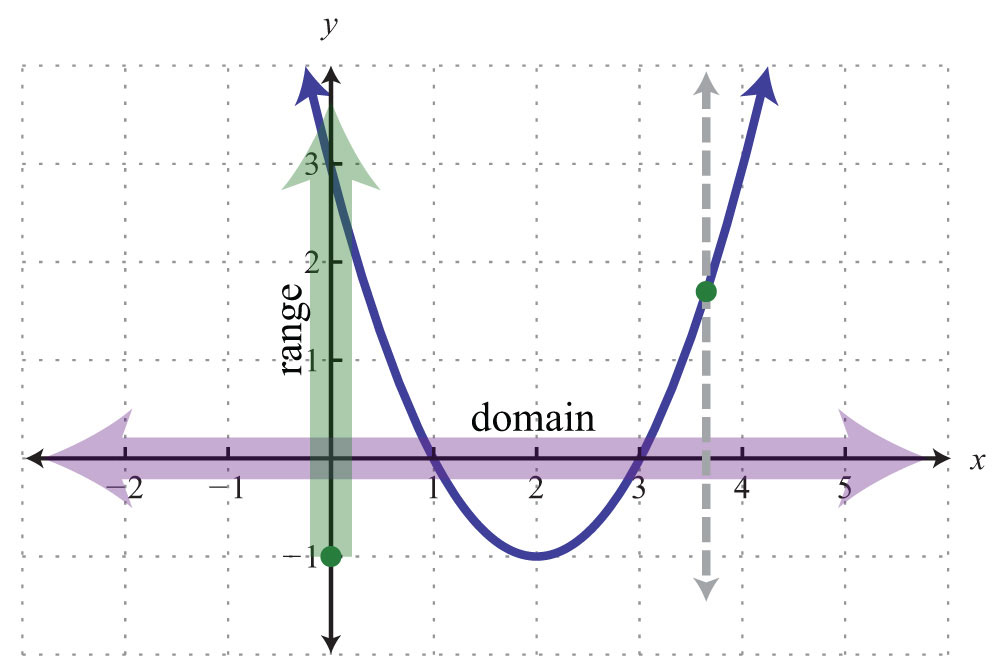
Lastly, any vertical line will intersect the graph only once; therefore, it is a function.
Answer: The domain is all real numbers R = (−∞, ∞), and the range is . The graph represents a function because it passes the vertical line test.
Try this! Given the graph, determine the domain and range and state whether or not it is a function:
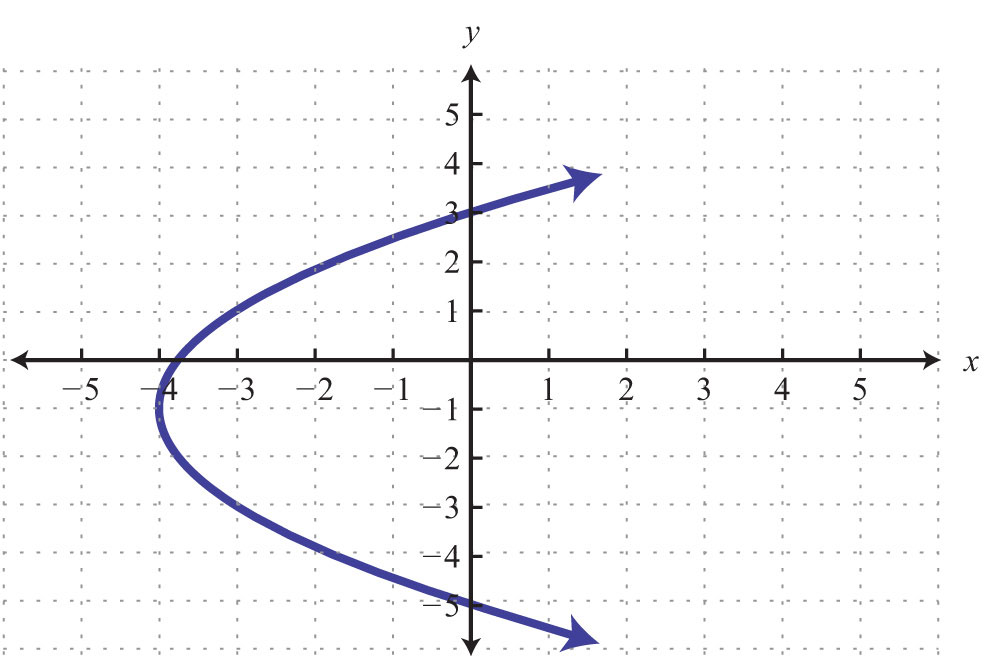
Answer: Domain: ; range: ; function: no
Video Solution
(click to see video)Function Notation and Linear Functions
With the definition of a function comes special notation. If we consider each x-value to be the input that produces exactly one output, then we can use the notation

The notation reads “f of x” and should not be confused with multiplication. Most of our study of algebra involves functions, so the notation becomes very useful when performing common tasks. Functions can be named with different letters; some common names for functions are g(x), h(x), C(x), and R(x). First, consider nonvertical lines that we know can be expressed using slope-intercept form, . For any real numbers m and b, the equation defines a function, and we can replace y with the new notation as follows:

Therefore, a linear functionAny function that can be written in the form f(x) = mx + b. is any function that can be written in the form . In particular, we can write the following:

The notation also shows values to evaluate in the equation. If the value for x is given as 8, then we know that we can find the corresponding y-value by substituting 8 in for x and simplifying. Using function notation, this is denoted and can be interpreted as follows:

Finally, simplify:

We have . This notation tells us that when x = 8 (the input), the function results in 4 (the output).
Example 4: Given the linear function , find .
Solution: In this case, indicates that we should evaluate when .
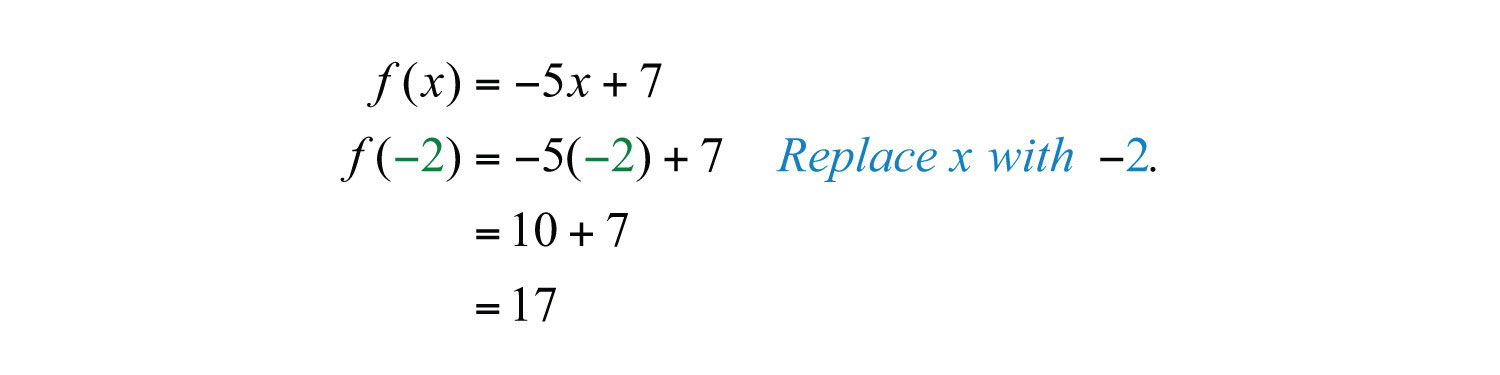
Answer:
Example 5: Given the linear function , find x when .
Solution: In this case, indicates that the function should be set equal to 10.
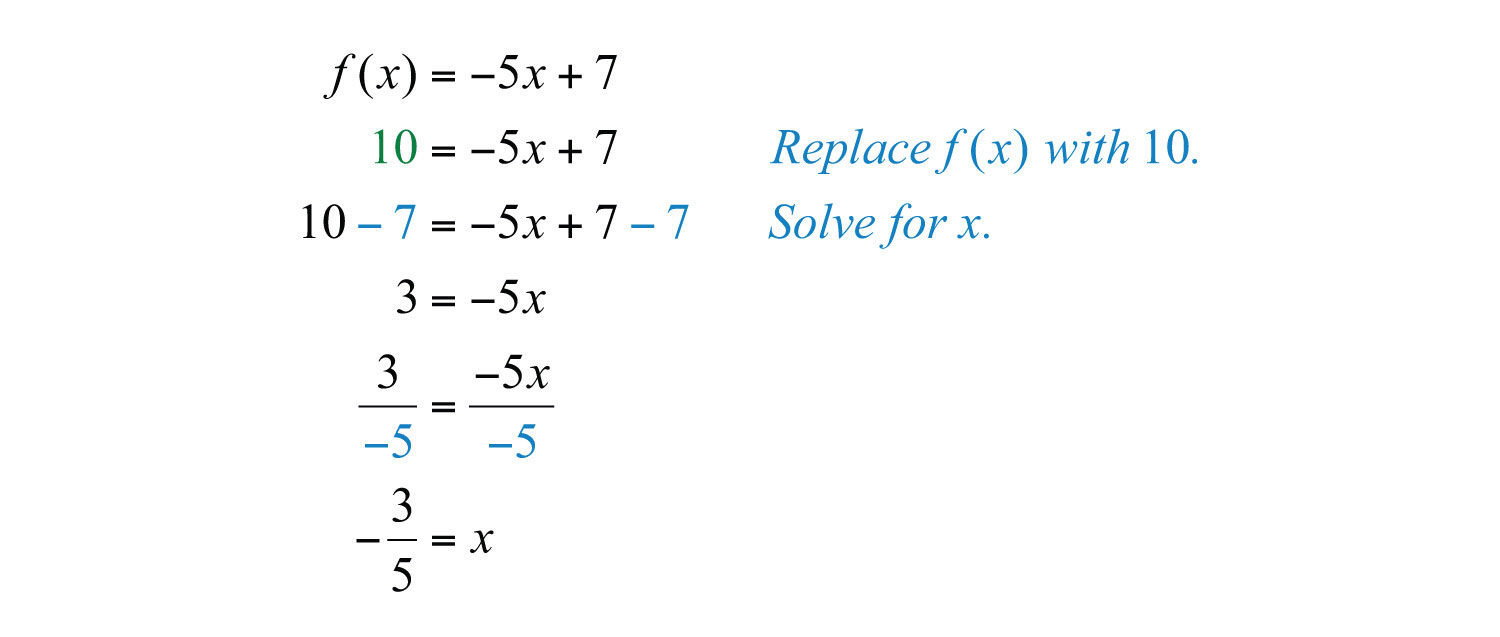
Answer: Here , and we can write .
Example 6: Given the graph of a linear function ,
a. Find .
b. Find x when .
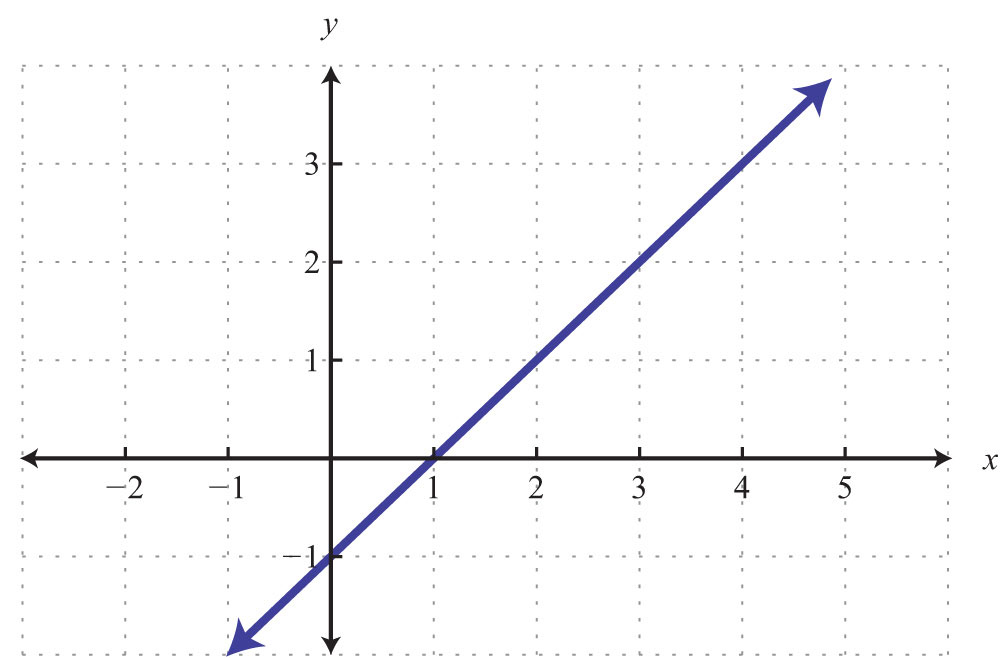
Solution:
a. The notation implies that x = 2. Use the graph to determine the corresponding y-value.
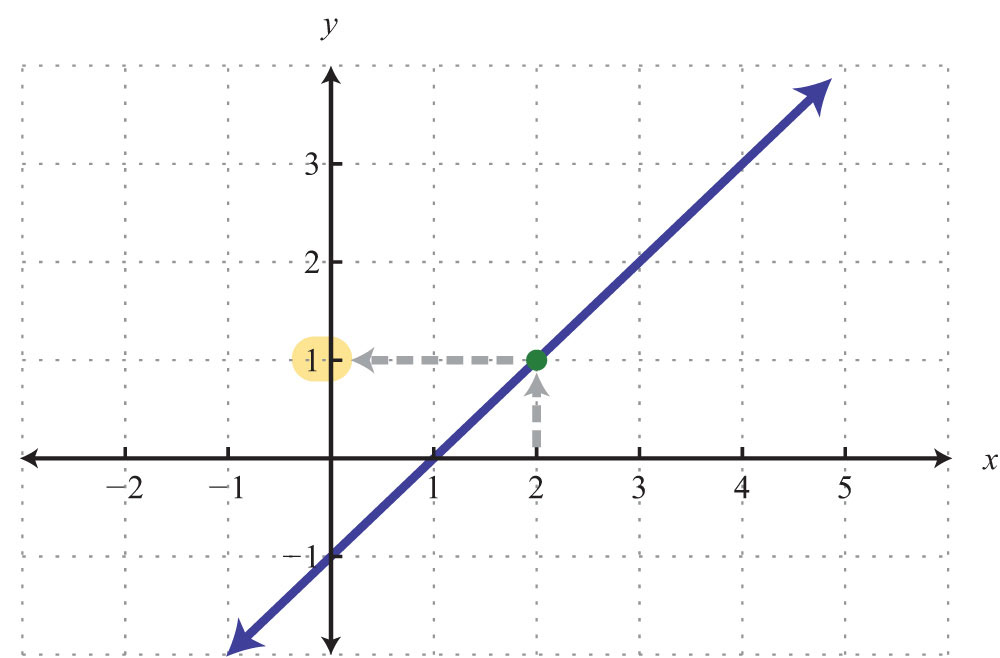
Answer:
b. The notation implies that the y-value is given as 3. Use the graph to determine the corresponding x-value.
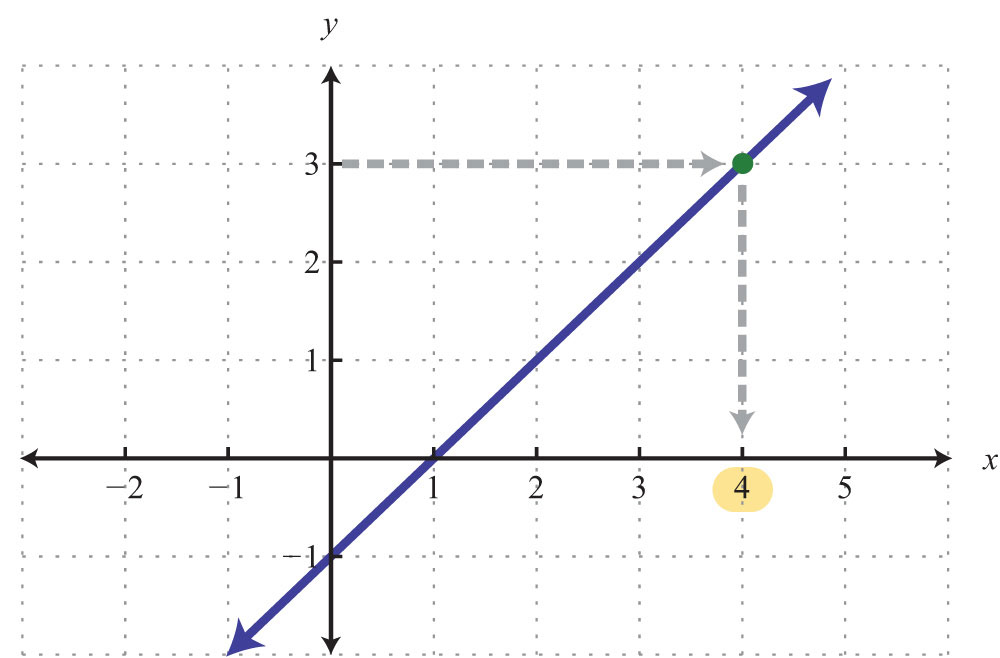
Answer: x = 4
Example 7: Graph the linear function and state the domain and range.
Solution: From the function, we see that b = 6 and thus the y-intercept is (0, 6). Also, we can see that the slope is . Starting from the y-intercept, mark a second point down 5 units and right 3 units.
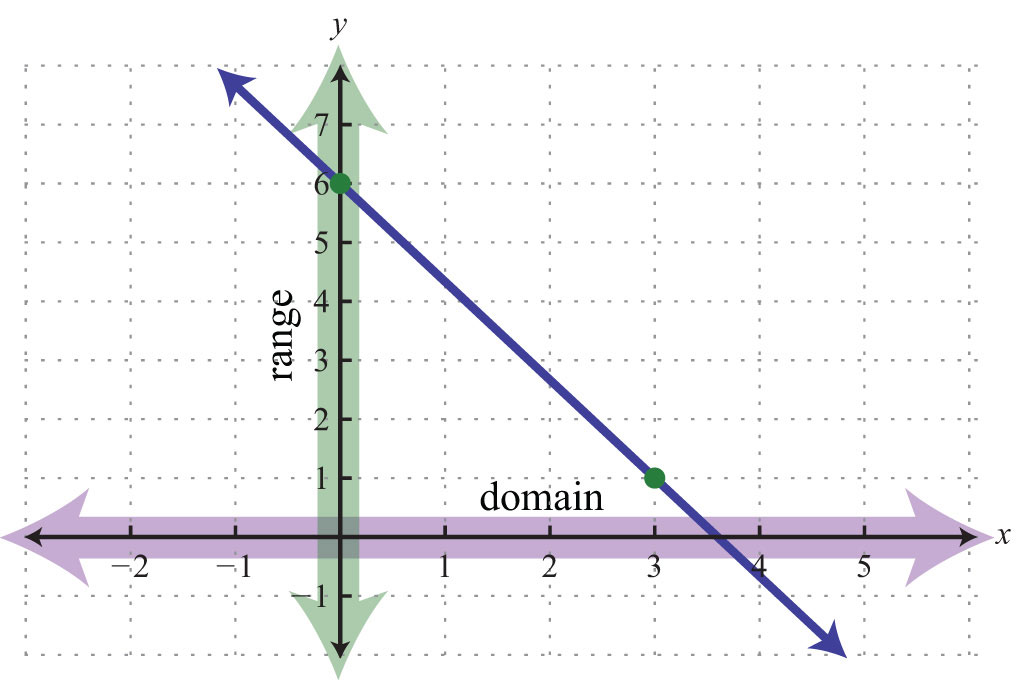
Given any coordinate on the x-axis, we can find a corresponding point on the graph; the domain consists of all real numbers. Also, for any coordinate on the y-axis, we can find a point on the graph; the range consists of all real numbers.
Answer: Both the domain and range consist of all real numbers R.
Try this! Given the linear function ,
a. Find .
b. Find x when .
Answers:
a.
b.
Video Solution
(click to see video)Key Takeaways
- A relation is any set of ordered pairs. However, in the context of this course, we will be working with sets of ordered pairs (x, y) in the rectangular coordinate system. The set of x-values defines the domain and the set of y-values defines the range.
- Special relations where every x-value (input) corresponds to exactly one y-value (output) are called functions.
- We can easily determine whether an equation represents a function by performing the vertical line test on its graph. If any vertical line intersects the graph more than once, then the graph does not represent a function. In this case, there will be more than one point with the same x-value.
-
Any nonvertical or nonhorizontal line is a function and can be written using function notation . Both the domain and range consist of all real numbers.
- If asked to find , we substitute a in for the variable and then simplify.
- If asked to find when , we set the function equal to and then solve for .
Topic Exercises
Part A: Functions
For each problem below, does the correspondence represent a function?
1. Algebra students to their scores on the first exam.
2. Family members to their ages.
3. Lab computers to their users.
4. Students to the schools they have attended.
5. People to their citizenships.
6. Local businesses to their number of employees.
Determine the domain and range and state whether the relation is a function or not.
7. {(3, 2), (5, 3), (7, 4)}
8. {(−5, −3), (0, 0), (5, 0)}
9. {(−10, 2), (−8, 1), (−8, 0)}
10. {(9, 12), (6, 6), (6, 3)}
11.
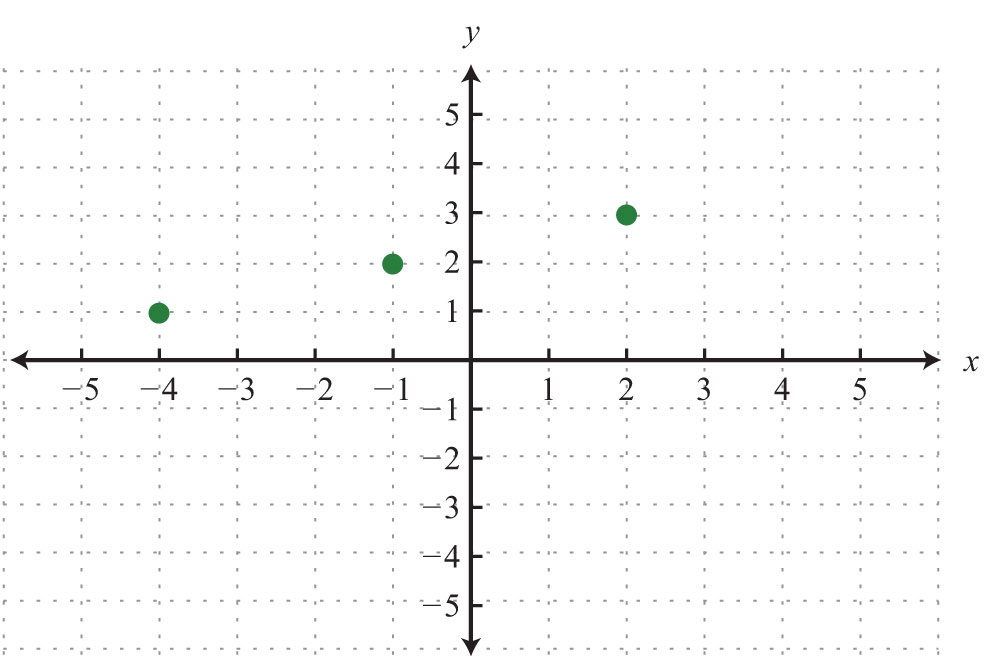
12.
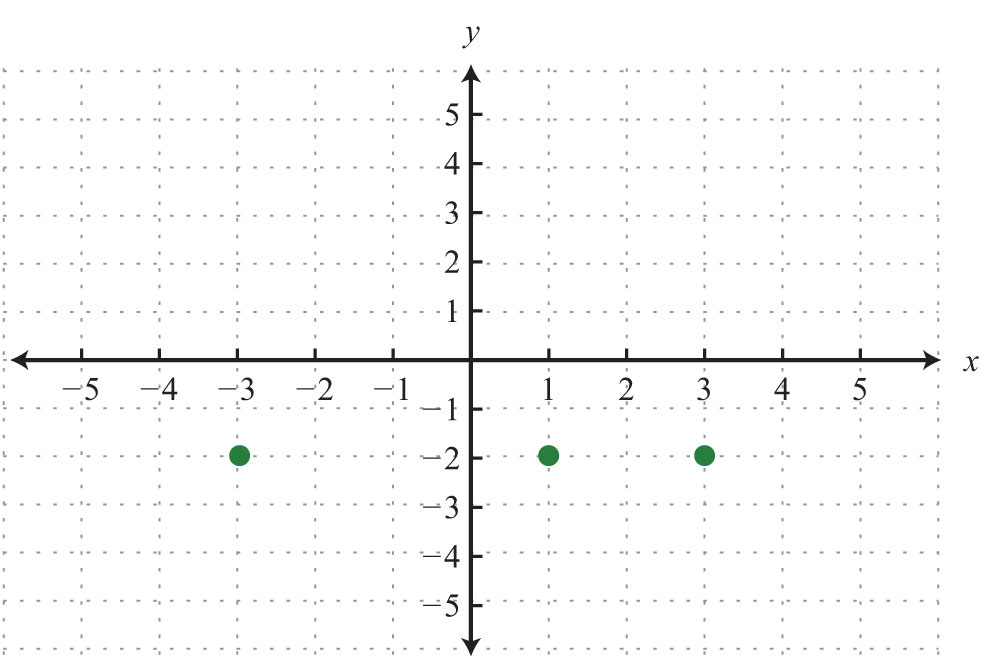
13.
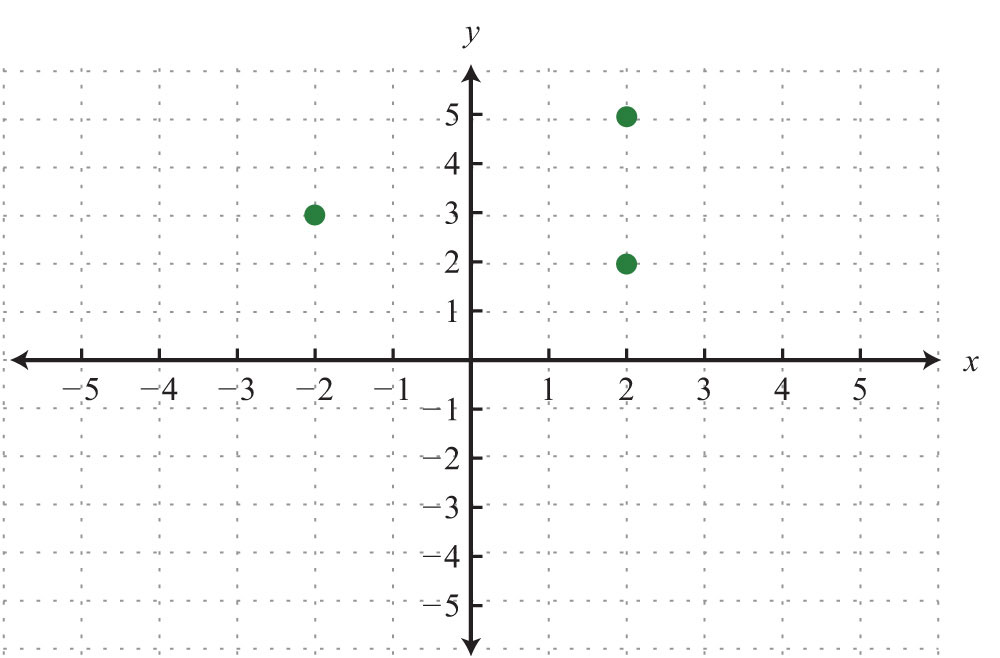
14.
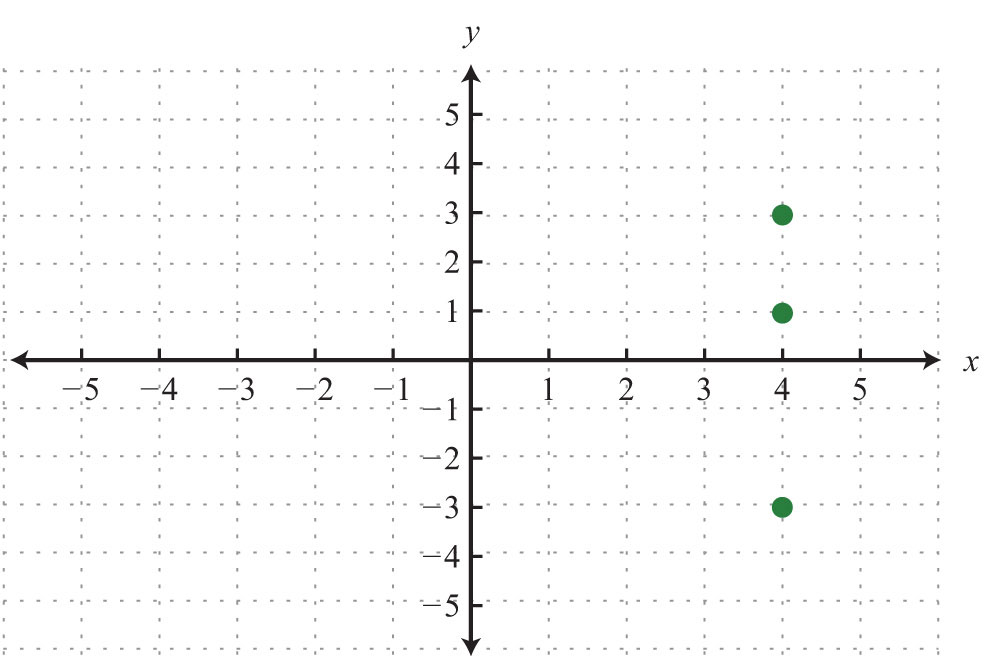
15.
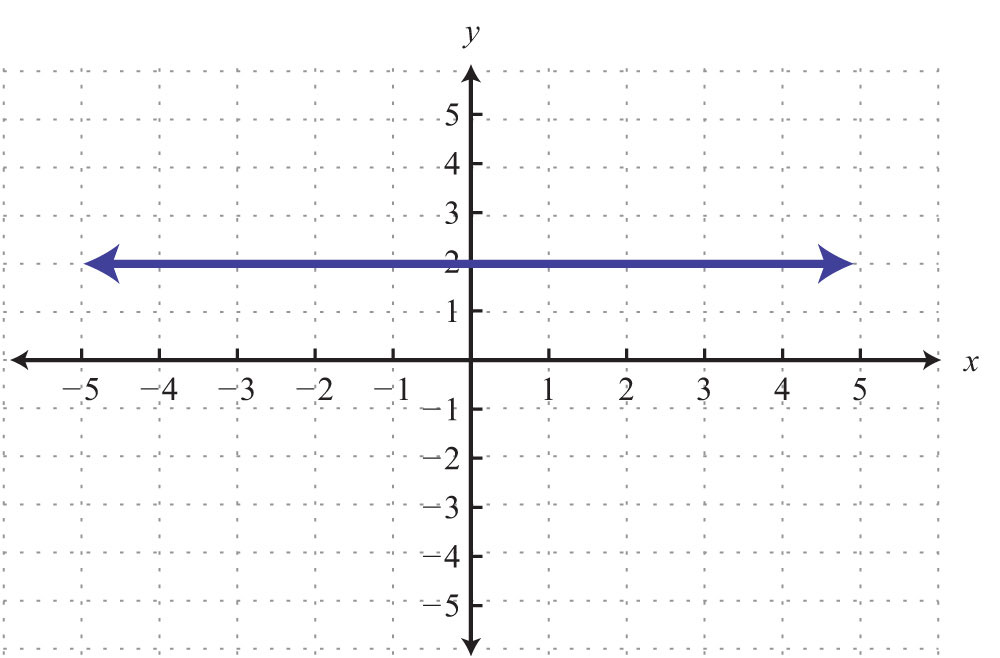
16.

17.
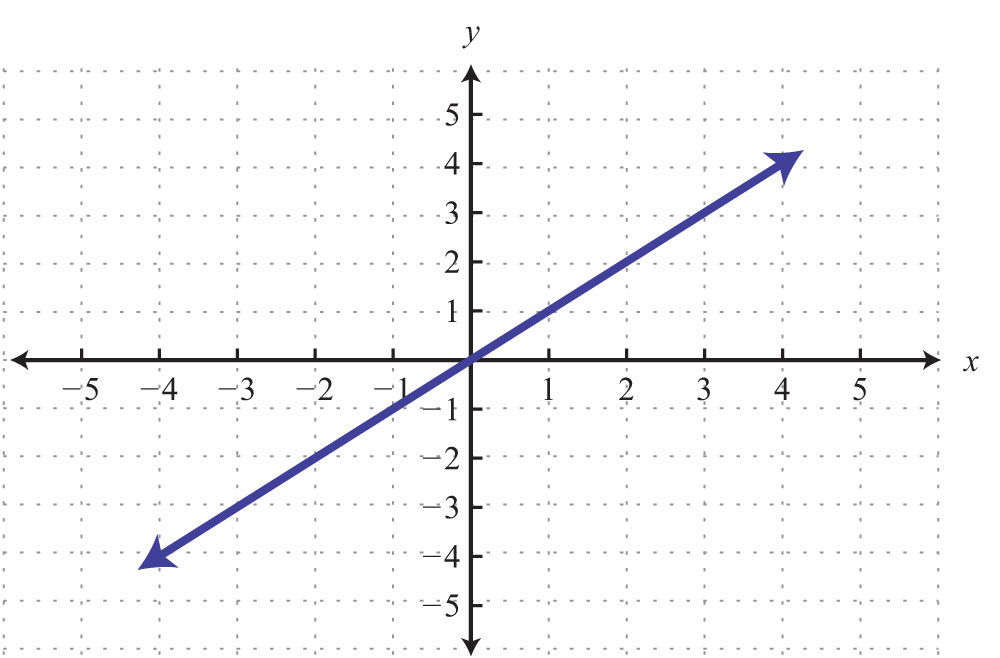
18.
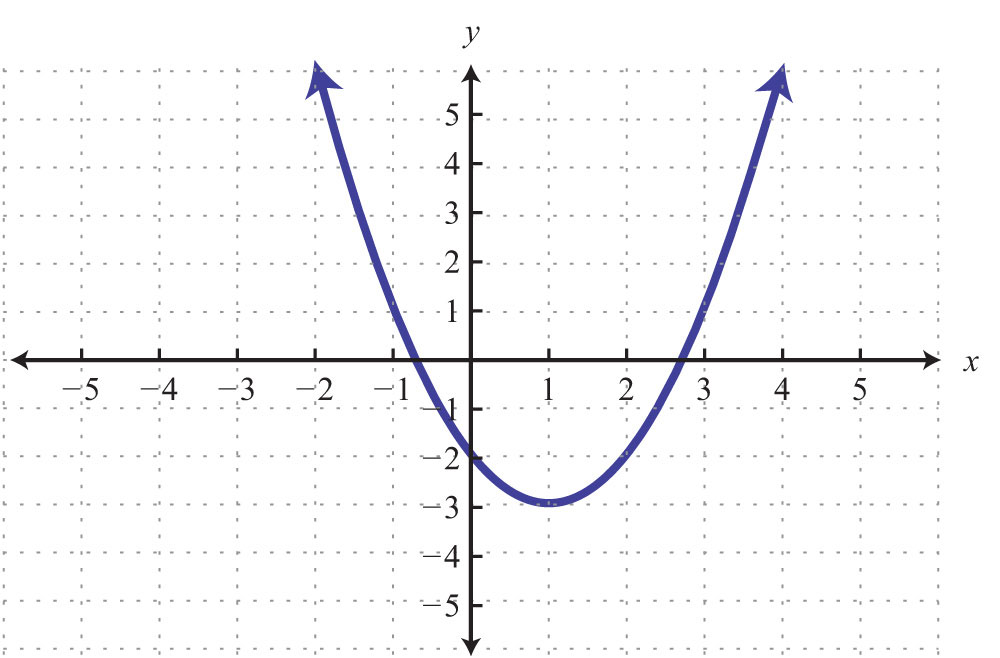
19.
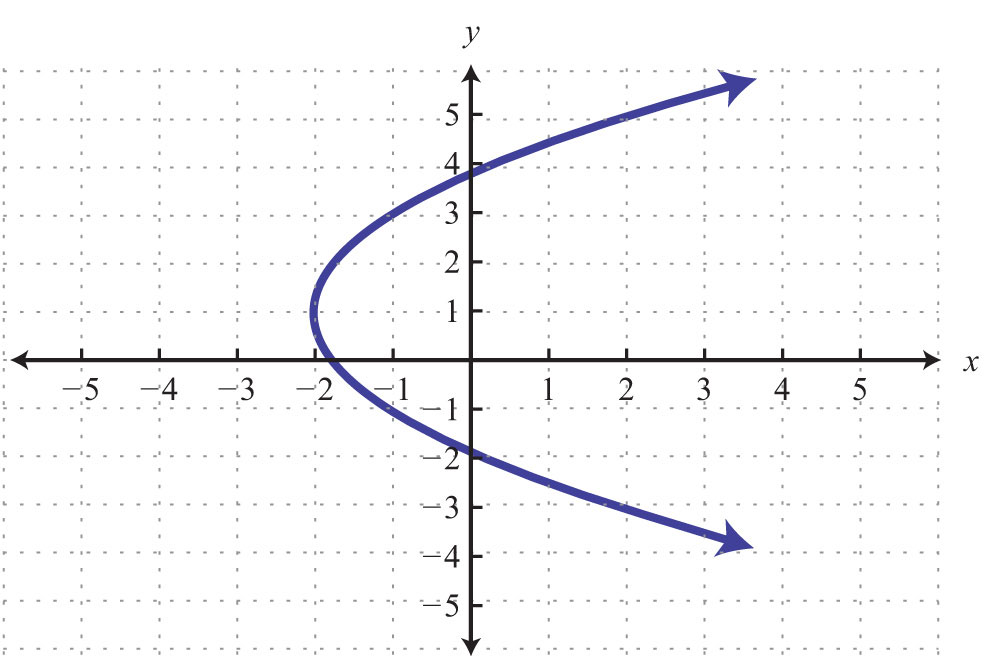
20.
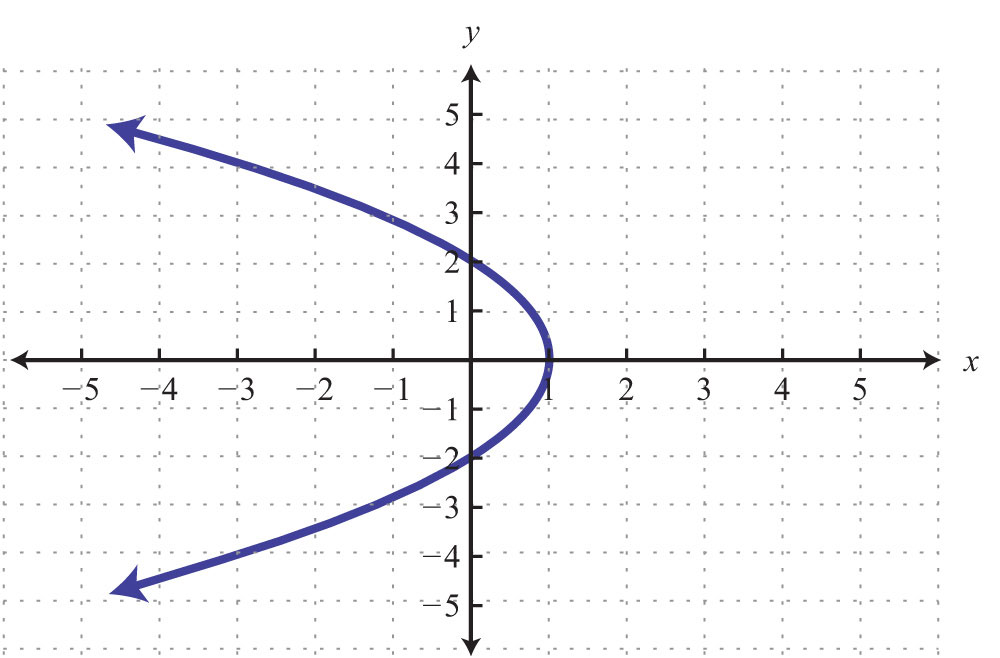
21.
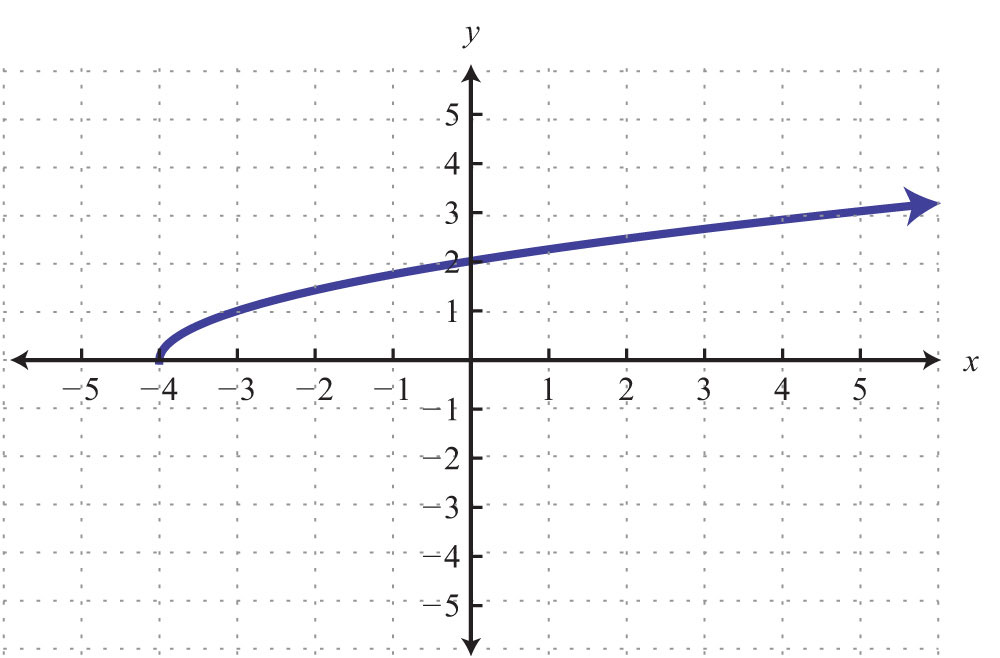
22.
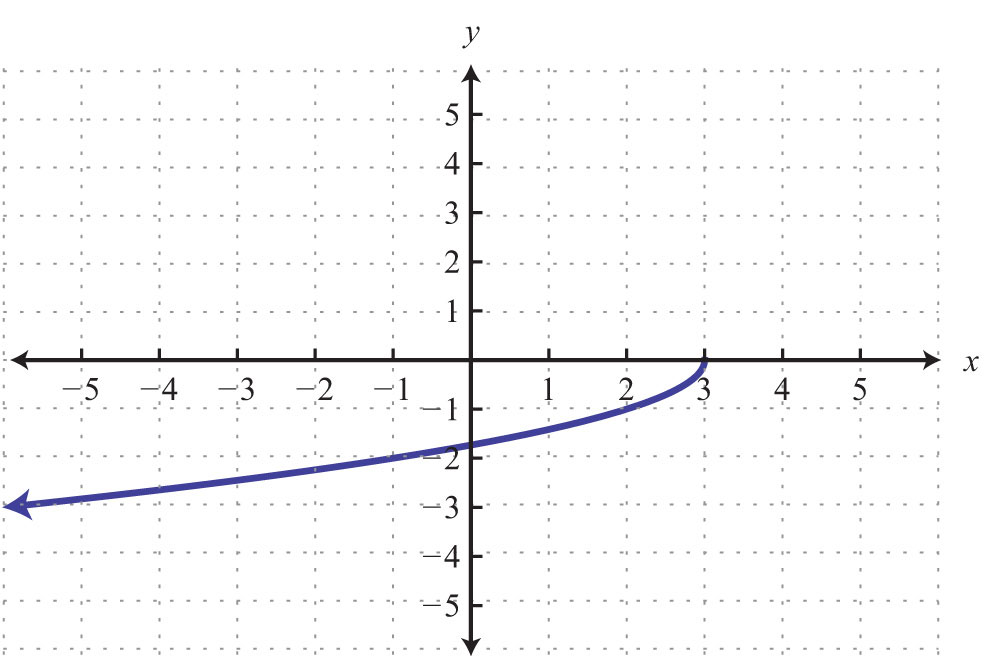
23.
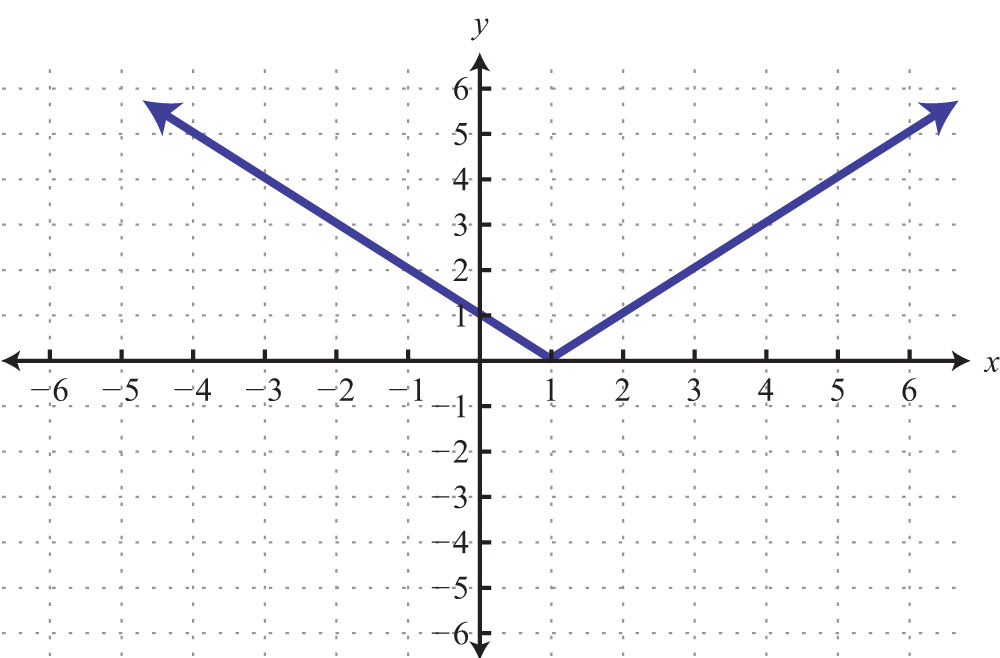
24.
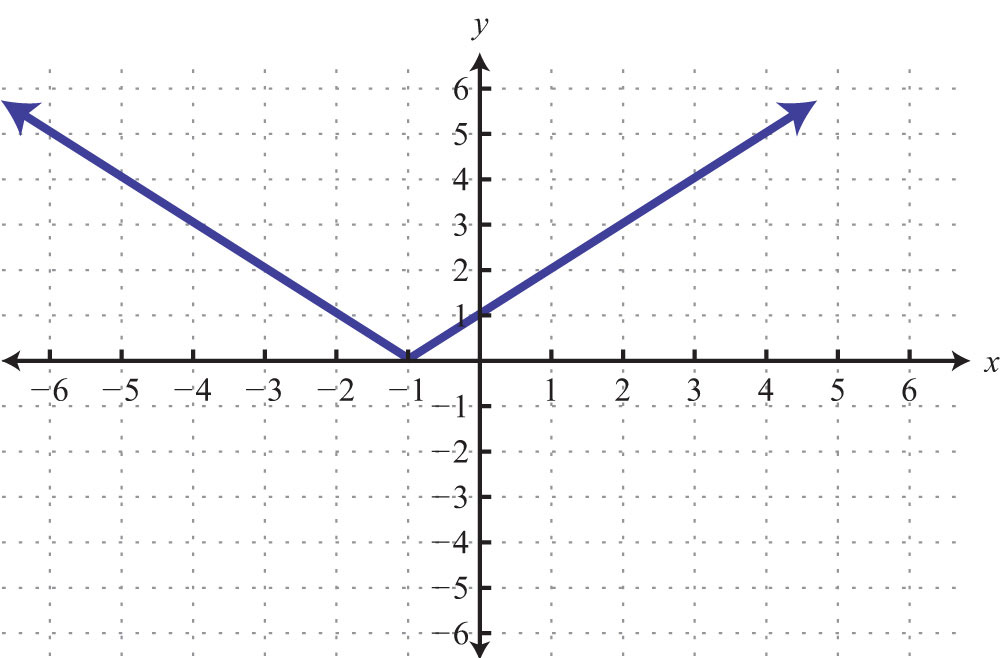
25.
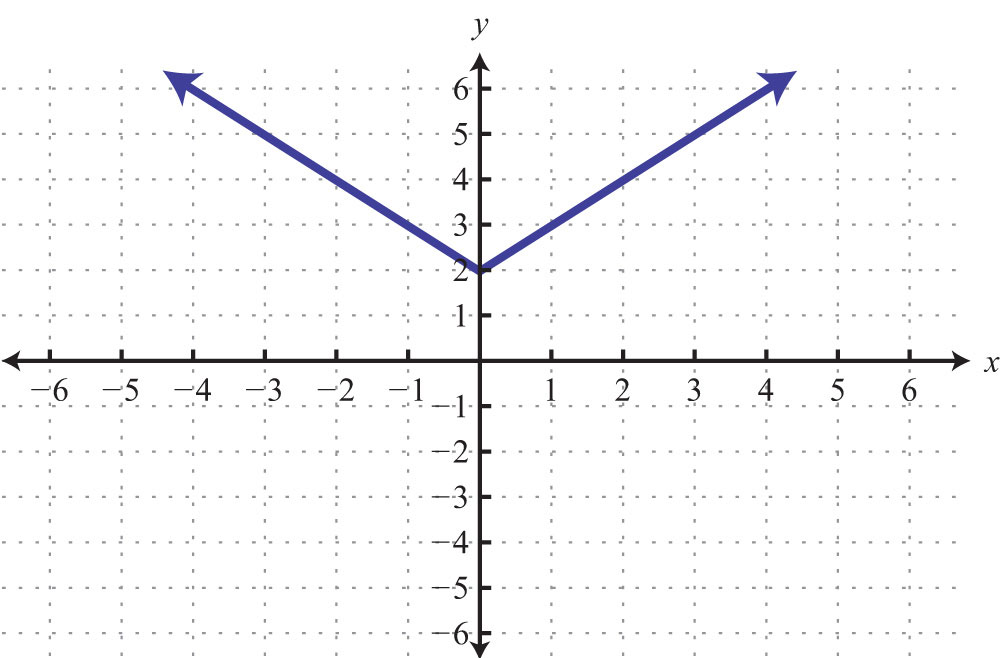
26.

Part B: Function Notation
Given the following functions, find the function values.
27. , find .
28. , find .
29. , find .
30. , find .
31. , find .
32. , find .
33. , find .
34. , find .
35. , find .
36. , find .
37. , find x when .
38. , find x when .
39. , find x when .
40. , find x when .
41. , find x when .
42. , find x when .
43. , find x when .
44. , find x when .
Given and calculate the following.
45.
46.
47.
48.
49.
50.
51.
52.
53. Find x when .
54. Find x when .
55. Find x when .
56. Find x when .
Given the graph, find the function values.
57. Given the graph of , find , , , and .
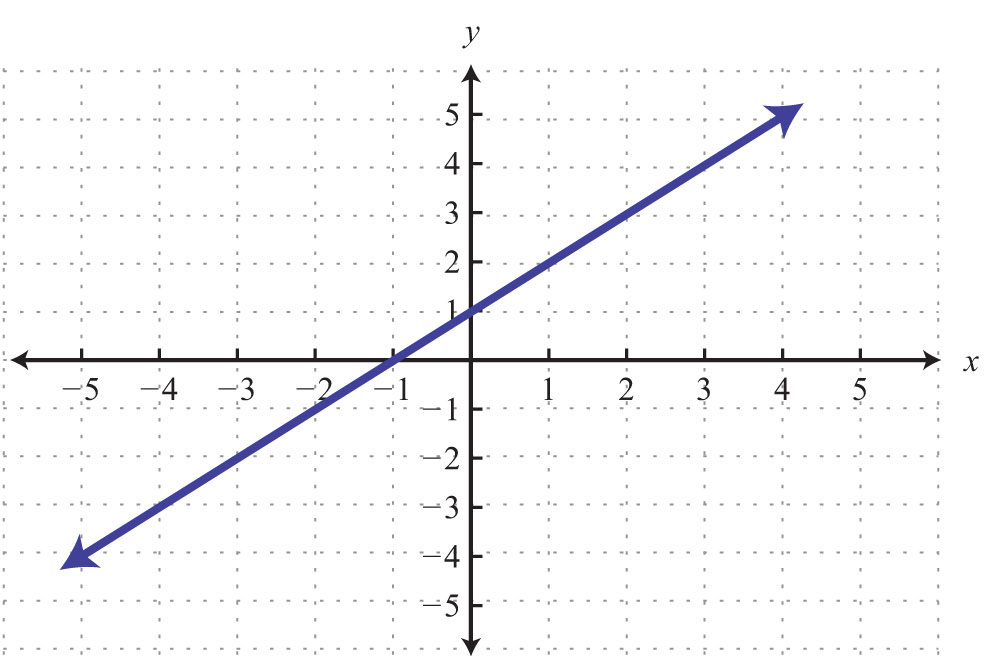
58. Given the graph of , find , , , and .
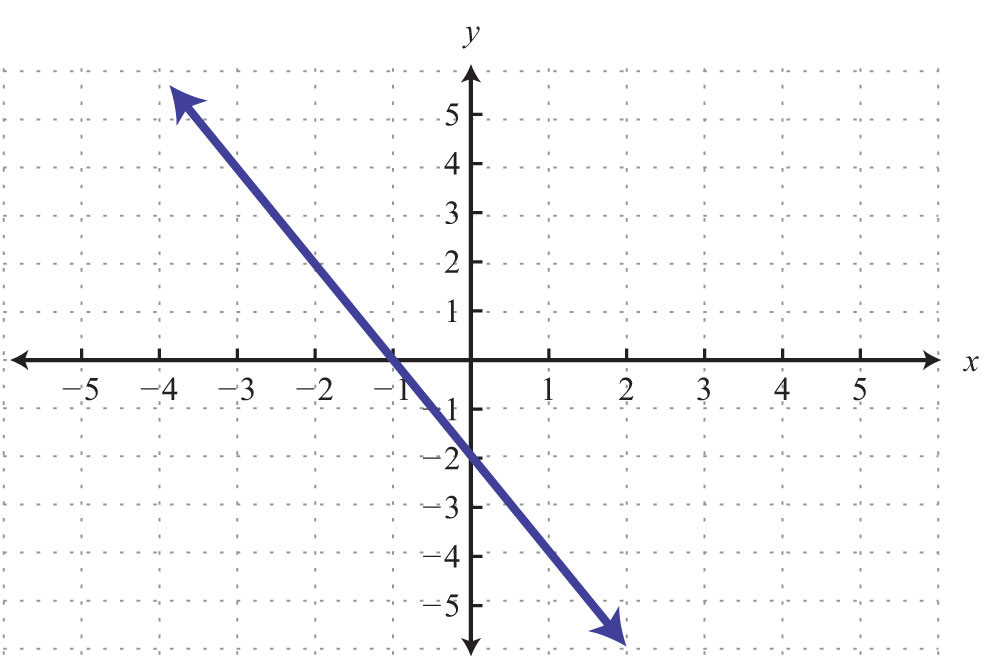
59. Given the graph of , find , , , and .
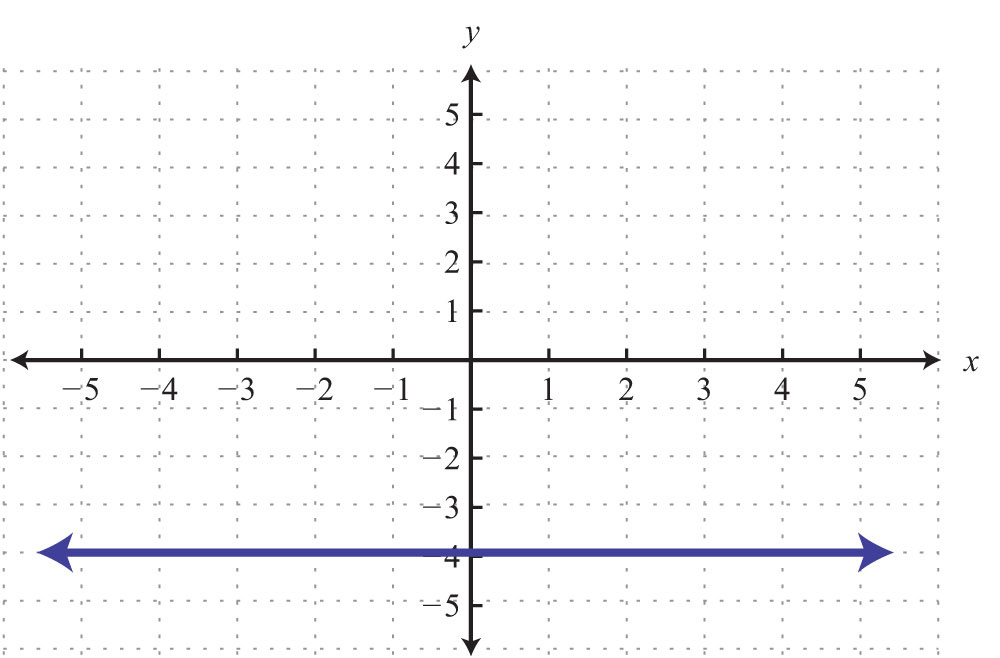
60. Given the graph of , find , , , and .
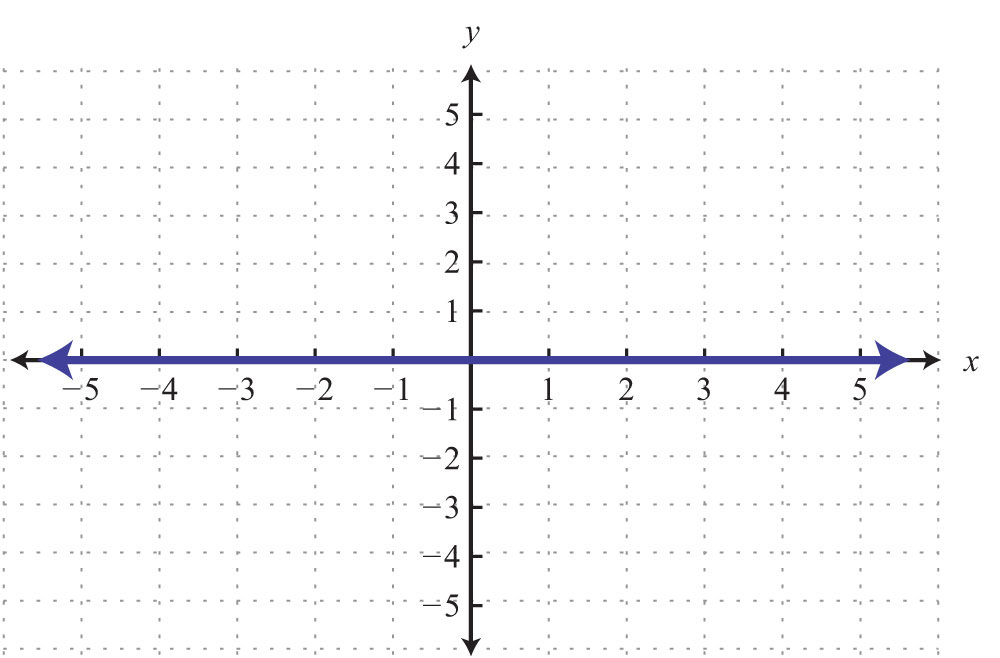
61. Given the graph of , find , , , and .
62. Given the graph of , find , , , and .
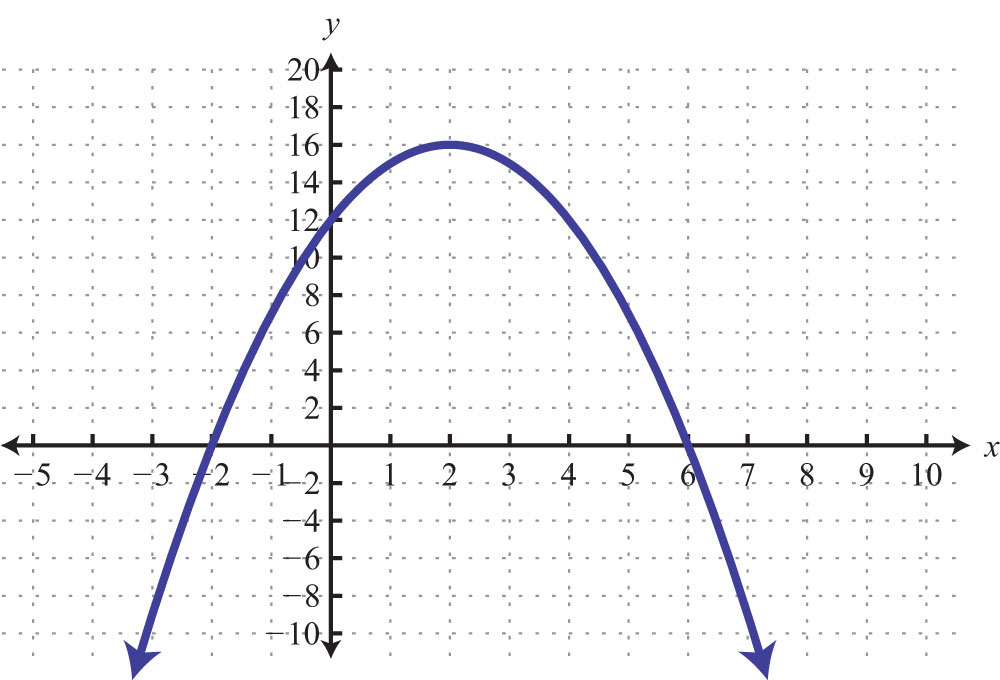
63. Given the graph of , find , , , and .
64. Given the graph of , find , , , and .
Given the graph, find the x-values.
65. Given the graph of , find x when , , and .
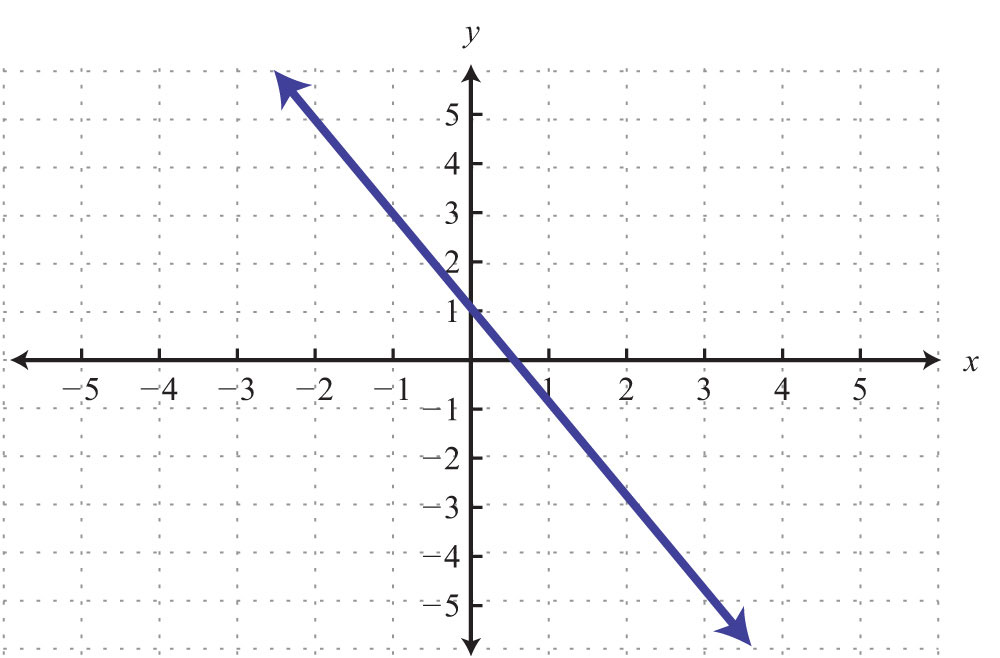
66. Given the graph of , find x when , , and .
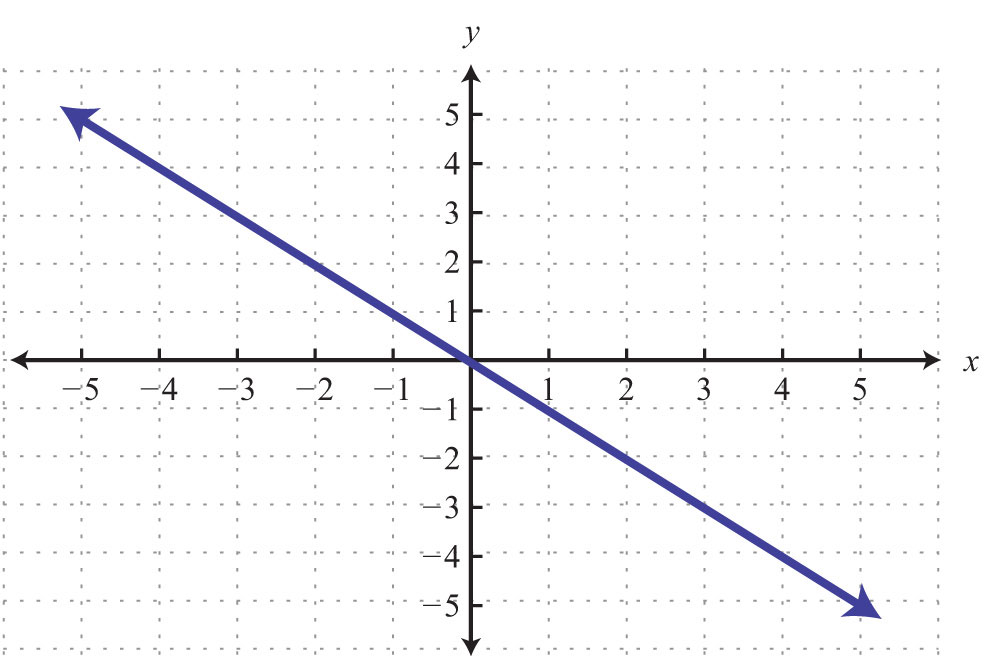
67. Given the graph of , find x when .
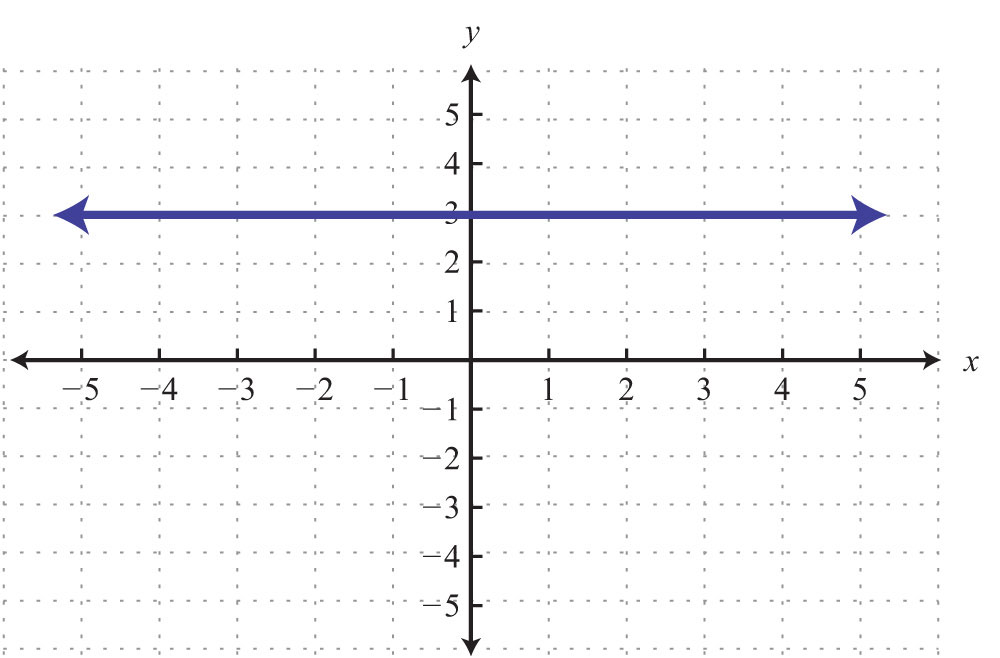
68. Given the graph of , find x when , , and .
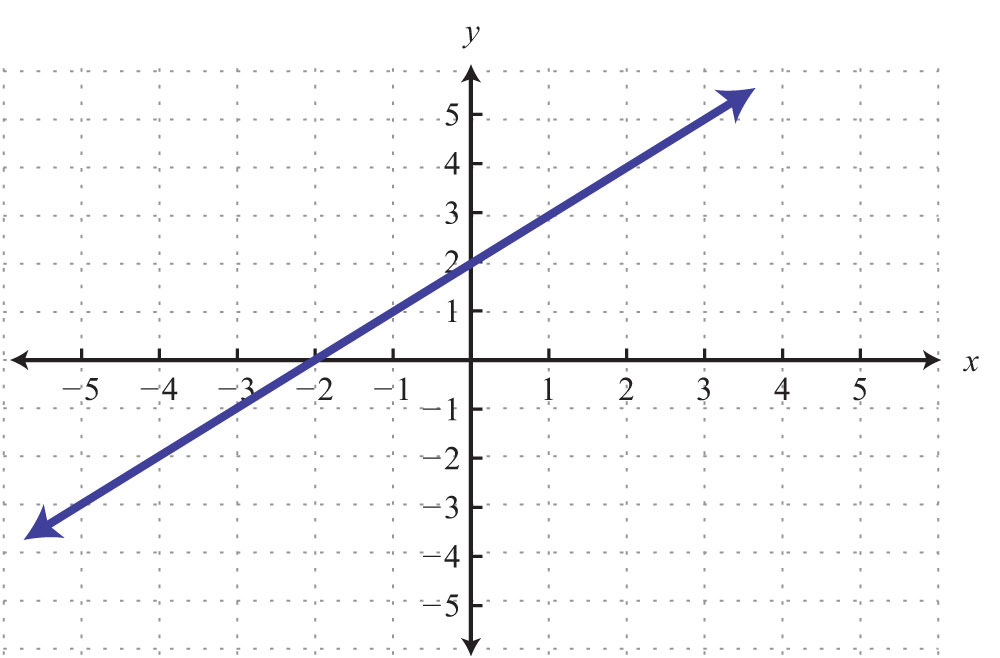
69. Given the graph of , find x when , , and .
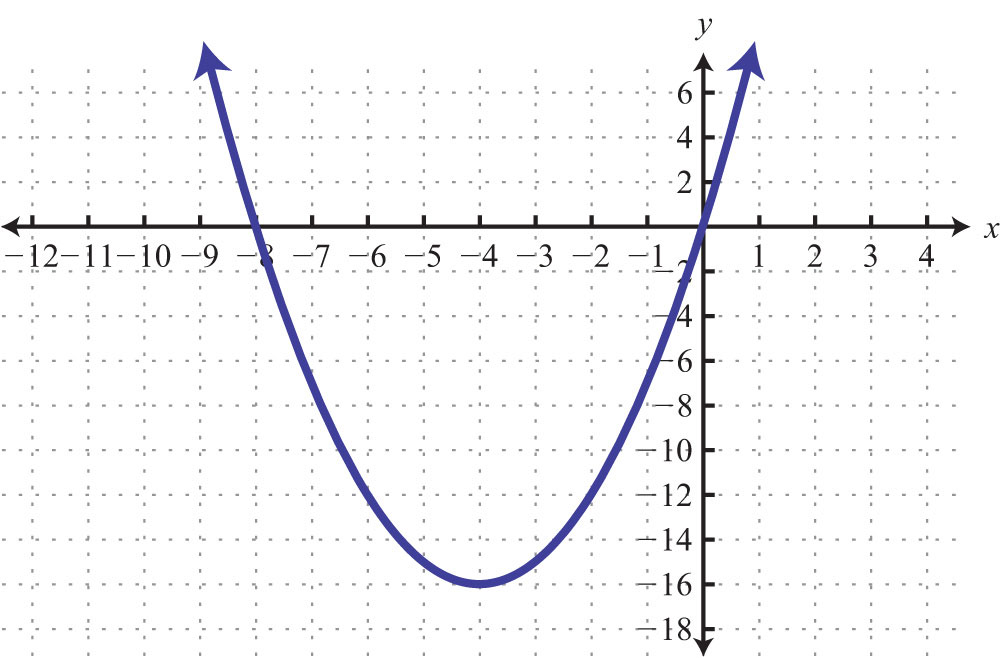
70. Given the graph of , find x when , , and .
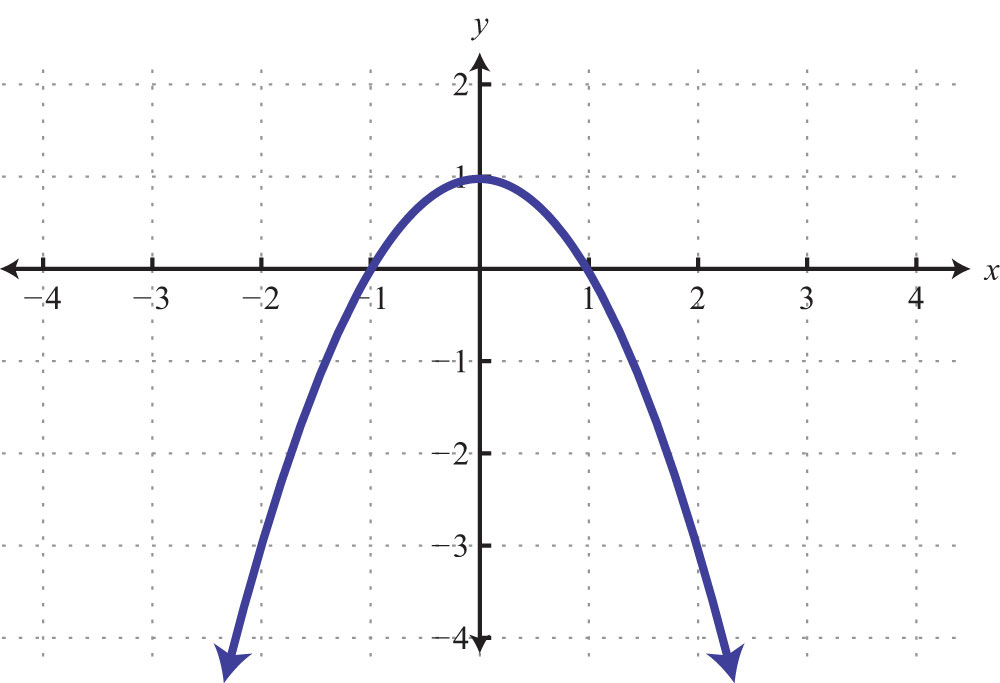
71. Given the graph of , find x when , , and .
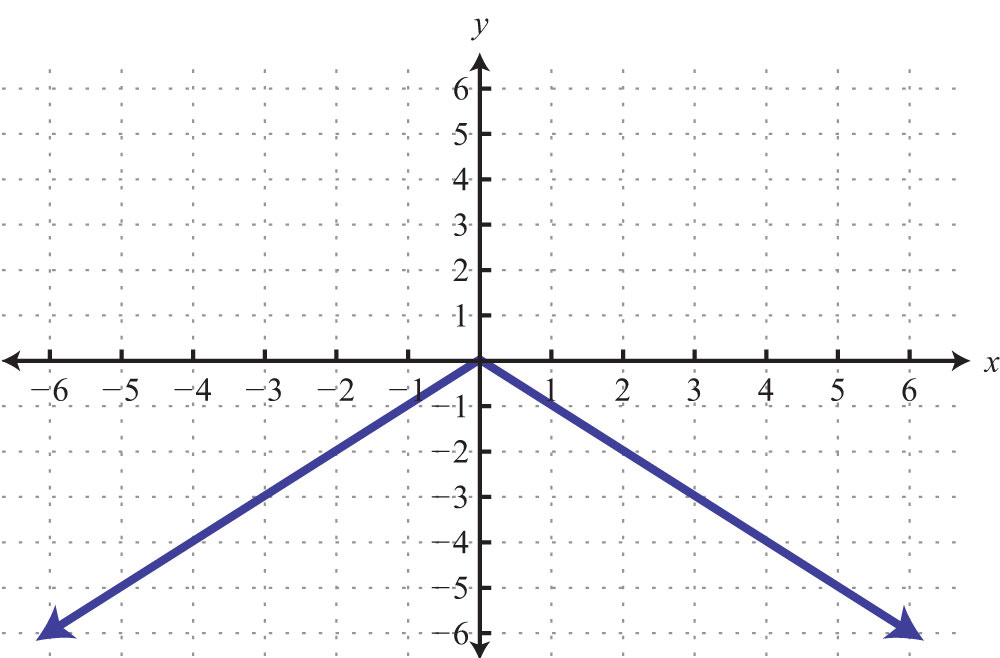
72. Given the graph of , find x when , , and .

73. The cost in dollars of producing pens with a company logo is given by the function where x is the number of pens produced. Use the function to calculate the cost of producing 200 pens.
74. The revenue in dollars from selling sweat shirts is given by the function , where x is the number of sweat shirts sold. Use the function to determine the revenue if 20 sweat shirts are sold.
75. The value of a new car in dollars is given by the function , where t represents the age of the car in years. Use the function to determine the value of the car when it is 5 years old. What was the value of the car when new?
76. The monthly income in dollars of a commissioned car salesman is given by the function , where n represents the number of cars sold in the month. Use the function to determine the salesman’s monthly income if he sells 3 cars this month. What is his income if he does not sell any cars in a month?
77. The perimeter of an isosceles triangle with a base measuring 10 centimeters is given by the function , where x represents the length of each of the equal sides. Find the length of each side if the perimeter is 40 centimeters.
78. The perimeter of a square depends on the length of each side s and is modeled by the function . If the perimeter of a square measures 140 meters, then use the function to calculate the length of each side.
79. A certain cellular phone plan charges $18 per month and $0.10 per minute of usage. The cost of the plan is modeled by the function , where x represents the number of minutes of usage per month. Determine the minutes of usage if the cost for the month was $36.
80. The monthly revenue generated by selling subscriptions to a tutoring website is given by the function , where x represents the number of subscription sales per month. How many subscriptions were sold if the revenues for the month totaled $1,508?
Graph the linear function and state the domain and range.
81.
82.
83.
84.
85.
86.
87.
88.
Part C: Discussion Board Topics
89. Is a vertical line a function? What are the domain and range of a vertical line?
90. Is a horizontal line a function? What are the domain and range of a horizontal line?
91. Come up with your own correspondence between real-world sets. Explain why it does or does not represent a function.
92. Can a function have more than one y-intercept? Explain.
Answers
1: Yes
3: No
5: No
7: Domain: {3, 5, 7}; range: {2, 3, 4}; function: yes
9: Domain: {−10,−8}; range: {0, 1, 2}; function: no
11: Domain: {−4, −1, 2}; range: {1, 2, 3}; function: yes
13: Domain: {−2, 2}; range: {2, 3, 5}; function: no
15: Domain: ; range: {2}; function: yes
17: Domain: ; range: ; function: yes
19: Domain: ; range: ; function: no
21: Domain: ; range: ; function: yes
23: Domain: ; range: ; function: yes
25: Domain: ; range: ; function: yes
27:
29:
31:
33:
35:
37:
39:
41:
43:
45:
47:
49:
51:
53:
55:
57: , , , and
59: , , , and
61: , , , and
63: , , , and
65: , , and
67: (answers may vary)
69: ; and ; and
71: and ; ; and
73: $450
75: New: $18,000; 5 years old: $5,500
77: 15 centimeters
79: 180 minutes
81: Domain and range: R
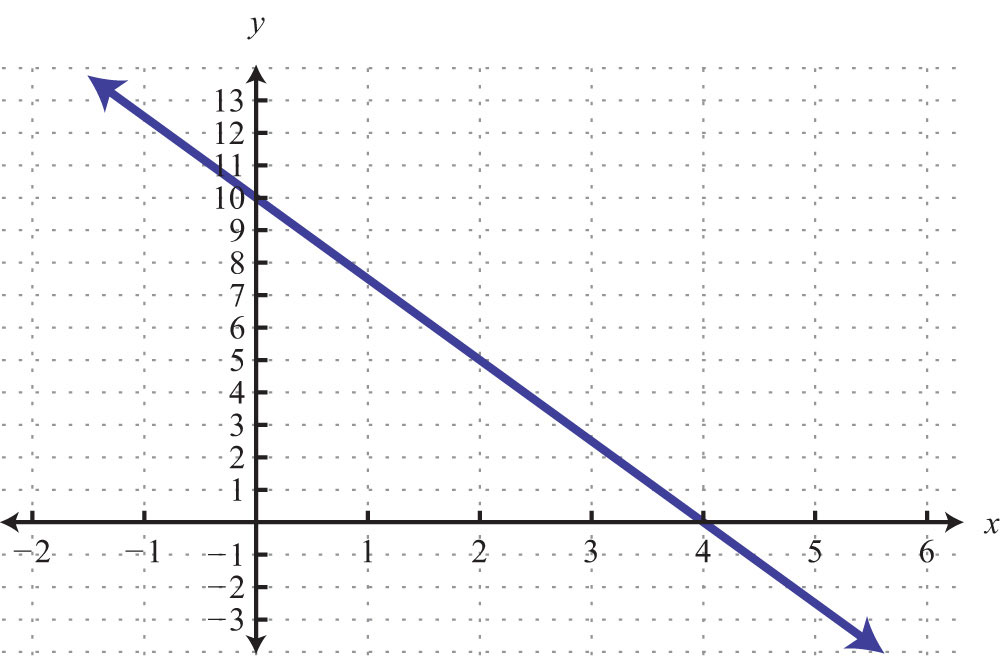
83: Domain and range: R
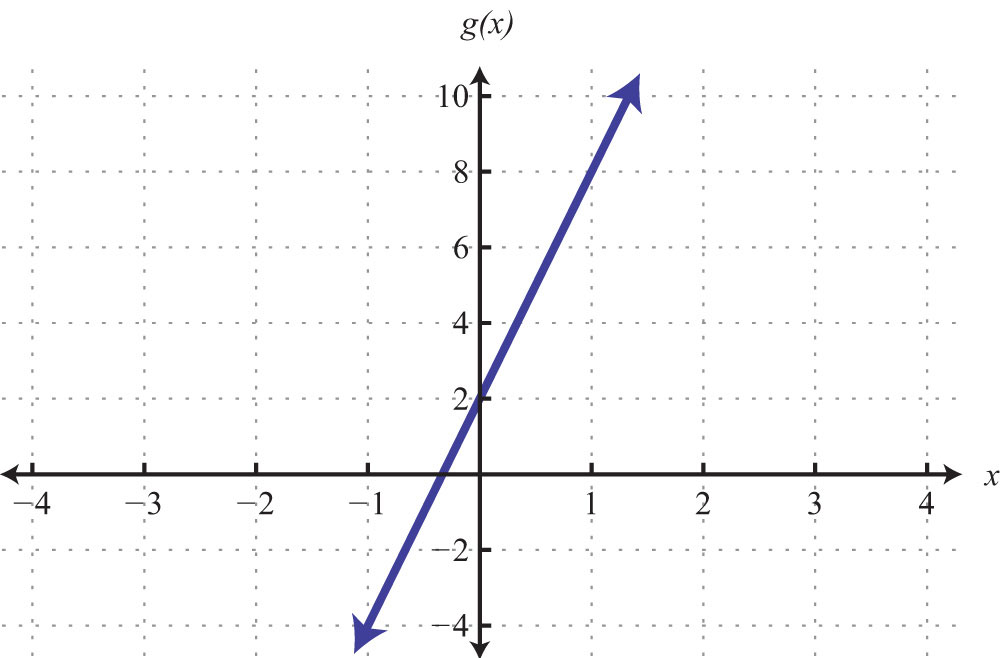
85: Domain and range R
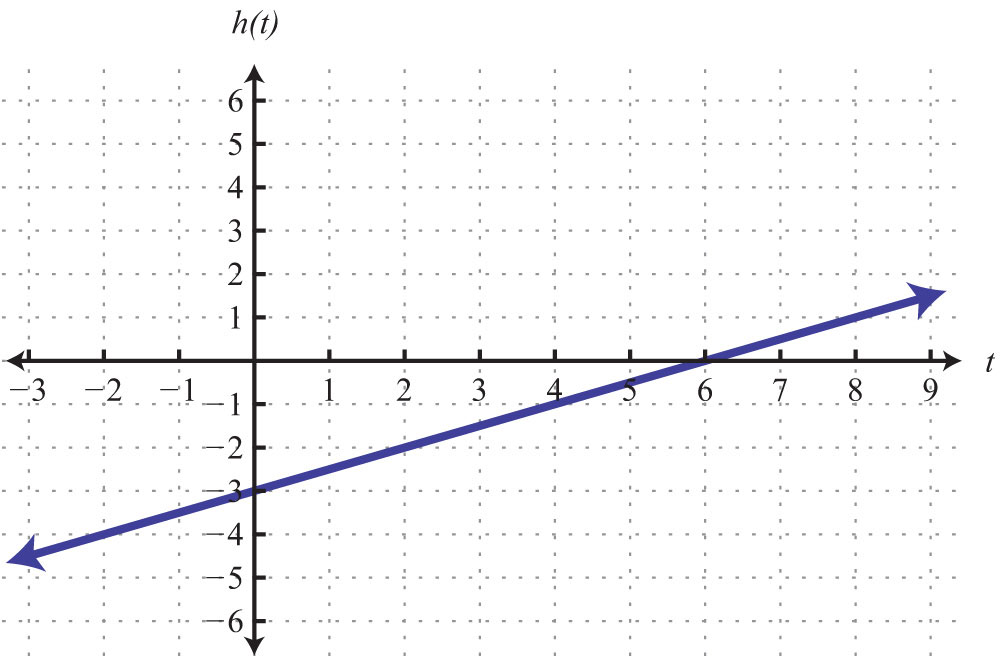
87: Domain and range: R
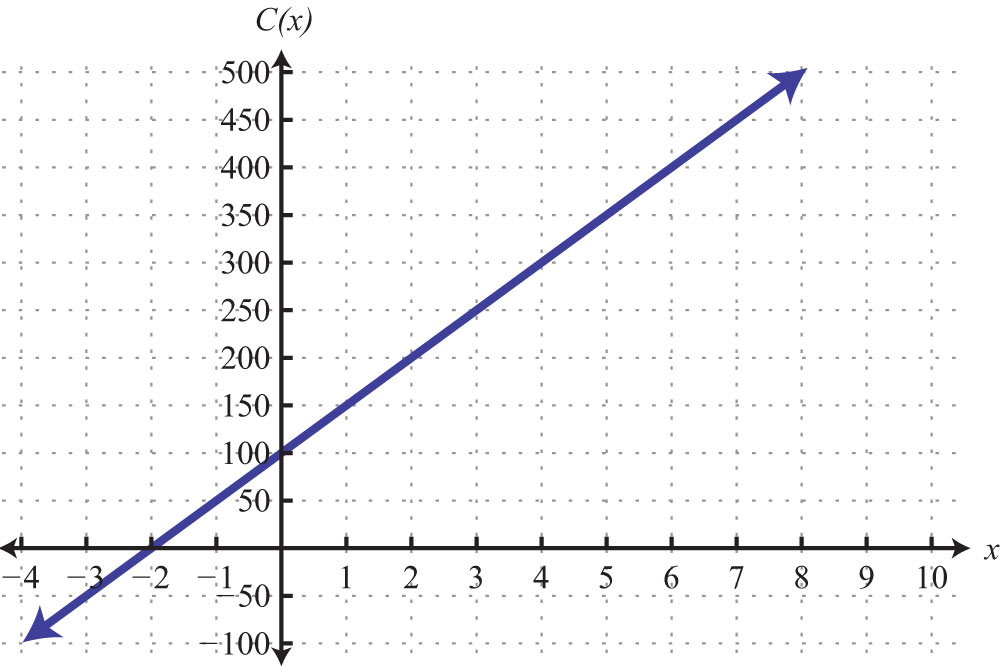
3.8 Linear Inequalities (Two Variables)
Learning Objectives
- Identify and check solutions to linear inequalities with two variables.
- Graph solution sets of linear inequalities with two variables.
Solutions to Linear Inequalities
We know that a linear equation with two variables has infinitely many ordered pair solutions that form a line when graphed. A linear inequality with two variablesAn inequality relating linear expressions with two variables. The solution set is a region defining half of the plane., on the other hand, has a solution set consisting of a region that defines half of the plane.
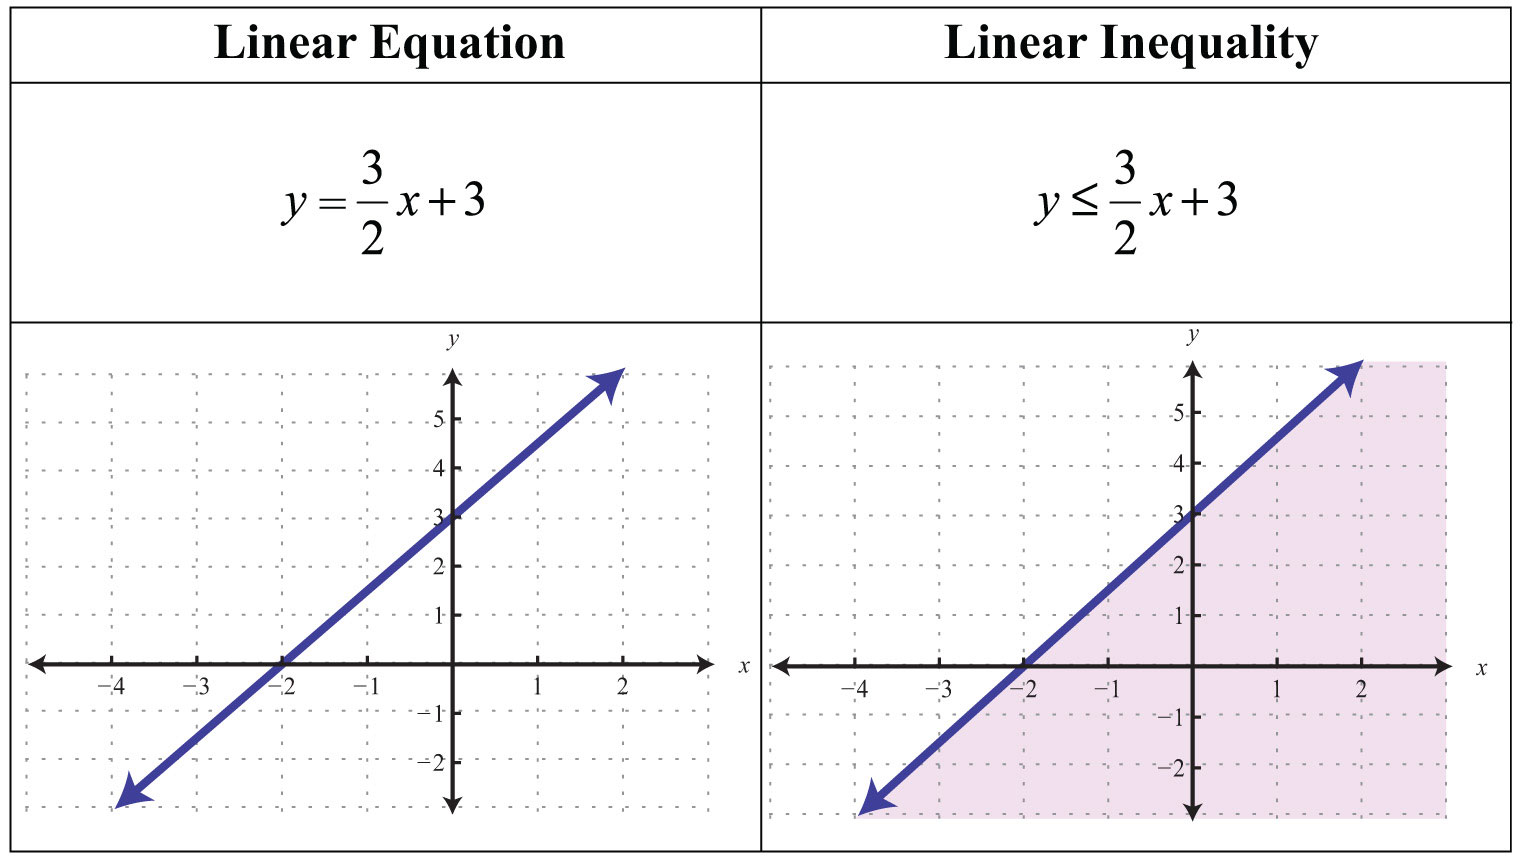
For the inequality, the line defines one boundary of the region that is shaded. This indicates that any ordered pair that is in the shaded region, including the boundary line, will satisfy the inequality. To see that this is the case, choose a few test pointsA point not on the boundary of the linear inequality used as a means to determine in which half-plane the solutions lie. and substitute them into the inequality.
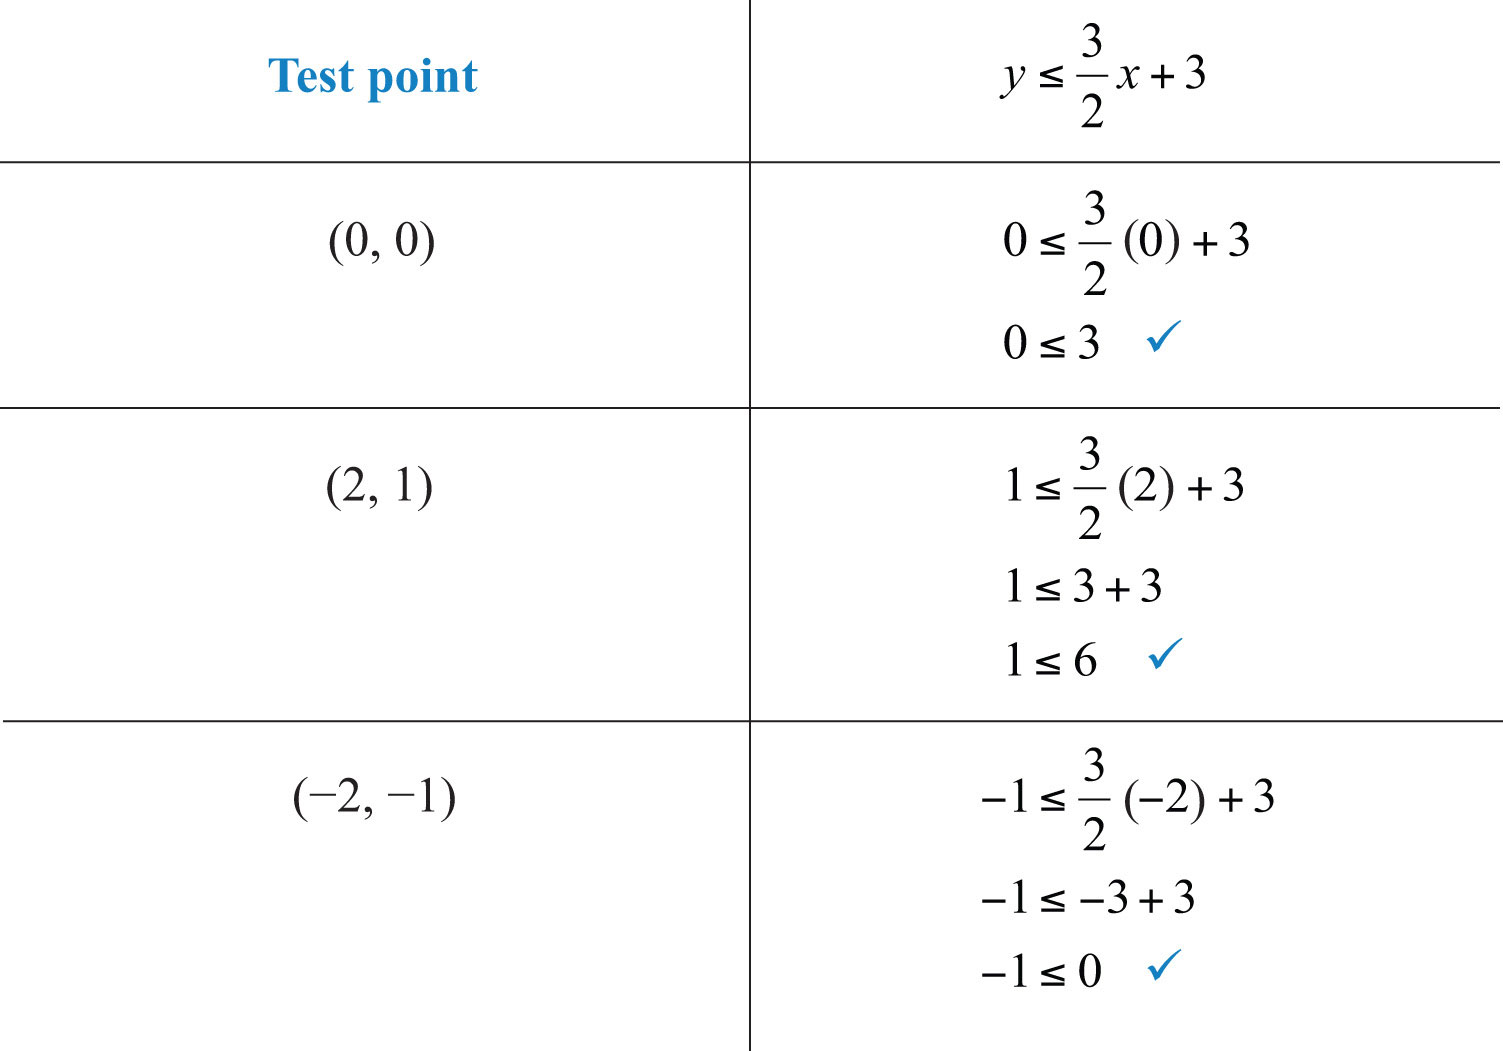
Also, we can see that ordered pairs outside the shaded region do not solve the linear inequality.
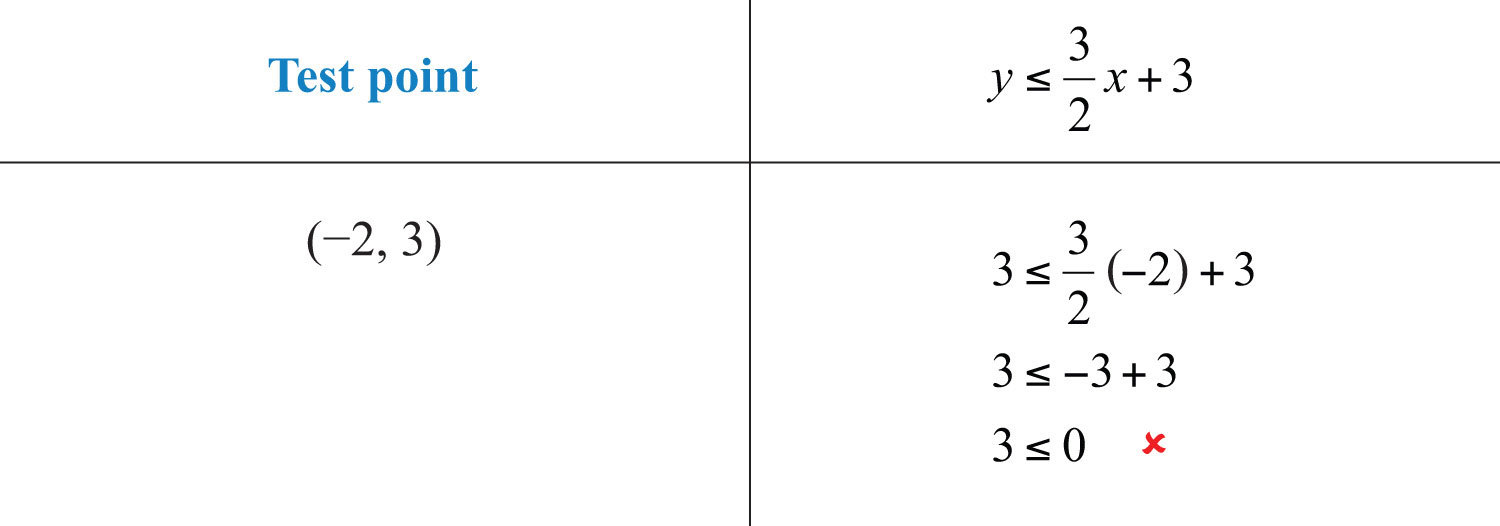
The graph of the solution set to a linear inequality is always a region. However, the boundary may not always be included in that set. In the previous example, the line was part of the solution set because of the “or equal to” part of the inclusive inequality . If we have a strict inequality , we would then use a dashed line to indicate that those points are not included in the solution set.
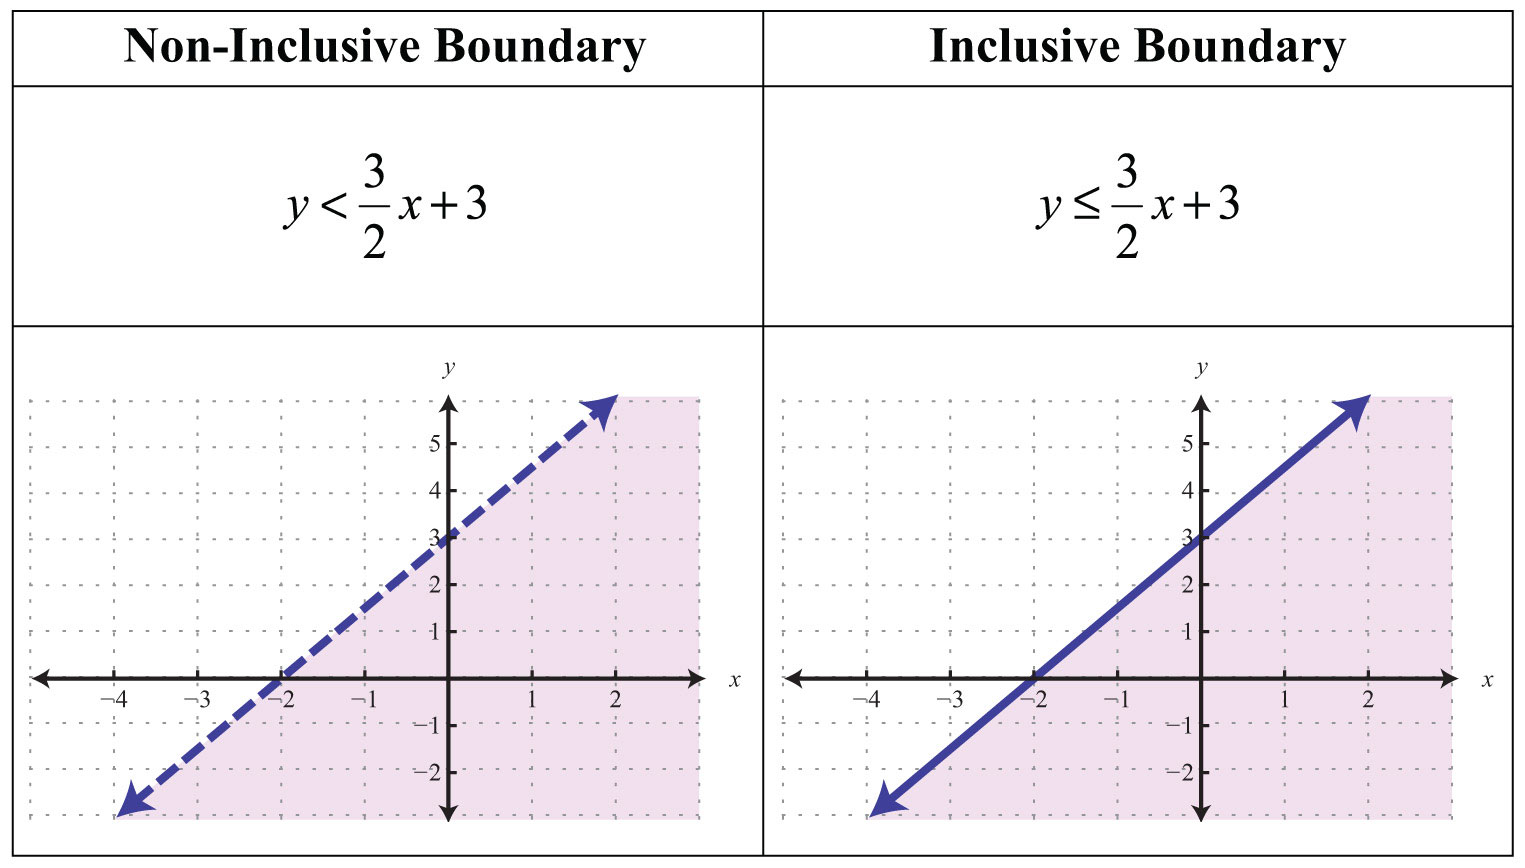
Consider the point (0, 3) on the boundary; this ordered pair satisfies the linear equation. It is the “or equal to” part of the inclusive inequality that makes it part of the solution set.
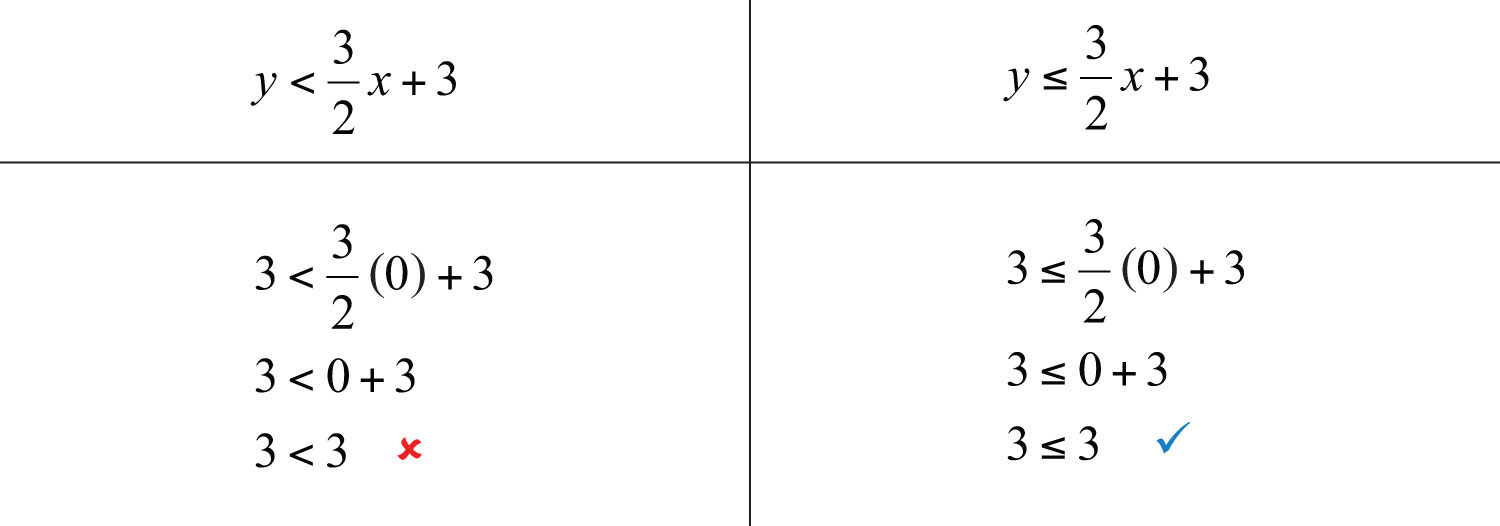
So far, we have seen examples of inequalities that were “less than.” Now consider the following graphs with the same boundary:
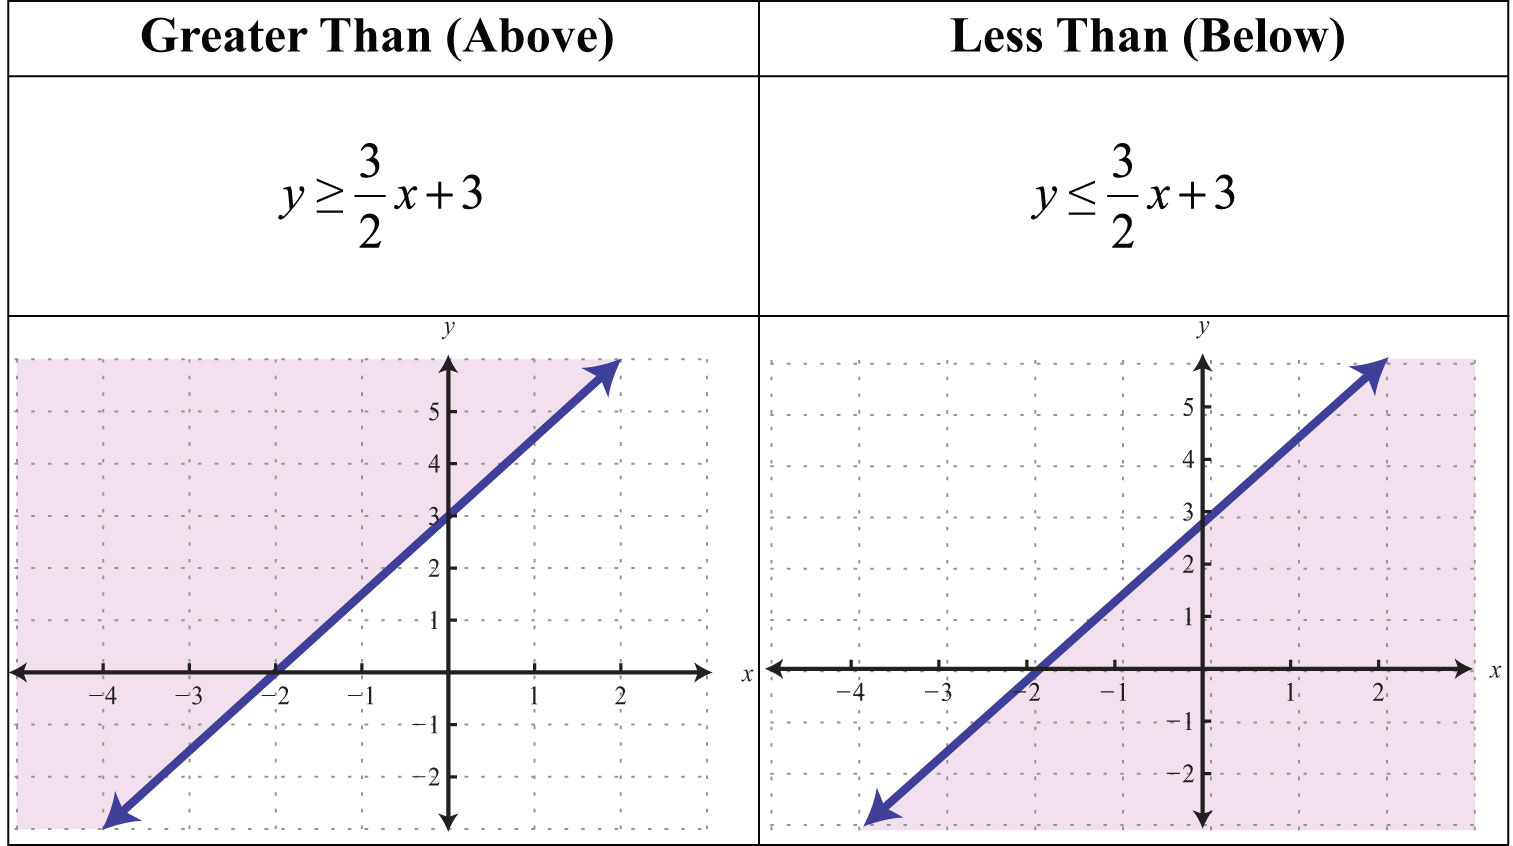
Given the graphs above, what might we expect if we use the origin (0, 0) as a test point?
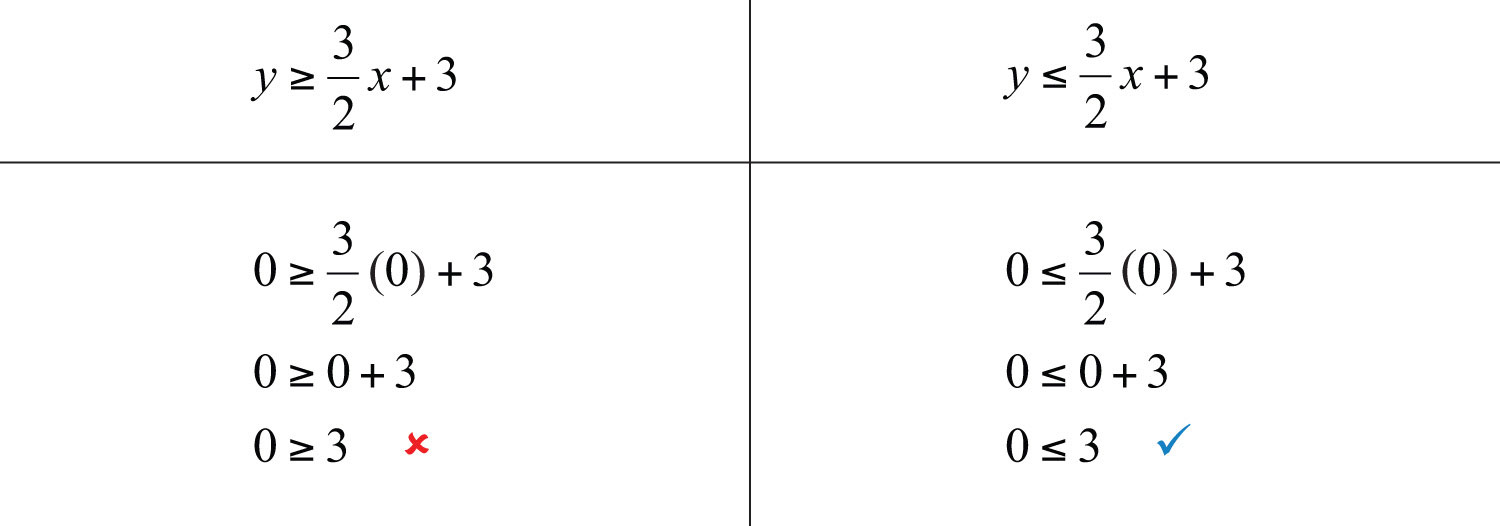
Try this! Which of the ordered pairs (−2, −1), (0, 0), (−2, 8), (2, 1), and (4, 2) solve the inequality ?
Answer: (−2, 8) and (4, 2)
Video Solution
(click to see video)Graphing Solutions to Linear Inequalities
Solutions to linear inequalities are a shaded half-plane, bounded by a solid line or a dashed line. This boundary is either included in the solution or not, depending on the given inequality. If we are given a strict inequality, we use a dashed line to indicate that the boundary is not included. If we are given an inclusive inequality, we use a solid line to indicate that it is included. The steps for graphing the solution set for an inequality with two variables are outlined in the following example.
Example 1: Graph the solution set: .
Solution:
Step 1: Graph the boundary line. In this case, graph a dashed line because of the strict inequality. By inspection, we see that the slope is and the y-intercept is (0, 1).
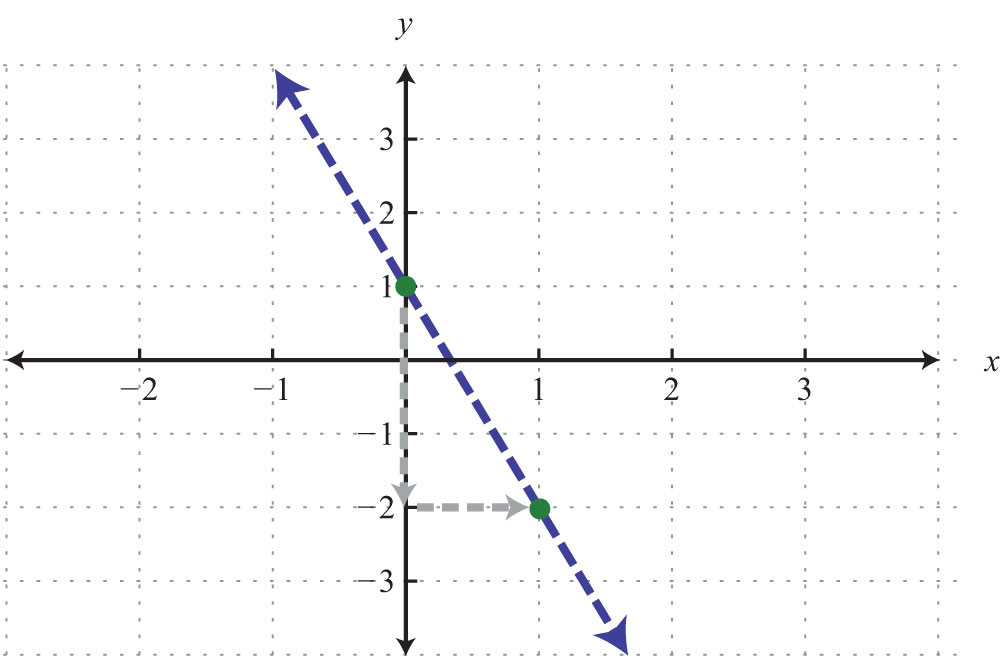
Step 2: Test a point not on the boundary. A common test point is the origin (0, 0). The test point helps us determine which half of the plane to shade.
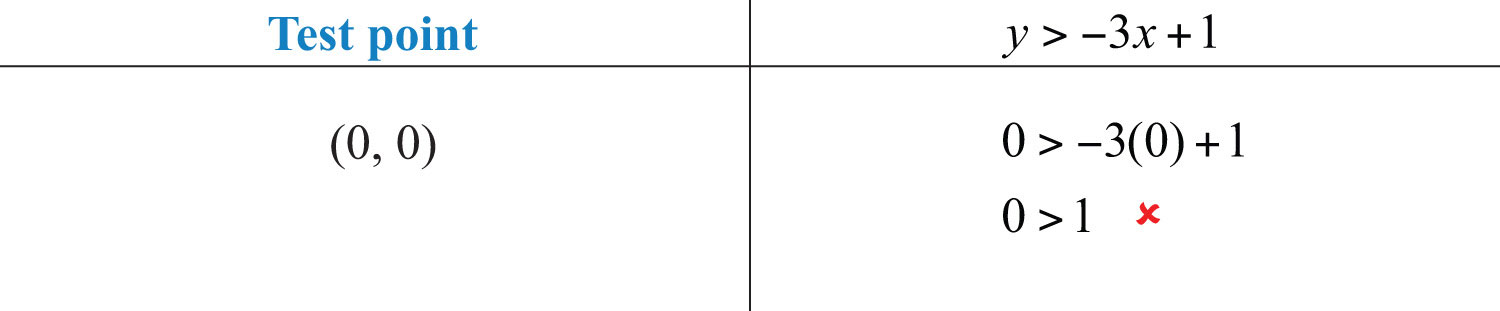
Step 3: Shade the region containing the solutions. Since the test point (0, 0) was not a solution, it does not lie in the region containing all the ordered pair solutions. Therefore, shade the half of the plane that does not contain this test point. In this case, shade above the boundary line.
Answer:
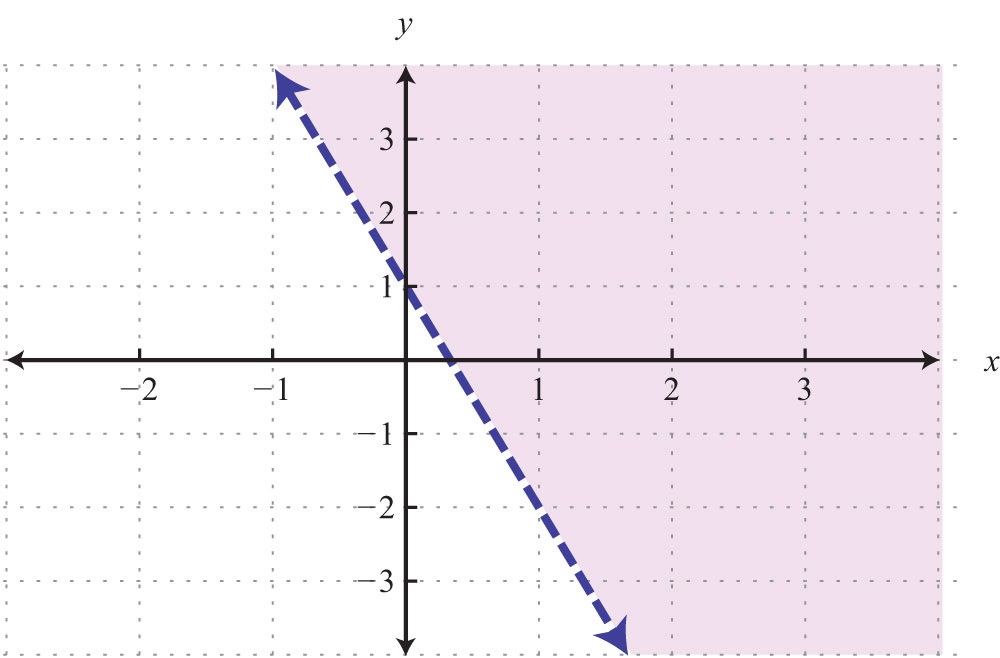
Consider the problem of shading above or below the boundary line when the inequality is in slope-intercept form. If , then shade above the line. If , then shade below the line. Use this with caution; sometimes the boundary is given in standard form, in which case these rules do not apply.
Example 2: Graph the solution set: .
Solution: Here the boundary is defined by the line . Since the inequality is inclusive, we graph the boundary using a solid line. In this case, graph the boundary line using intercepts.
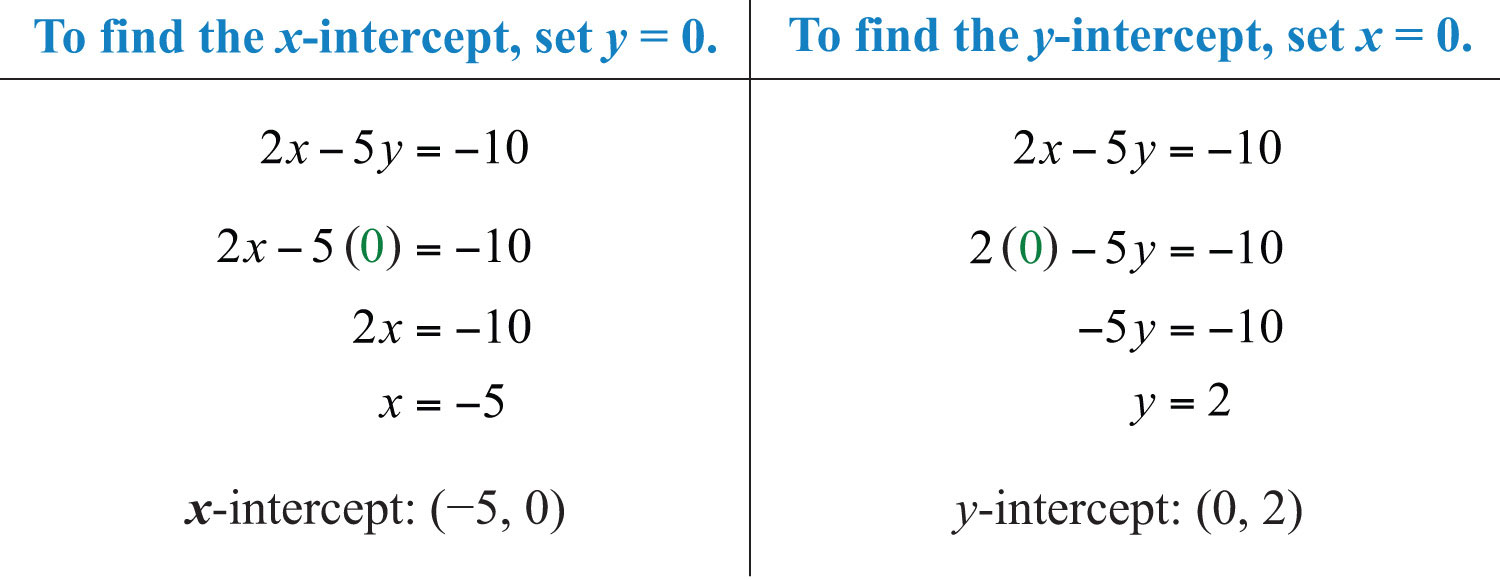
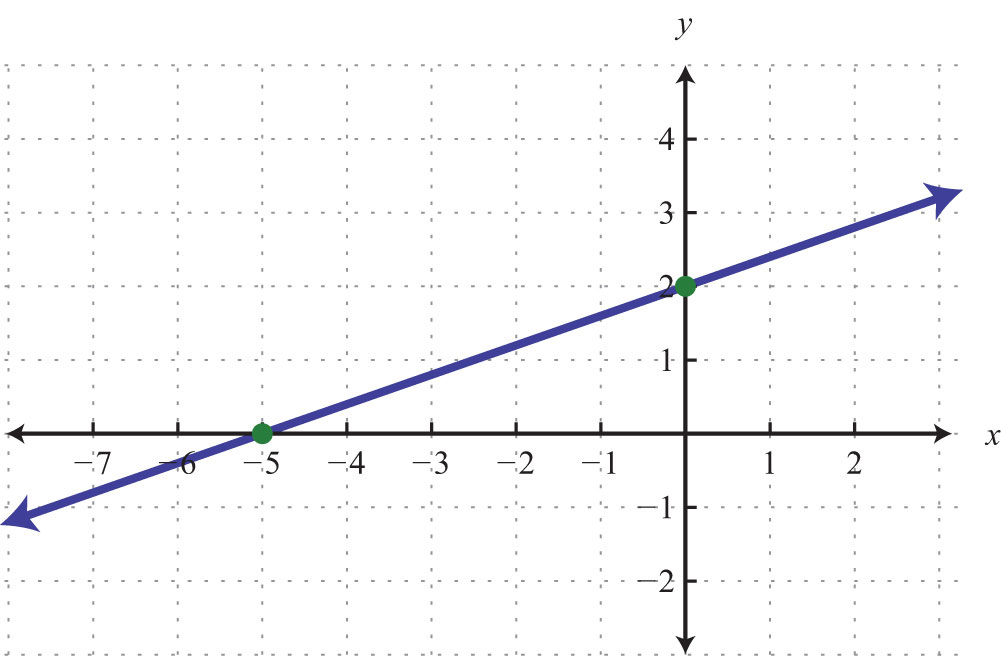
Next, test a point; this helps decide which region to shade.
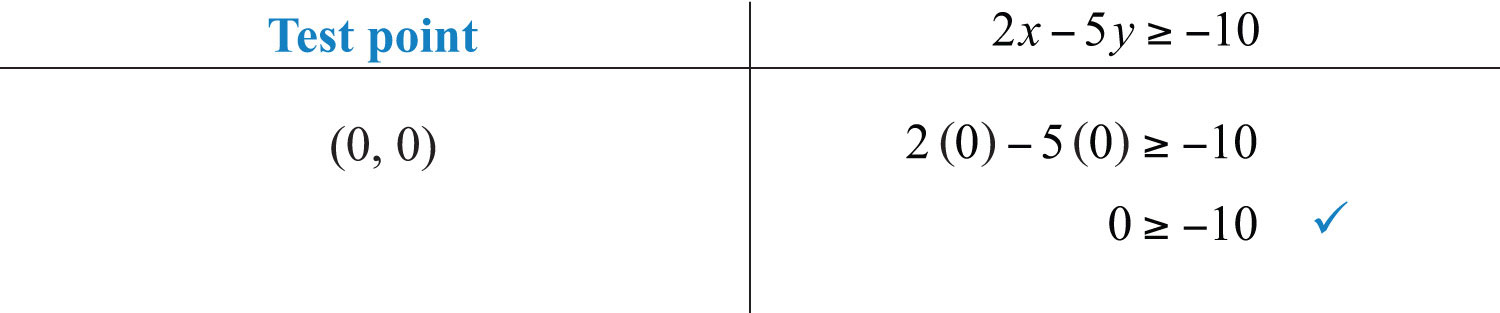
Since the test point is in the solution set, shade the half of the plane that contains it.
Answer:
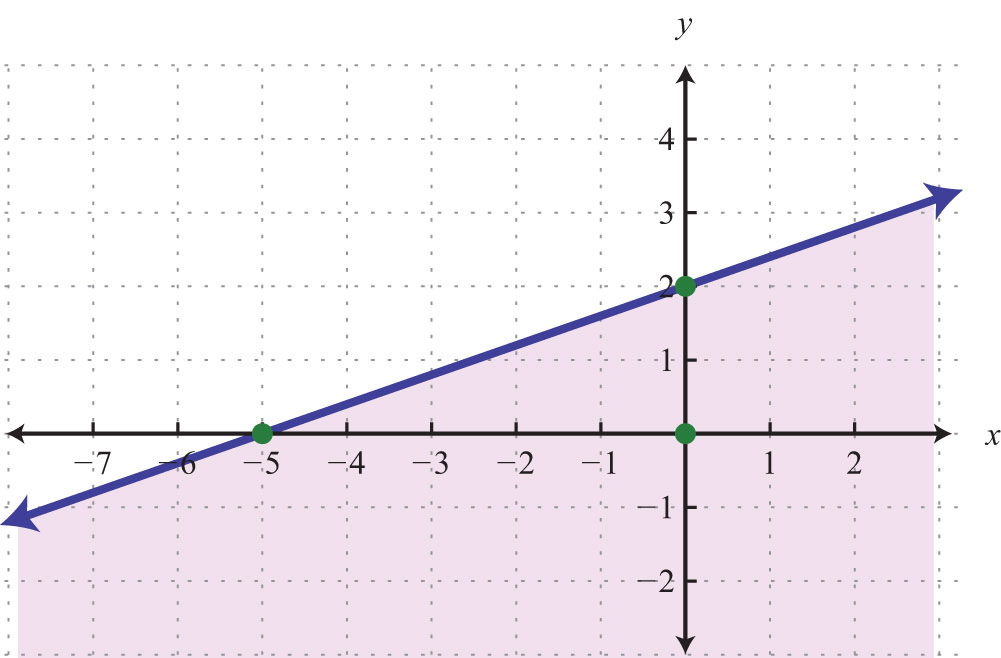
In this example, notice that the solution set consists of all the ordered pairs below the boundary line. This may be counterintuitive because of the original ≥ in the inequality. This illustrates that it is a best practice to actually test a point. Solve for y and you see that the shading is correct.
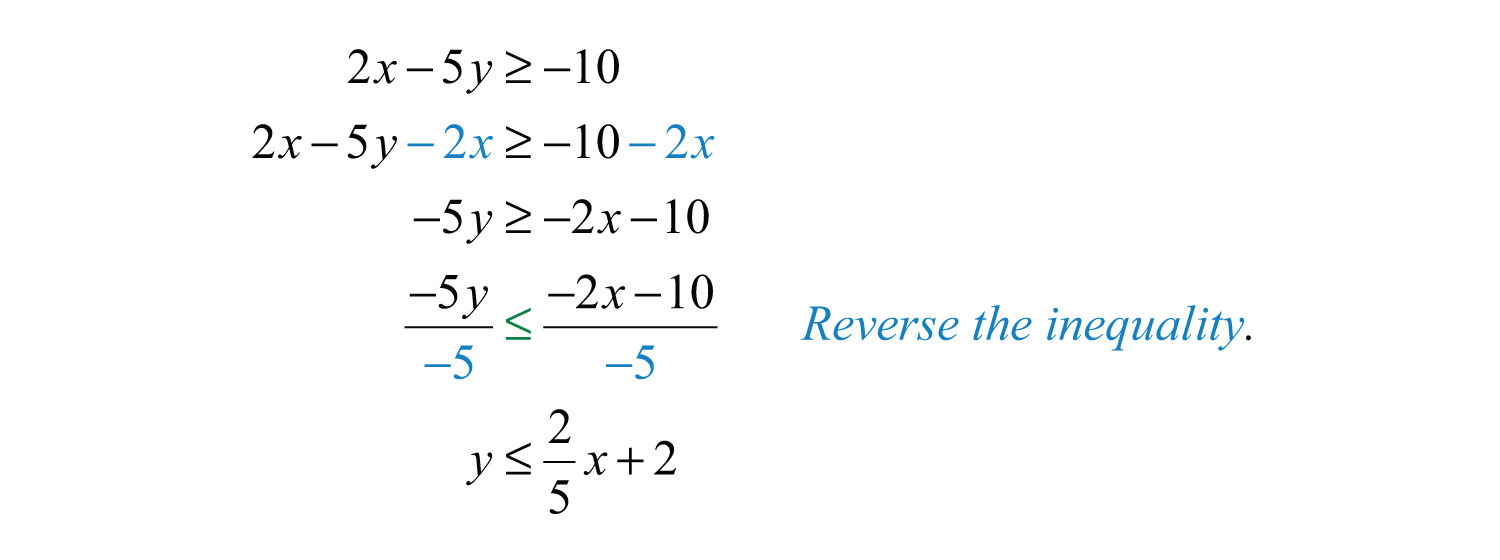
In slope-intercept form, you can see that the region below the boundary line should be shaded. An alternate approach is to first express the boundary in slope-intercept form, graph it, and then shade the appropriate region.
Example 3: Graph the solution set: .
Solution: First, graph the boundary line with a dashed line because of the strict inequality.
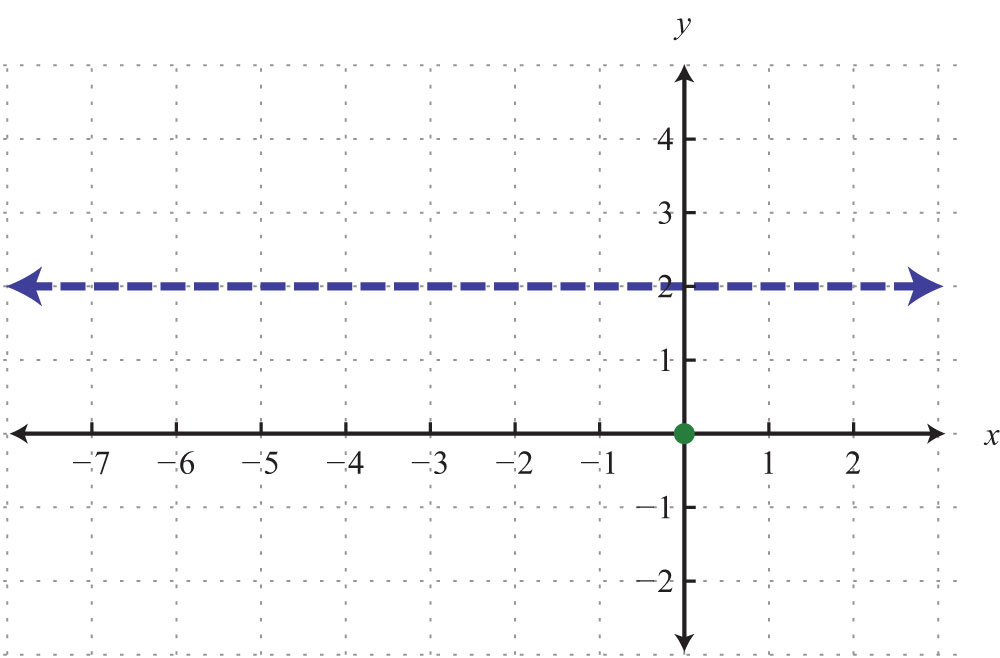
Next, test a point.

In this case, shade the region that contains the test point.
Answer:
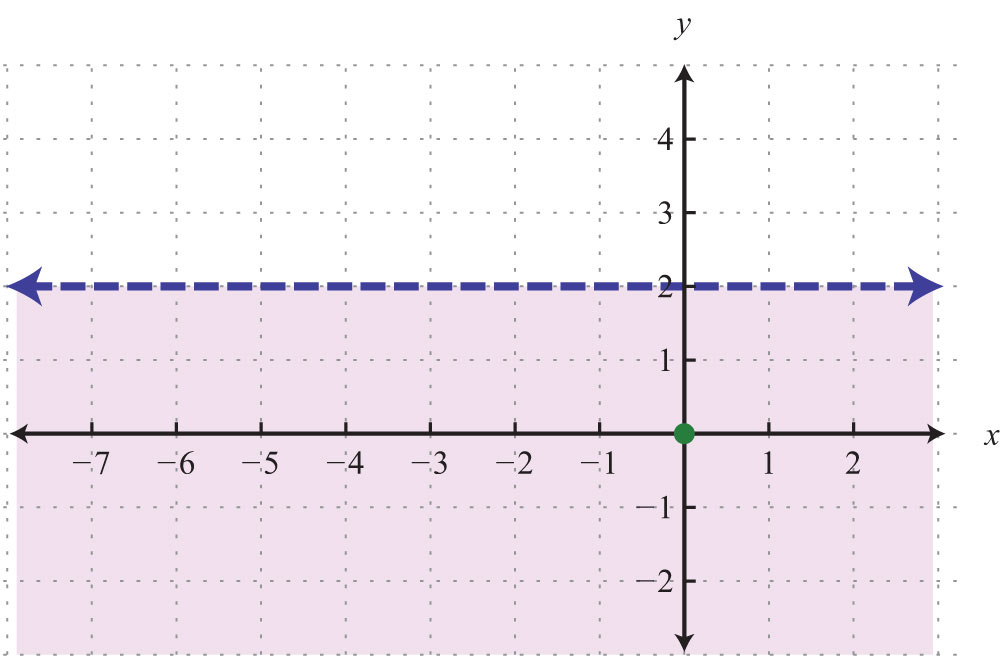
Try this! Graph the solution set: .
Answer:
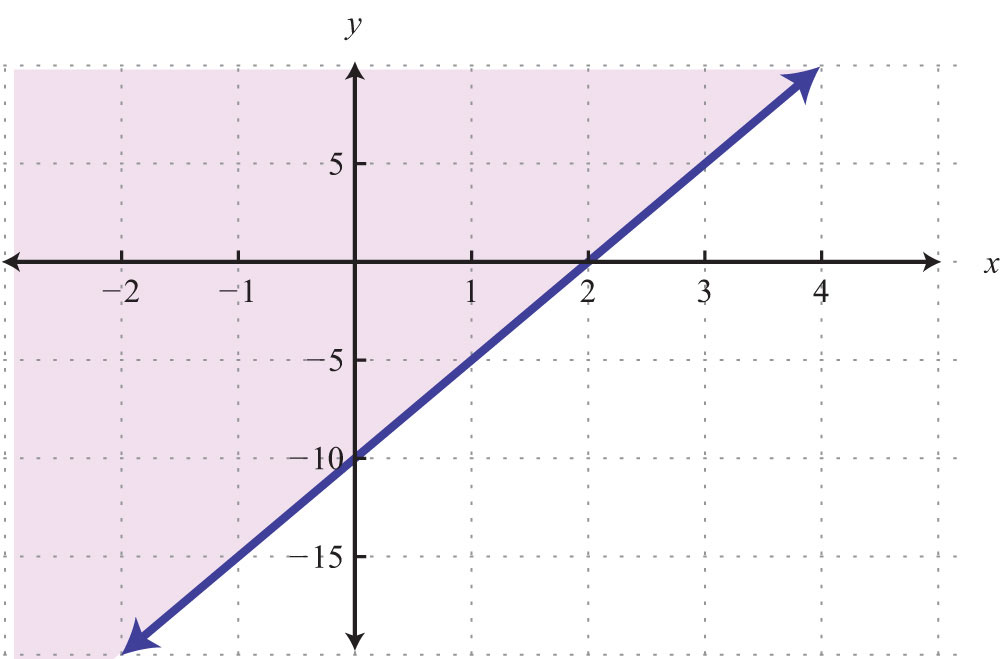
Video Solution
(click to see video)Key Takeaways
- Linear inequalities with two variables have infinitely many ordered pair solutions, which can be graphed by shading in the appropriate half of a rectangular coordinate plane.
- To graph the solution set of a linear inequality with two variables, first graph the boundary with a dashed or solid line depending on the inequality. If given a strict inequality, use a dashed line for the boundary. If given an inclusive inequality, use a solid line. Next, choose a test point not on the boundary. If the test point solves the inequality, then shade the region that contains it; otherwise, shade the opposite side.
- When graphing the solution sets of linear inequalities, it is a good practice to test values in and out of the solution set as a check.
Topic Exercises
Part A: Solutions to Linear Inequalities (Two Variables)
Is the ordered pair a solution to the given inequality?
1. ; (0, 0)
2. ; (0, −2)
3. ; (6, 5)
4. ; (−3, −8)
5. ;
6. ; (−2, −1)
7. ; (0, 0)
8. ; (5, −3)
9. ; (−3, −1)
10. ; (0, 7)
Part B: Graphing Solutions to Linear Inequalities
Graph the solution set.
11.
12.
13.
14.
15.
16.
17.
18.
19.
20.
21.
22.
23.
24.
25.
26.
27.
28.
29.
30.
31.
32.
33.
34.
35.
36.
37.
38.
39.
40.
41.
42.
43. Write an inequality that describes all points in the upper half-plane above the x-axis.
44. Write an inequality that describes all points in the lower half-plane below the x-axis.
45. Write an inequality that describes all points in the half-plane left of the y-axis.
46. Write an inequality that describes all points in the half-plane right of the y-axis.
47. Write an inequality that describes all ordered pairs whose y-coordinates are at least 2.
48. Write an inequality that describes all ordered pairs whose x-coordinate is at most 5.
Answers
1: Yes
3: Yes
5: Yes
7: No
9: Yes
11:
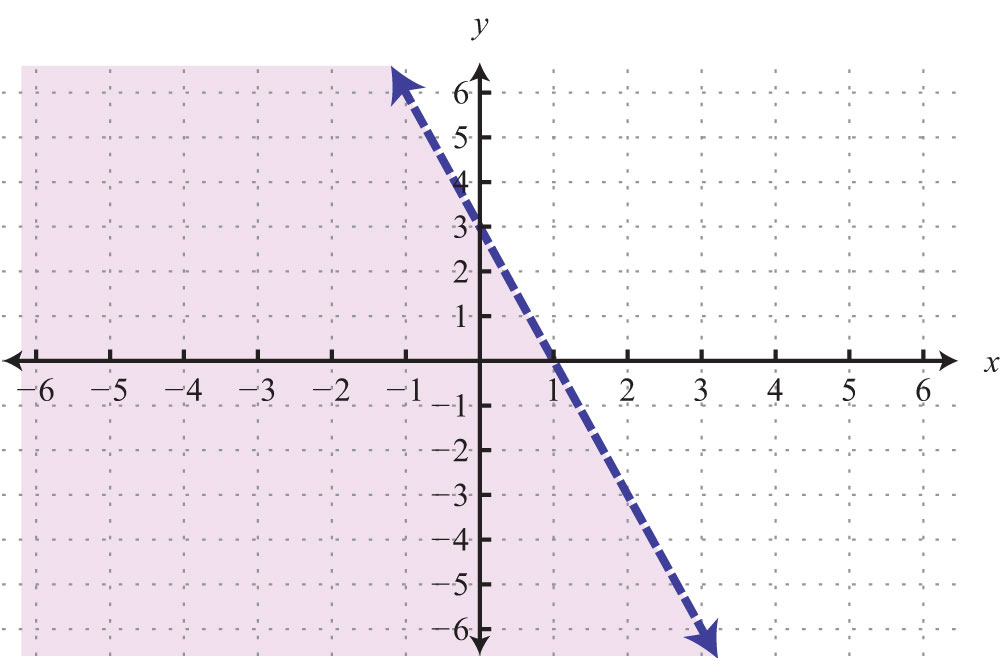
13:

15:
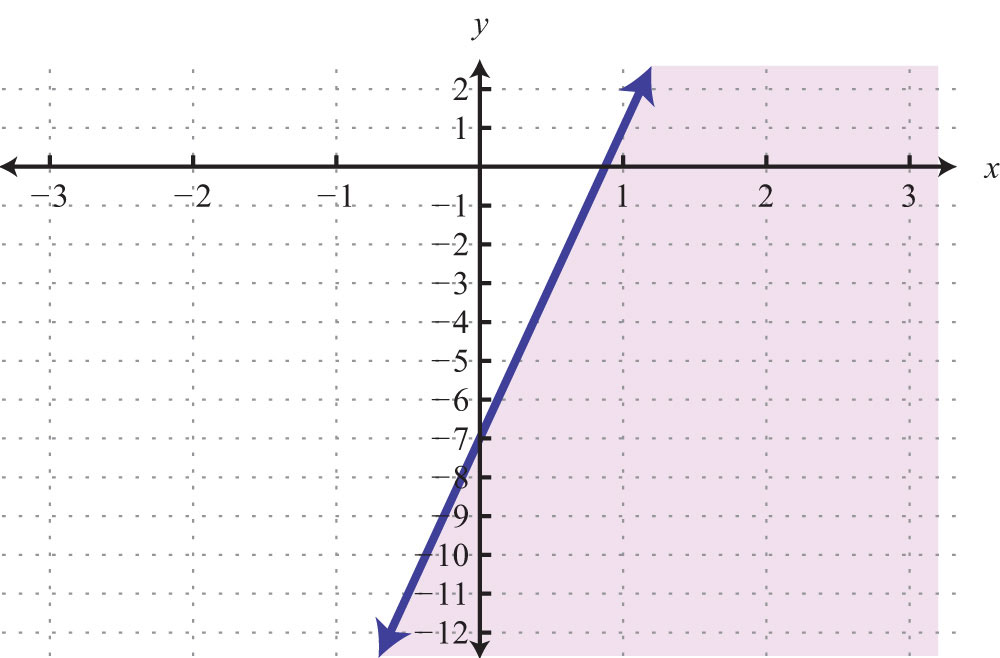
17:
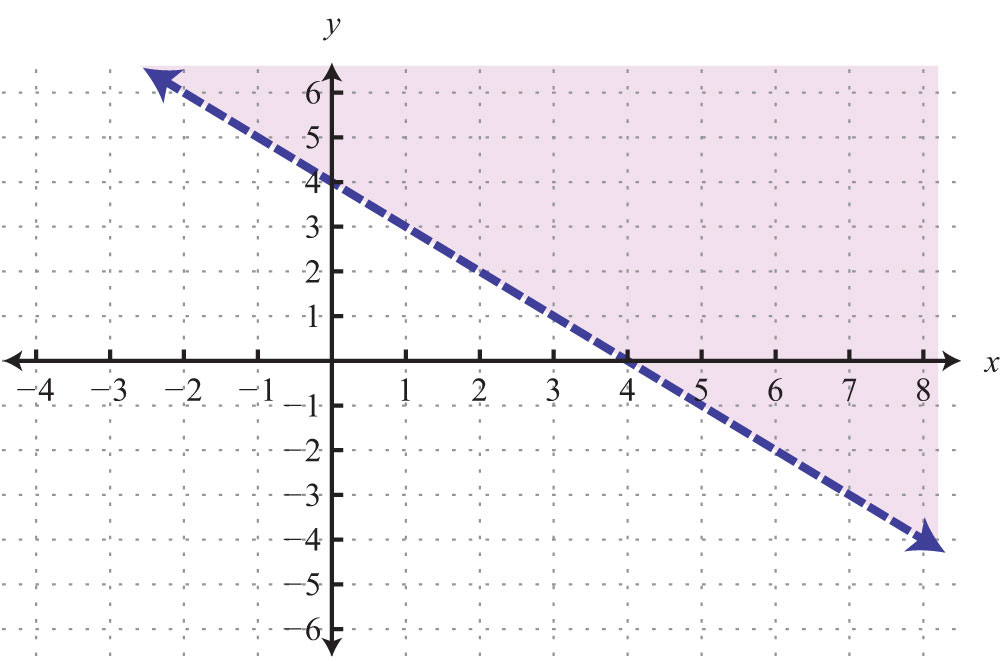
19:
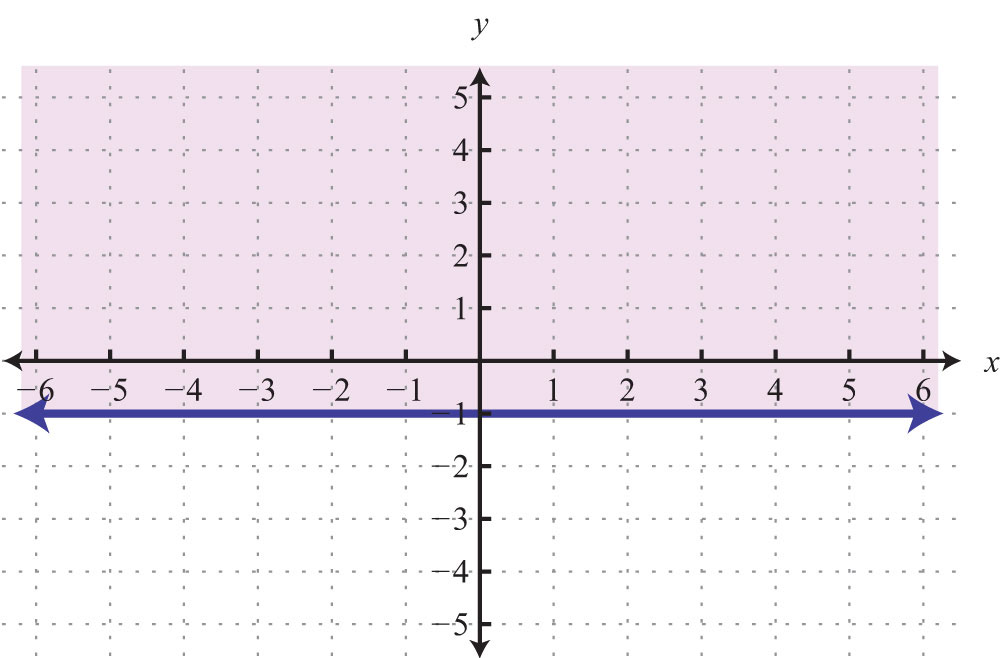
21:
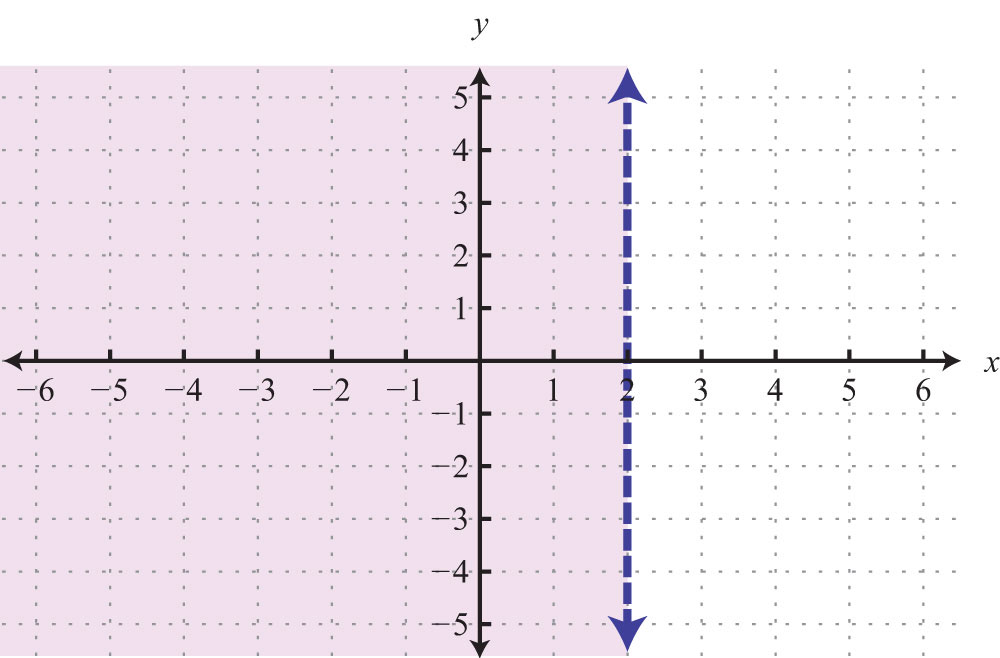
23:
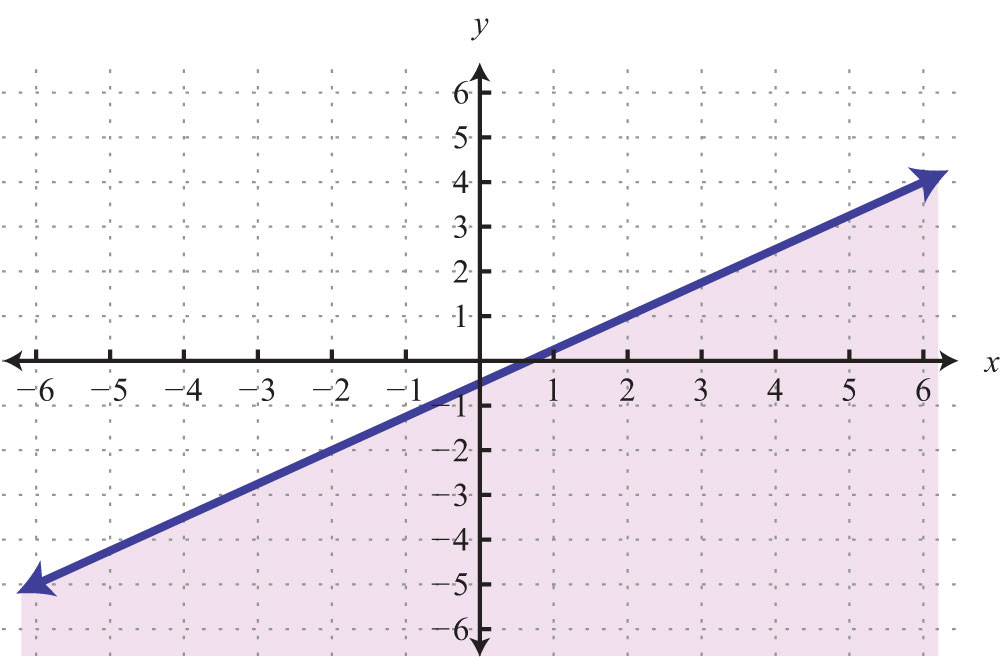
25:
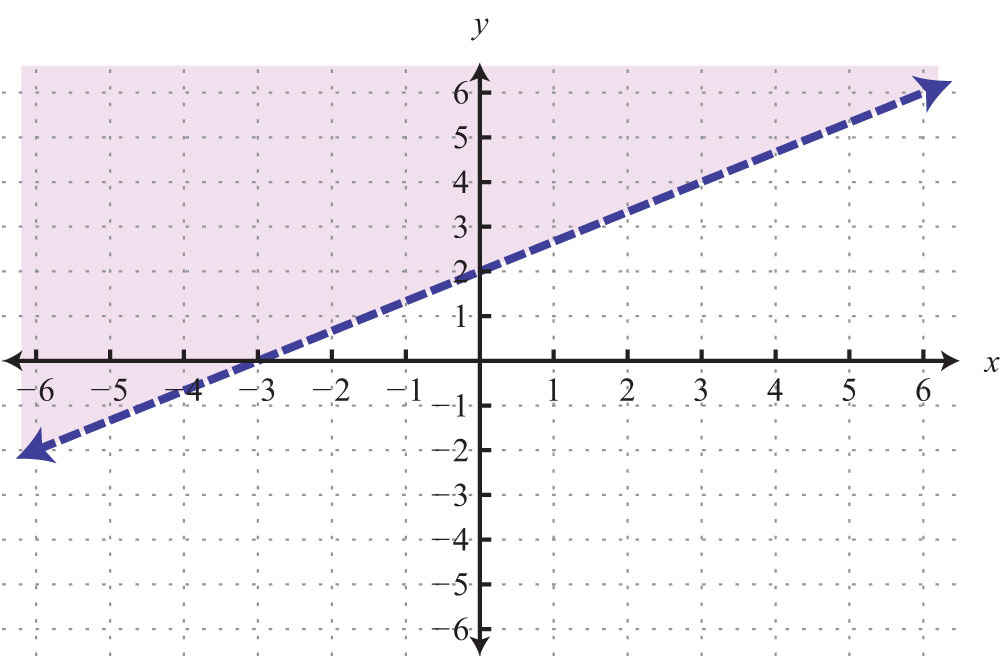
27:
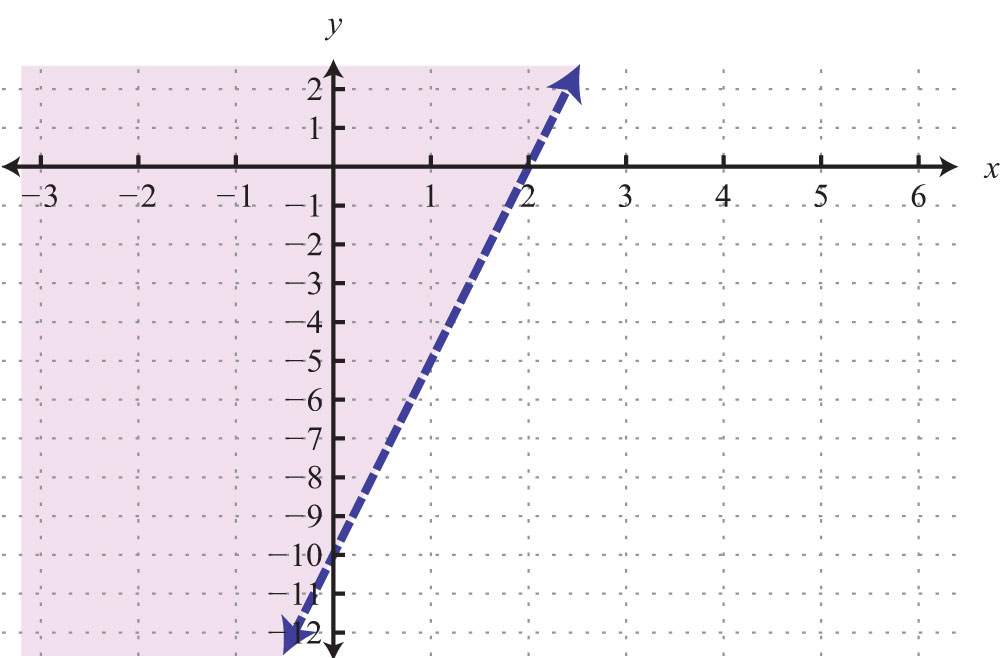
29:
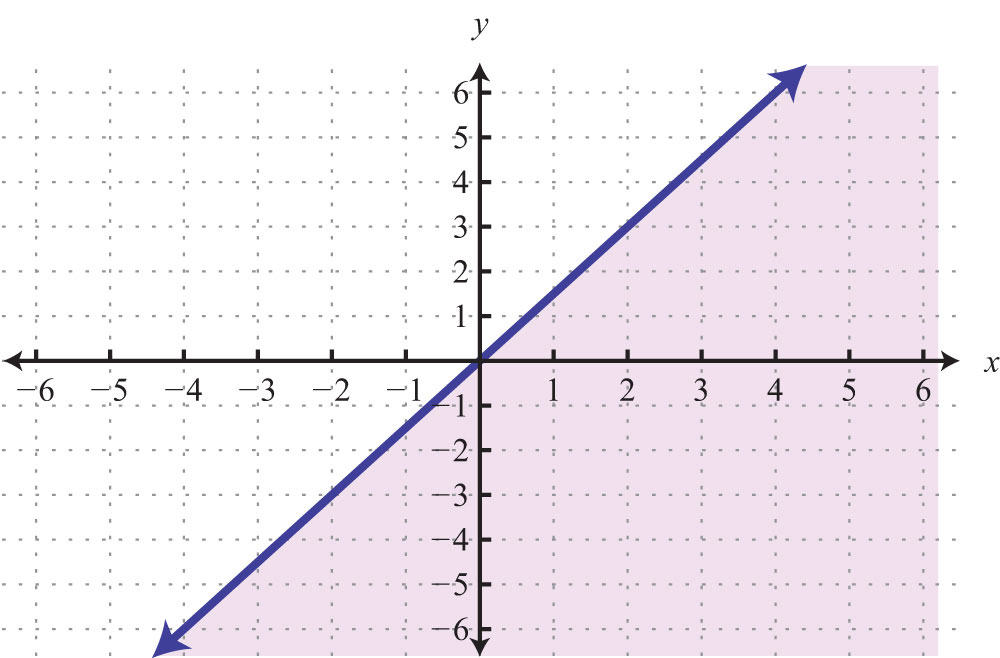
31:
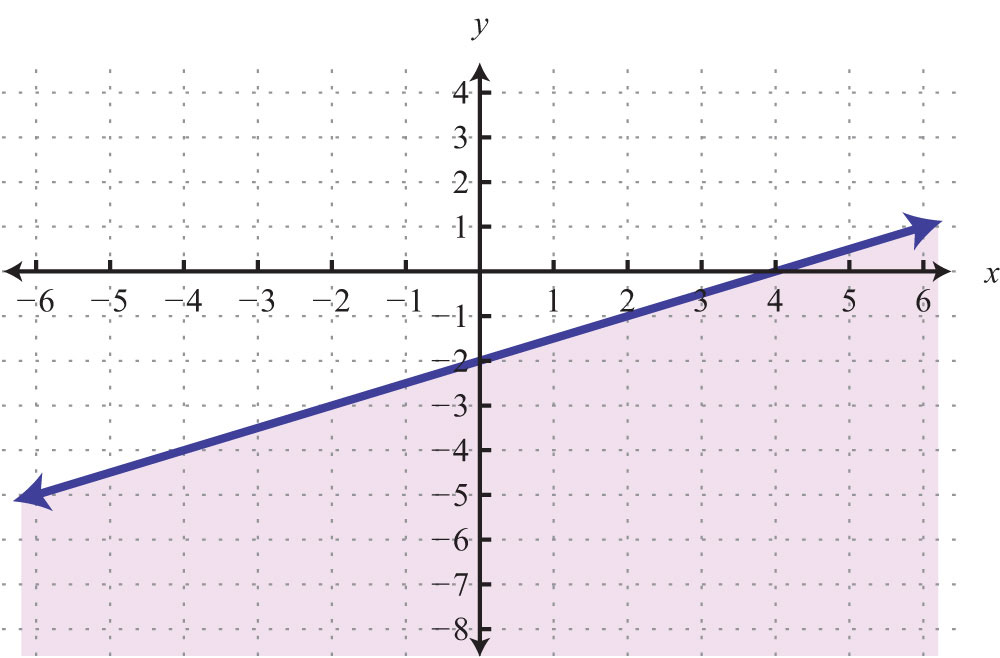
33:
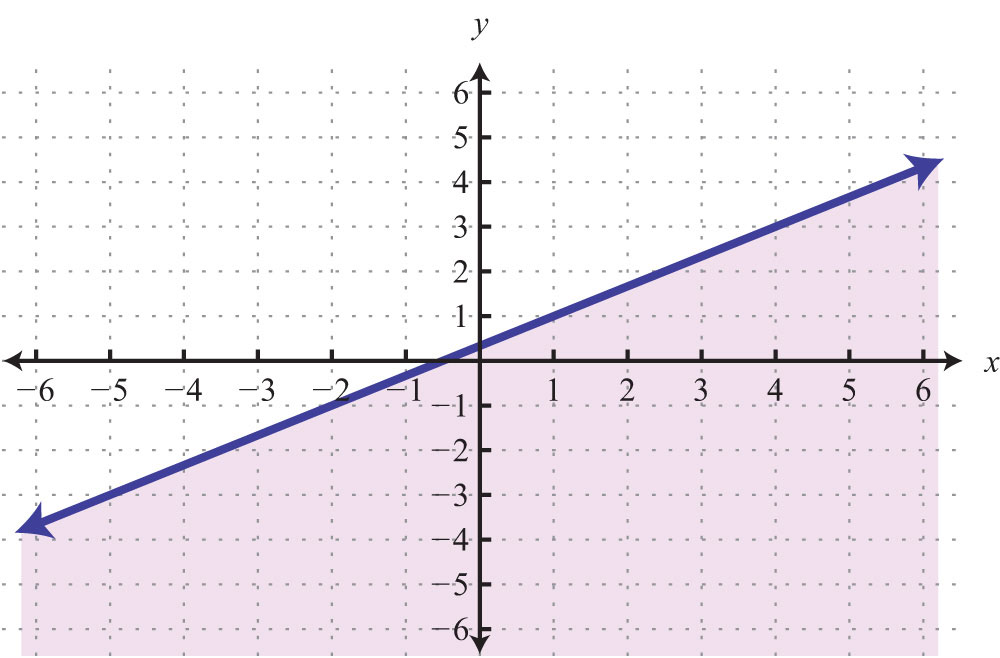
35:
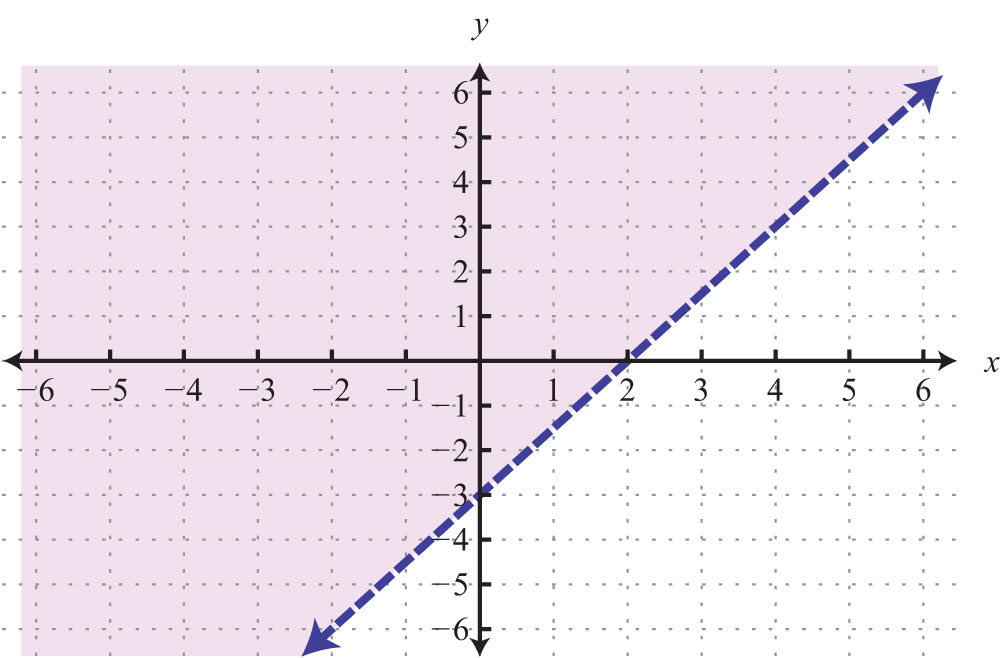
37:
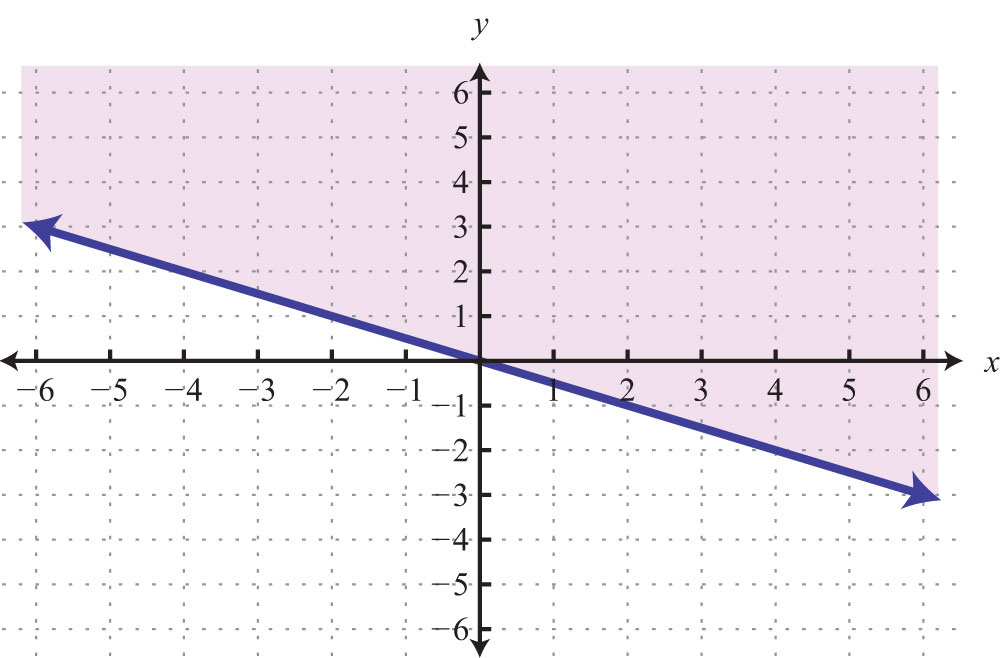
39:
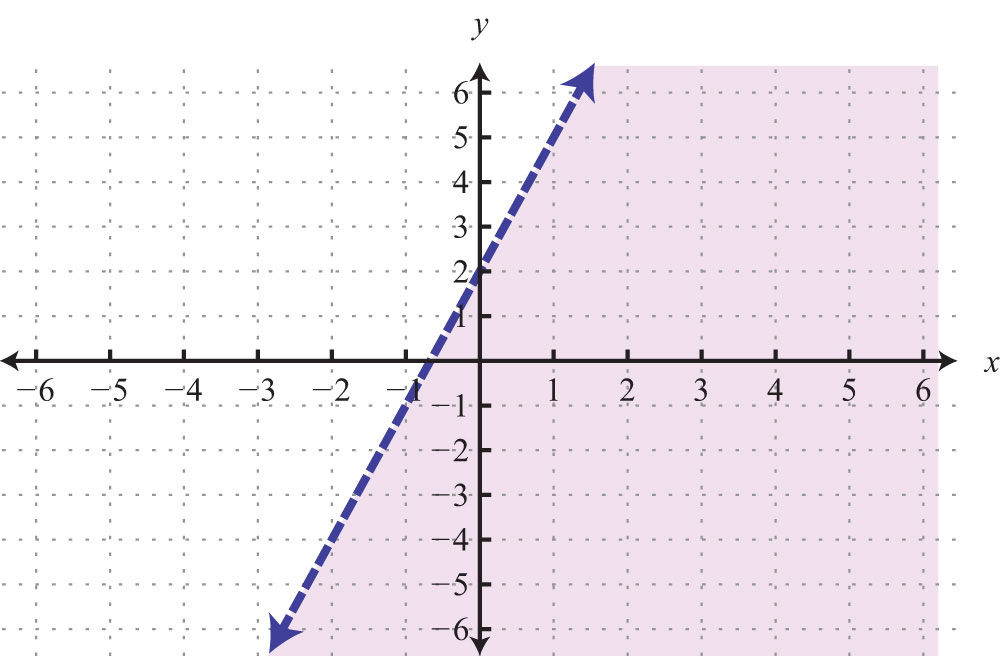
41:
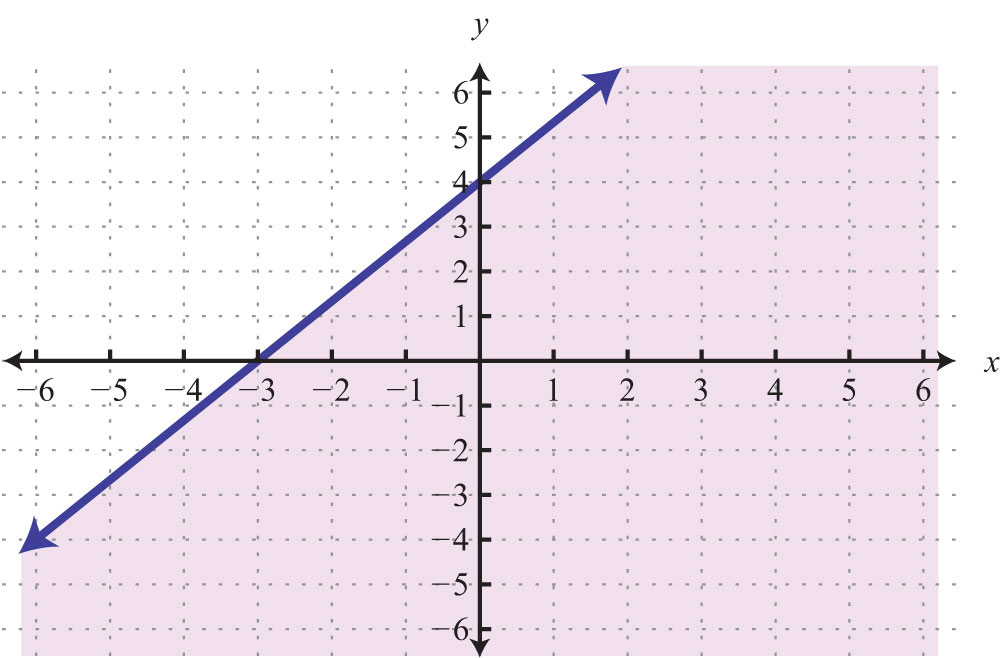
43:
45:
47:
3.9 Review Exercises and Sample Exam
Review Exercises
Rectangular Coordinate System
Graph the given set of ordered pairs.
1.
2.
3. Graph the points (−3, 5), (−3, −3), and (3, −3) on a rectangular coordinate plane. Connect the points and calculate the area of the shape.
4. Graph the points (−4, 1), (0, 1), (0, −2), and (−4, −2) on a rectangular coordinate plane. Connect the points and calculate the area of the shape.
5. Graph the points (1, 0), (4, 0), (1, −5), and (4, −5) on a rectangular coordinate plane. Connect the points and calculate the perimeter of the shape.
6. Graph the points (−5, 2), (−5, −3), (1, 2), and (1, −3) on a rectangular coordinate plane. Connect the points and calculate the perimeter of the shape.
Calculate the distance between the given two points.
7. (−1, −2) and (5, 6)
8. (2, −5) and (−2, −2)
9. (−9, −3) and (−8, 4)
10. (−1, 3) and (1, −3)
Calculate the midpoint between the given points.
11. (−1, 3) and (5, −7)
12. (6, −3) and (−8, −11)
13. (7, −2) and (−6, −1)
14. (−6, 0) and (0, 0)
15. Show algebraically that the points (−1, −1), (1, −3), and (2, 0) form an isosceles triangle.
16. Show algebraically that the points (2, −1), (6, 1), and (5, 3) form a right triangle.
Graph by Plotting Points
Determine whether the given point is a solution.
17. ;
18. ;
19. ;
20. ;
Find at least five ordered pair solutions and graph.
21.
22.
23.
24.
25.
26.
27.
28.
Graph Using Intercepts
Given the graph, find the x- and y- intercepts.
29.
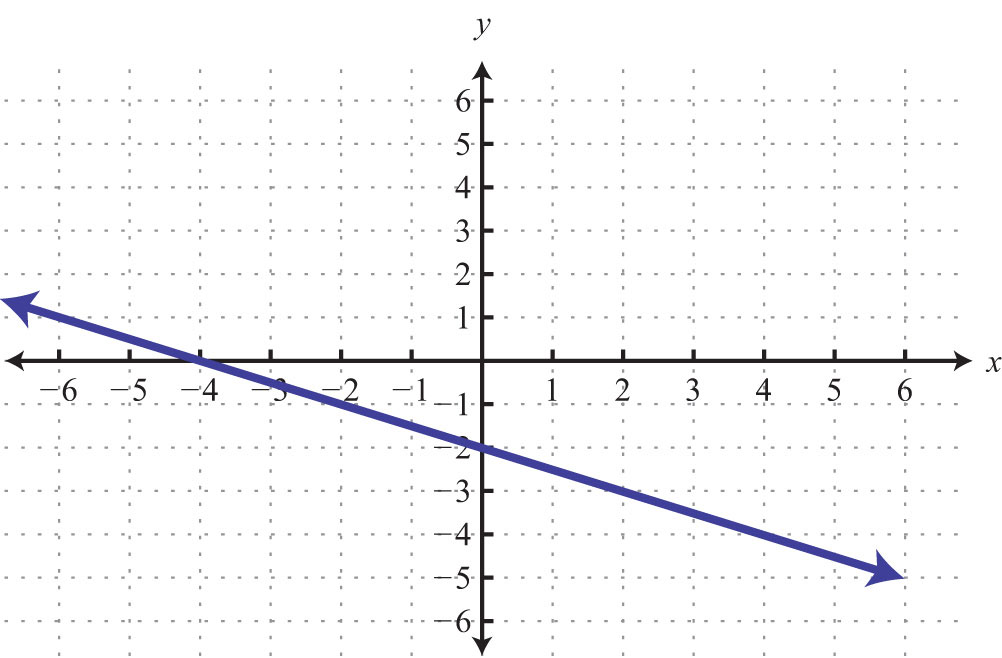
30.
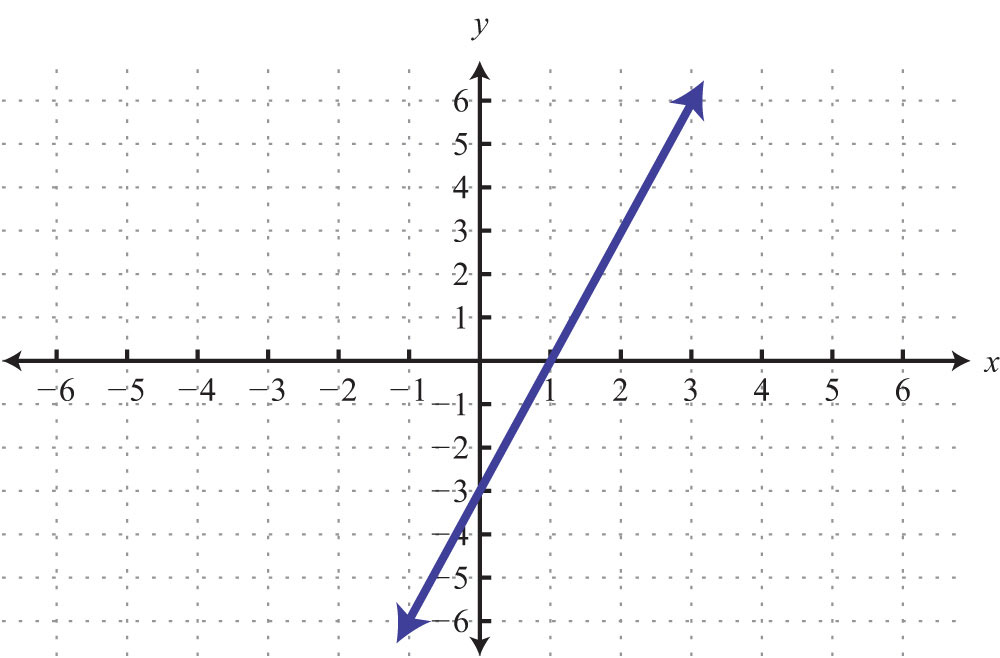
31.
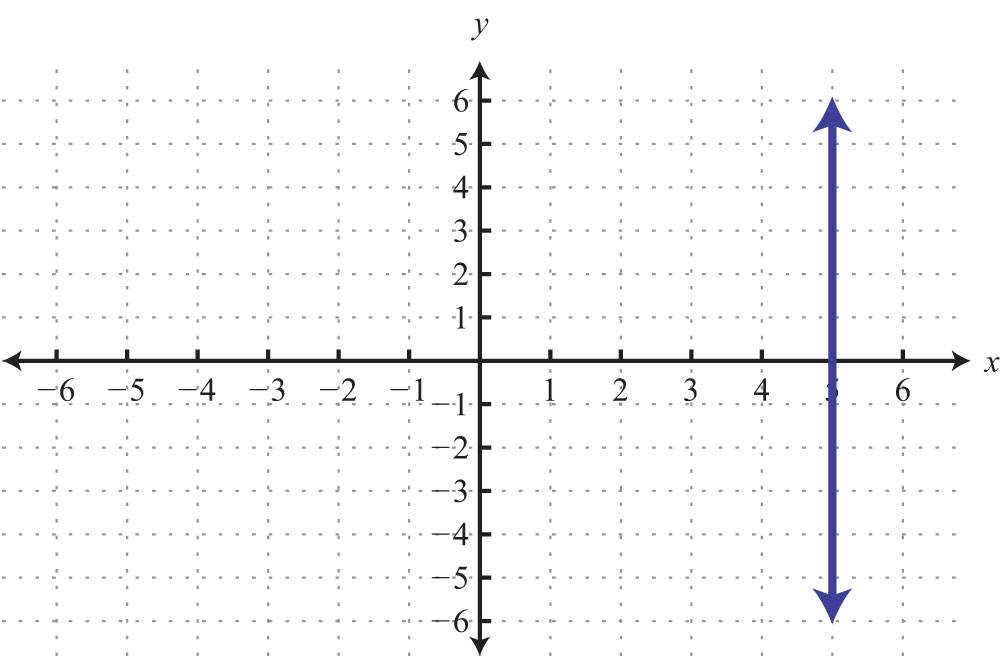
32.
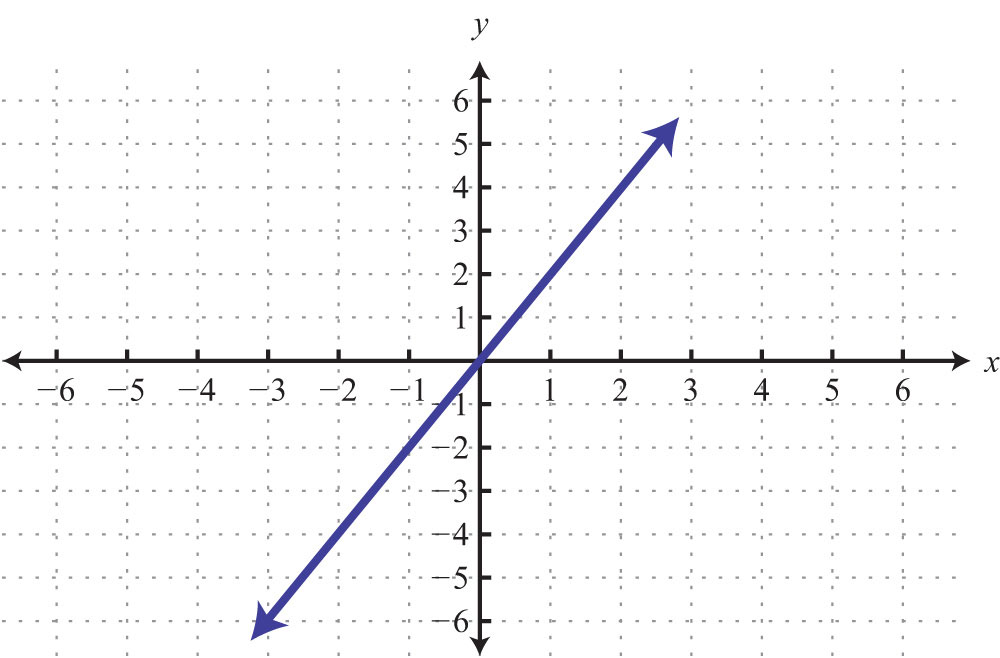
Find the intercepts and graph them.
33.
34.
35.
36.
37.
38.
Graph Using the y-Intercept and Slope
Given the graph, determine the slope and y-intercept.
39.

40.
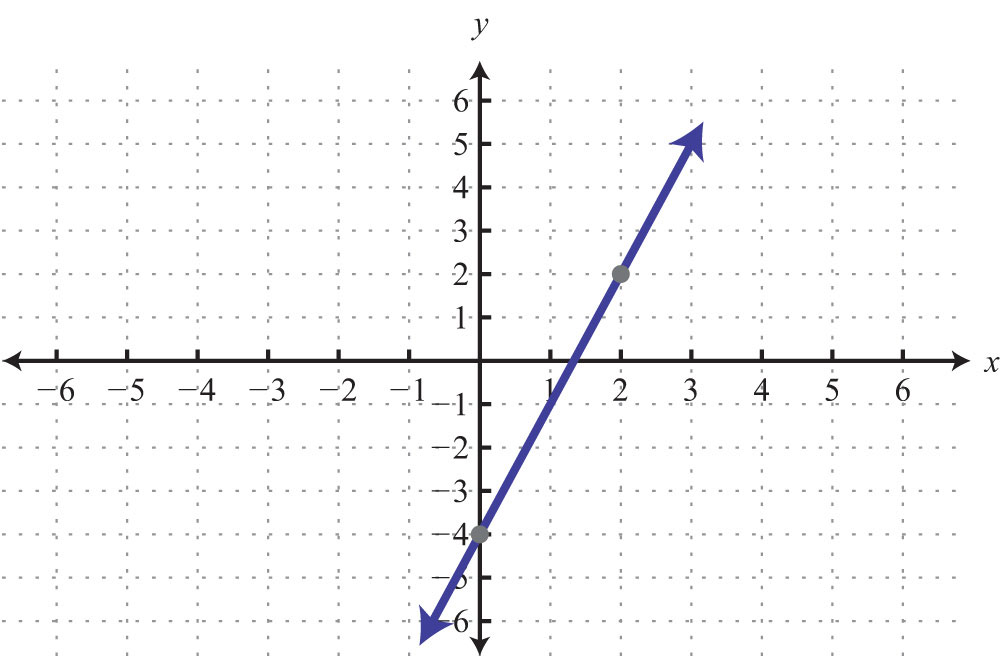
Determine the slope, given two points.
41. (−3, 8) and (5, −6)
42. (0, −5) and (−6, 3)
43. (1/2, −2/3) and (1/4, −1/3)
44. (5, −3/4) and (2, −3/4)
Express in slope-intercept form and identify the slope and y-intercept.
45.
46.
47.
48.
Graph using the slope and y-intercept.
49.
50.
51.
52.
53.
54.
55.
56.
Finding Linear Equations
Given the graph, determine the equation of the line.
57.
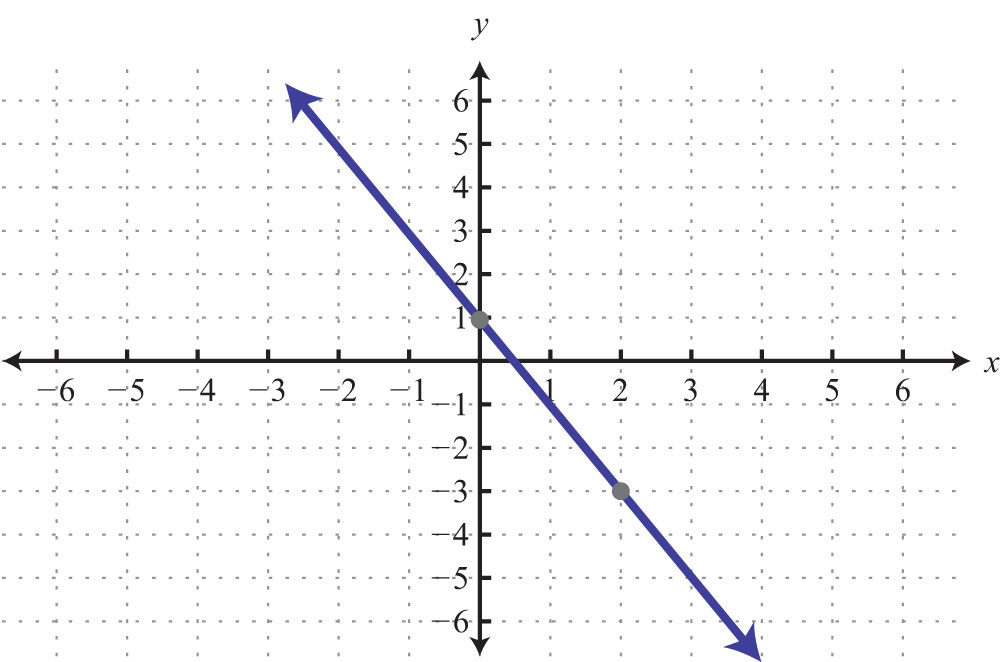
58.

59.
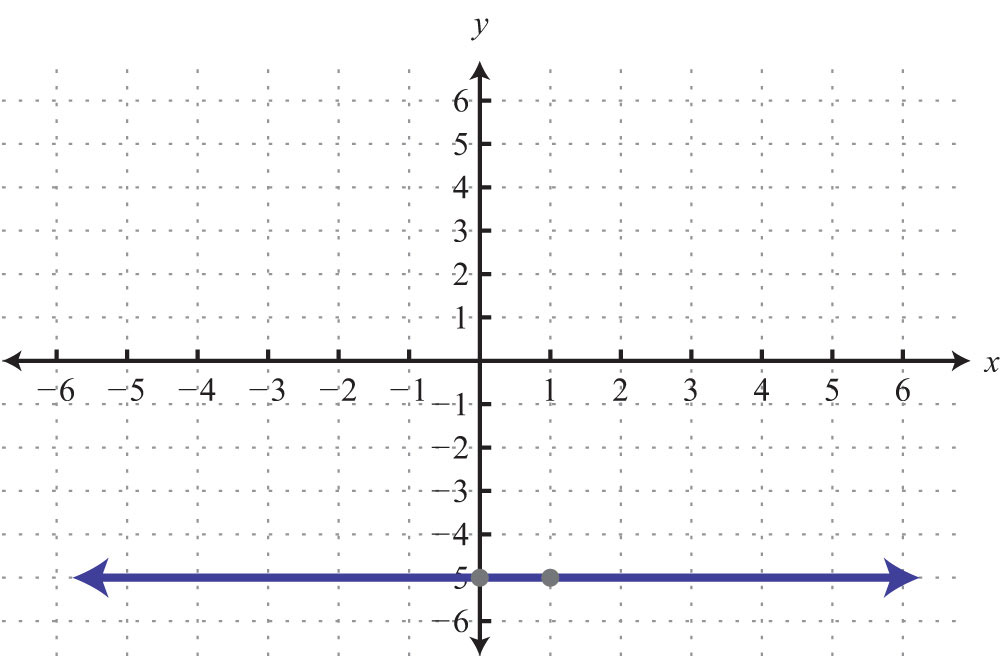
60.
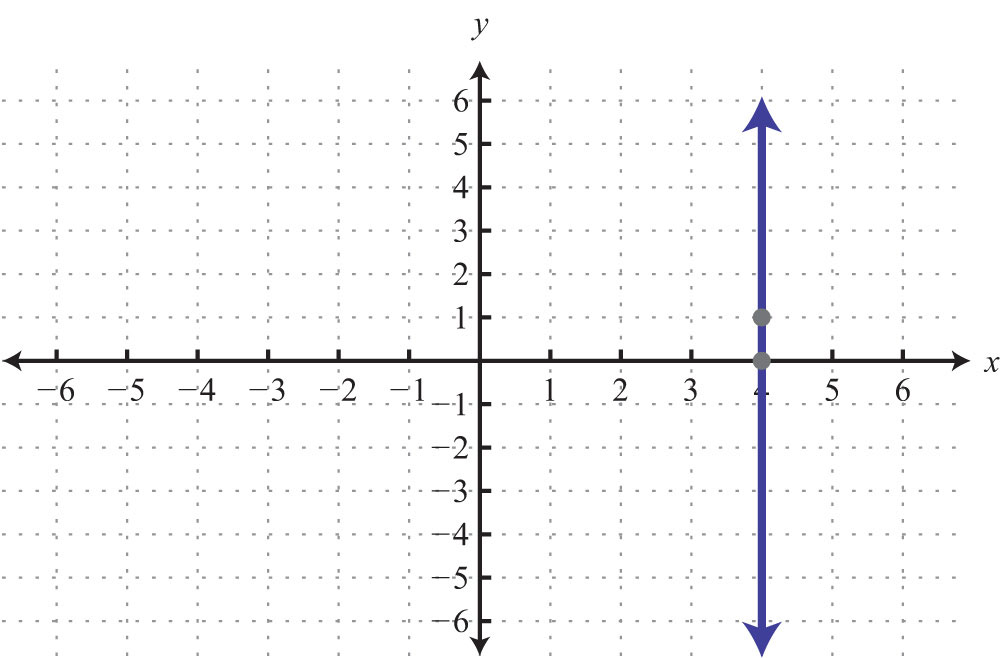
Find the equation of a line, given the slope and a point on the line.
61. m = 1/2; (−4, 8)
62. m = −1/5; (−5, −9)
63. m = 2/3; (1, −2)
64. m = −3/4; (2, −3)
Find the equation of the line given two points on the line.
65. (−5, −5) and (10, 7)
66. (−6, 12) and (3, −3)
67. (2, −1) and (−2, 2)
68. (5/2, −2) and (−5, 5/2)
69. (7, −6) and (3, −6)
70. (10, 1) and (10, −3)
Parallel and Perpendicular Lines
Determine if the lines are parallel, perpendicular, or neither.
71.
72.
73.
74.
Find the equation of the line in slope-intercept form.
75. Parallel to and passing through (−10, −1).
76. Parallel to and passing through (2, −2).
77. Perpendicular to and passing through (8, −1).
78. Perpendicular to and passing through (5, 1).
79. Parallel to and passing through (4, −1).
80. Perpendicular to and passing through (4, −1).
Introduction to Functions
Determine the domain and range and state whether it is a function or not.
81. {(−10, −1), (−5, 2), (5, 2)}
82. {(−12, 4), (−1, −3), (−1, −2)}
83.
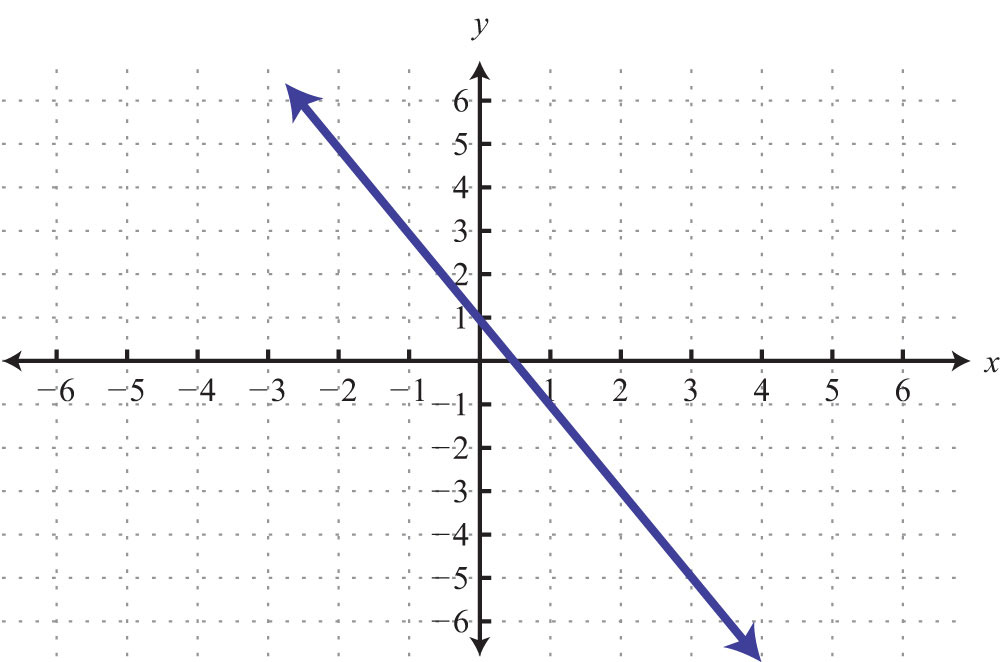
84.
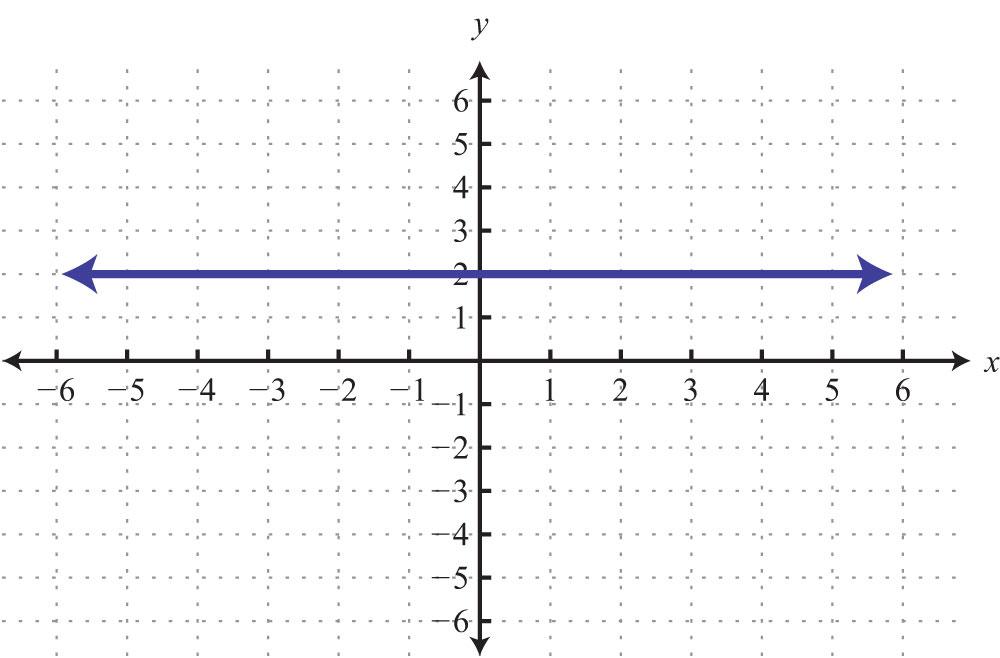
85.
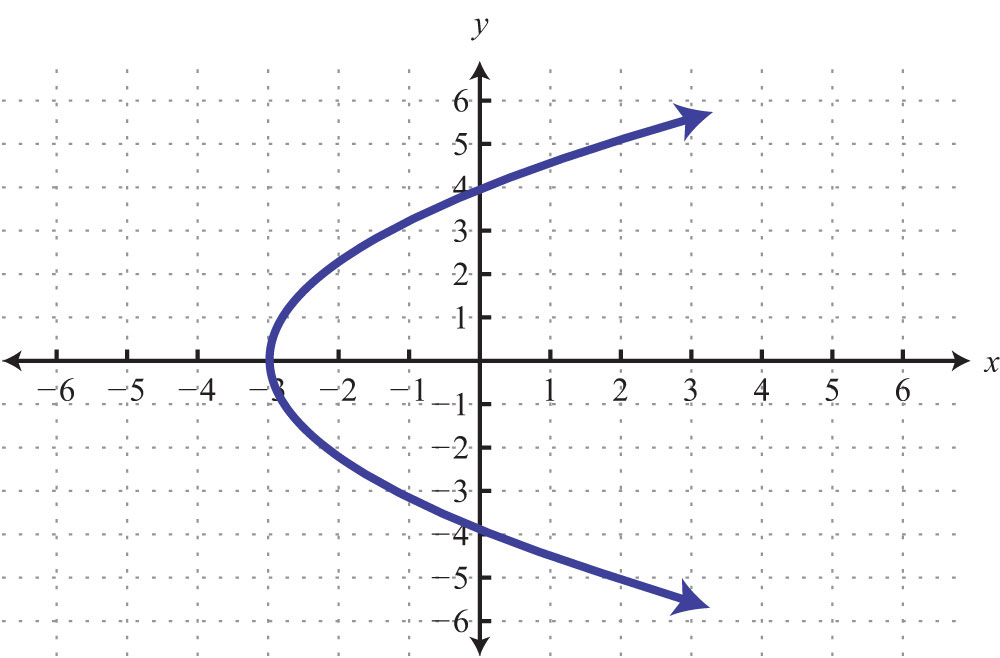
86.
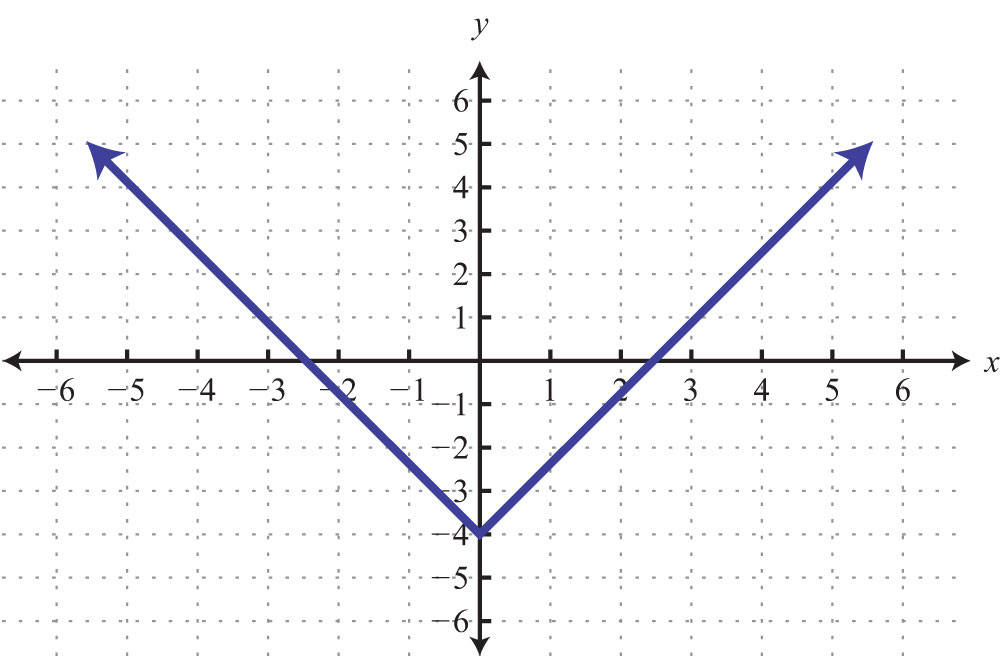
Given the following,
87. , find .
88. , find .
89. , find .
90. , find .
91. , find x when .
92. , find x when .
93. , find x when .
94. , find x when .
Given the graph of a function , determine the following.
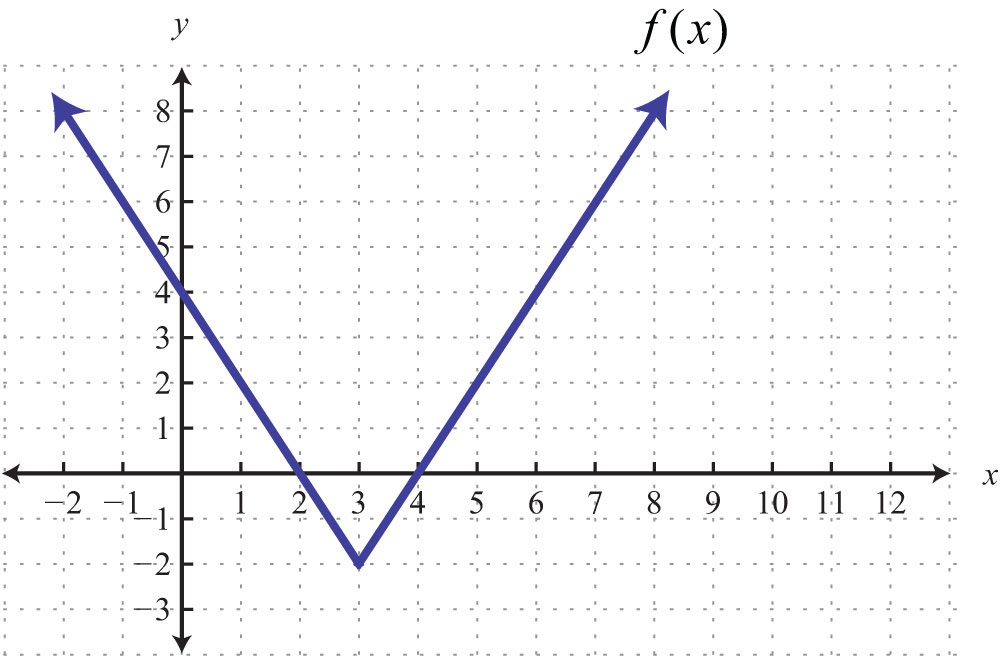
95.
96. x when
Linear Inequalities (Two Variables)
Is the ordered pair a solution to the given inequality?
97. ; (−3, −7)
98. ; (0, 2)
99. ; (5, −3)
100. ; (1, 4)
101. ; (−3, −1)
102. ; (−6, 4)
Graph the solution set.
103.
104.
105.
106.
107.
108.
Sample Exam
1. Graph the points (−4, −2), (−4, 1), and (0, −2) on a rectangular coordinate plane. Connect the points and calculate the area of the shape.
2. Is (−2, 4) a solution to ? Justify your answer.
Given the set of x-values {−2, −1, 0, 1, 2}, find the corresponding y-values and graph the following.
3.
4.
5. On the same set of axes, graph and . Give the point where they intersect.
Find the x- and y-intercepts and use those points to graph the following.
6.
7.
8. Calculate the slope of the line passing through (−4, −5) and (−3, 1).
Determine the slope and y-intercept. Use them to graph the following.
9.
10.
11. Given , determine .
12. Are the given lines parallel, perpendicular, or neither?
13. Determine the slope of the given lines.
a.
b.
c. Are these lines parallel, perpendicular, or neither?
15. Determine the equation of the line with slope passing through (8, 1).
16. Find the equation to the line passing through (−2, 3) and (4, 1).
17. Find the equation of the line parallel to passing through (−1, −2).
18. Find the equation of the line perpendicular to passing through (1/2, 5).
Given a linear function , determine the following.
19.
20. x when
21. Graph the solution set: .
22. Graph the solution set: .
23. A rental car company charges $32.00 plus $0.52 per mile driven. Write an equation that gives the cost of renting the car in terms of the number of miles driven. Use the formula to determine the cost of renting the car and driving it 46 miles.
24. A car was purchased new for $12,000 and was sold 5 years later for $7,000. Write a linear equation that gives the value of the car in terms of its age in years.
25. The area of a rectangle is 72 square meters. If the width measures 4 meters, then determine the length of the rectangle.
Review Exercises Answers
1:
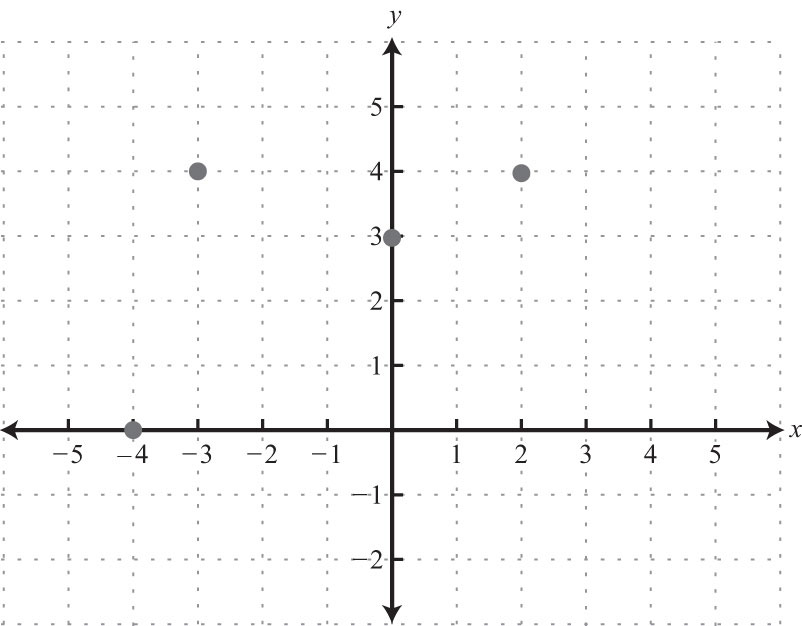
3: Area: 24 square units
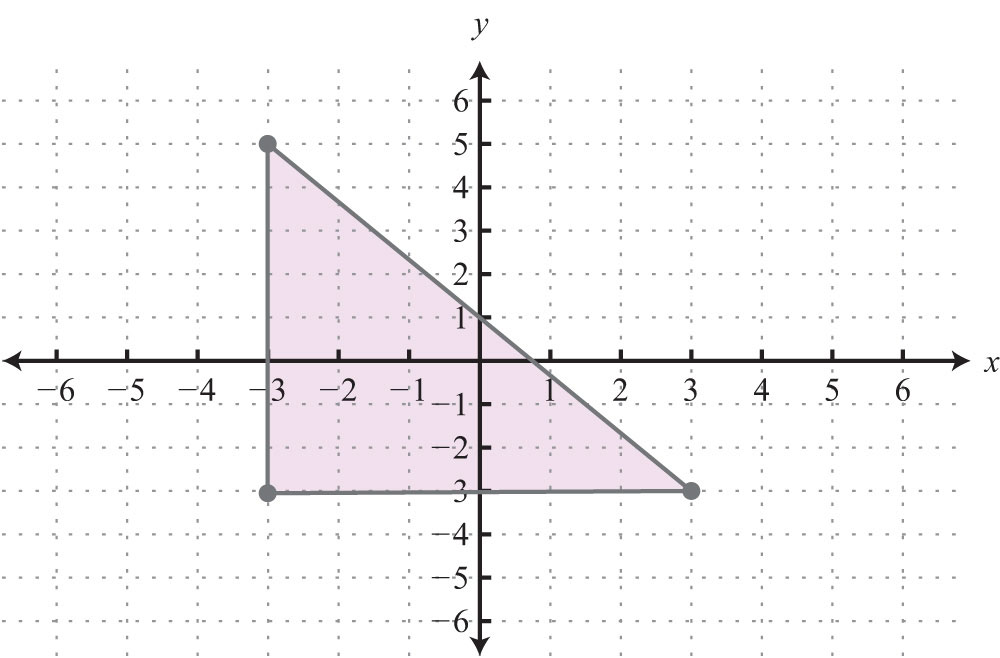
5: Perimeter: 16 units
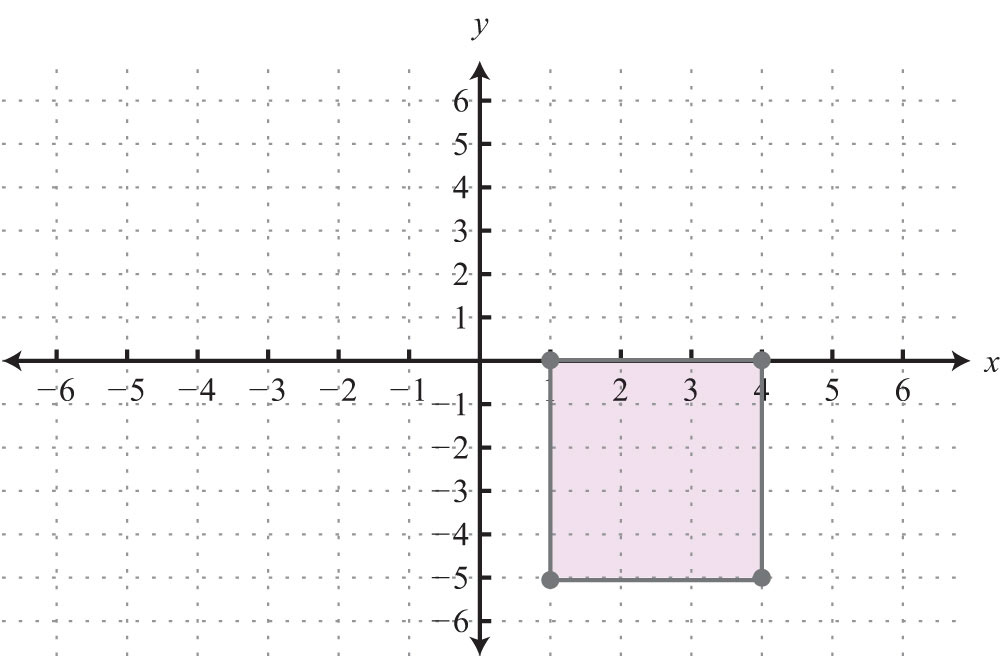
7: 10 units
9: units
11: (2, −2)
13: (1/2, −3/2)
17: No
19: Yes
21:
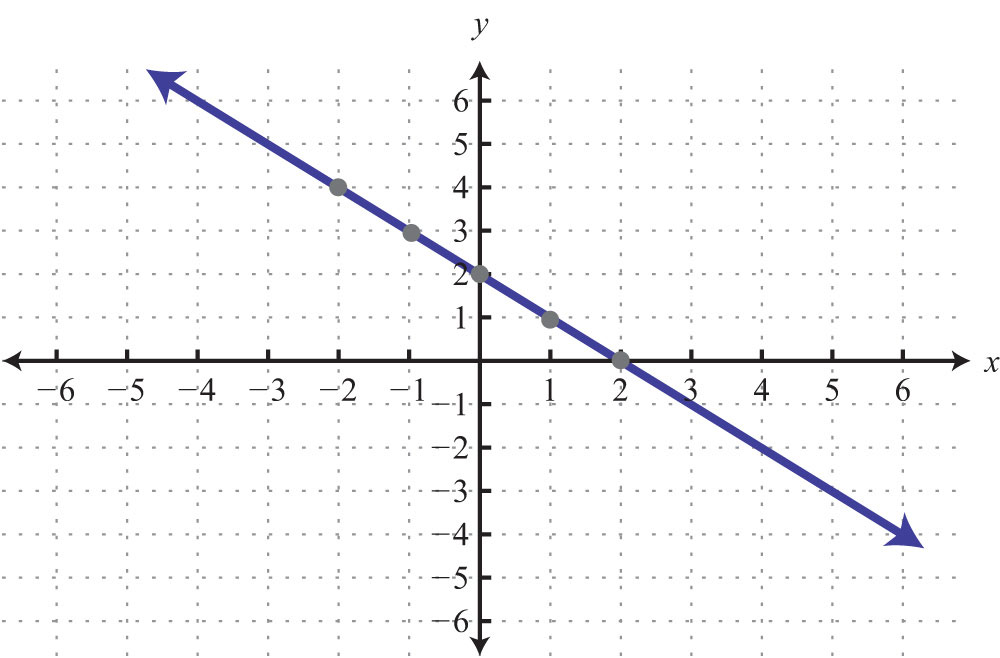
23:
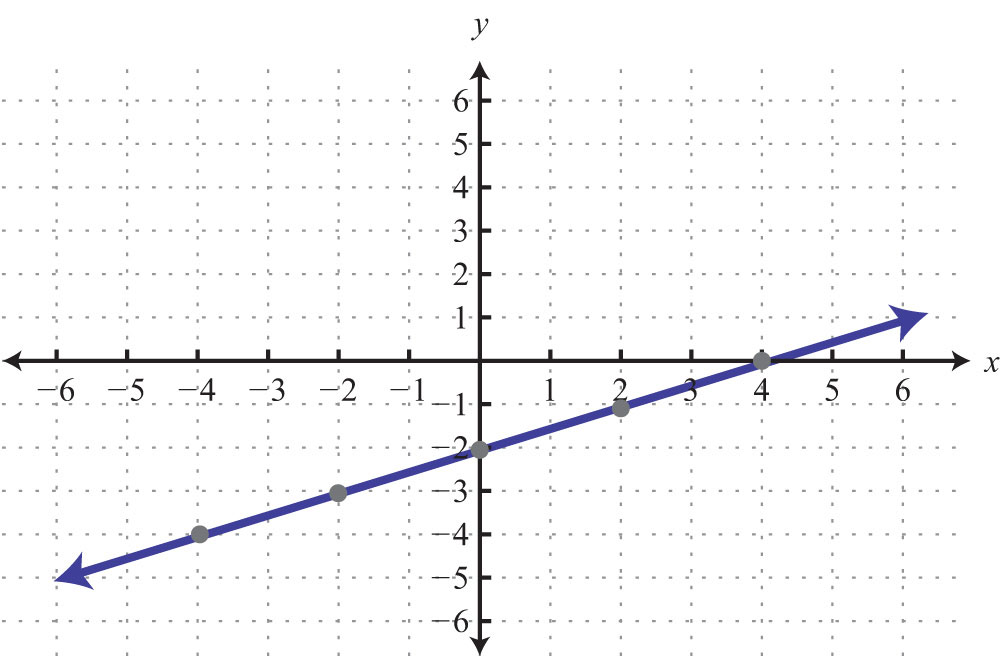
25:

27:
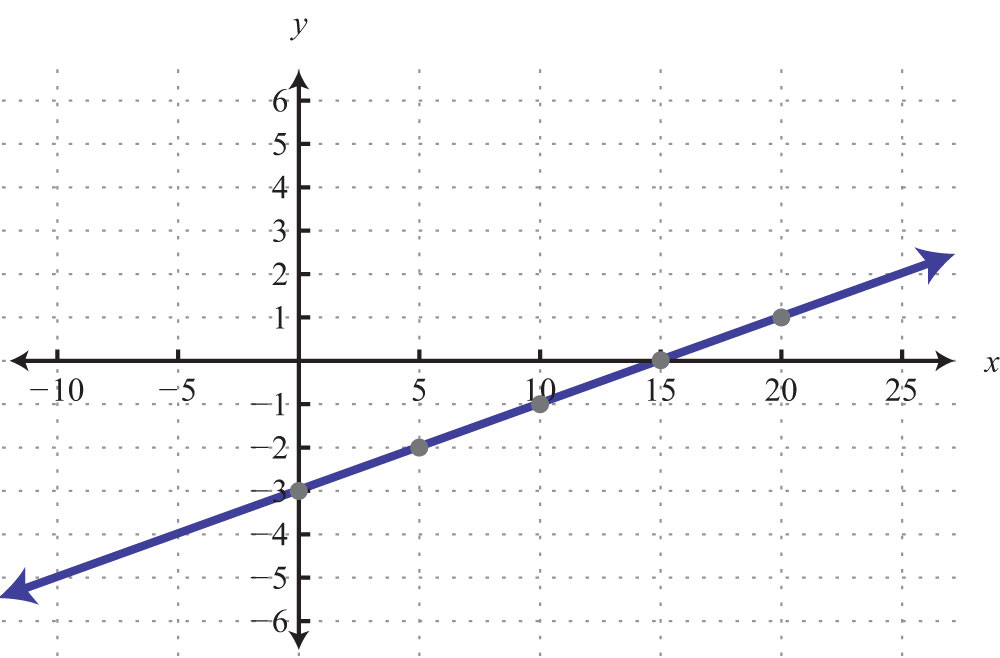
29: y-intercept: (0, −2); x-intercept: (−4, 0)
31: y-intercept: none; x-intercept: (5, 0)
33:
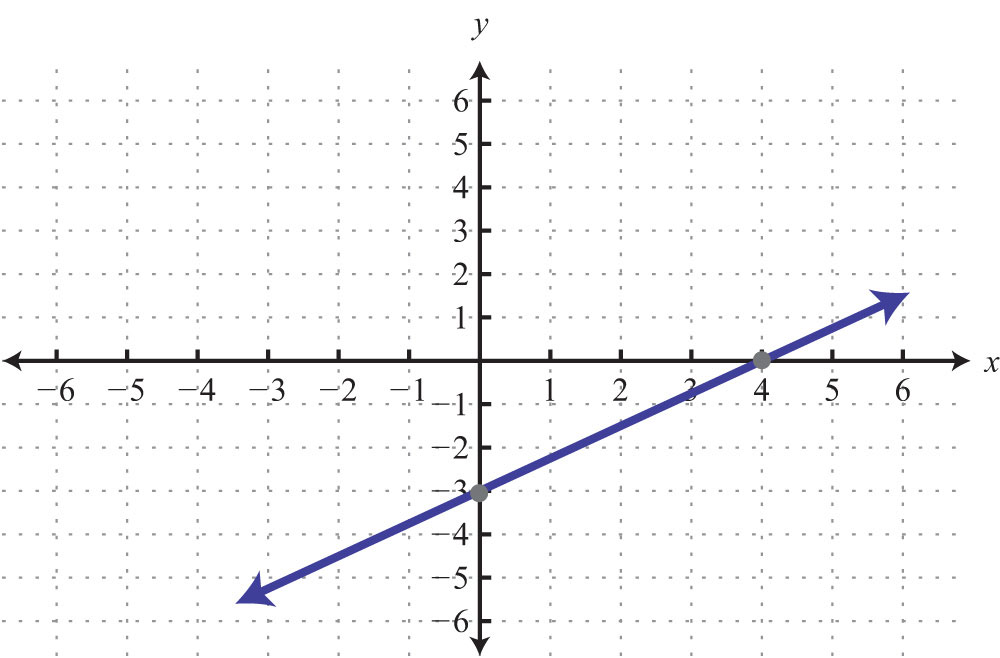
35:
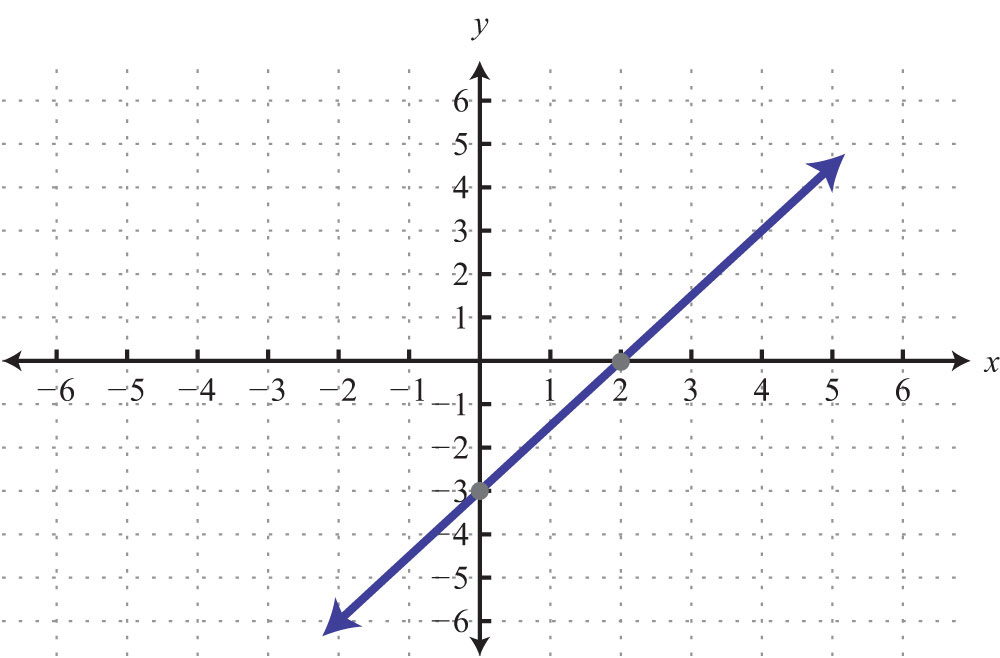
37:
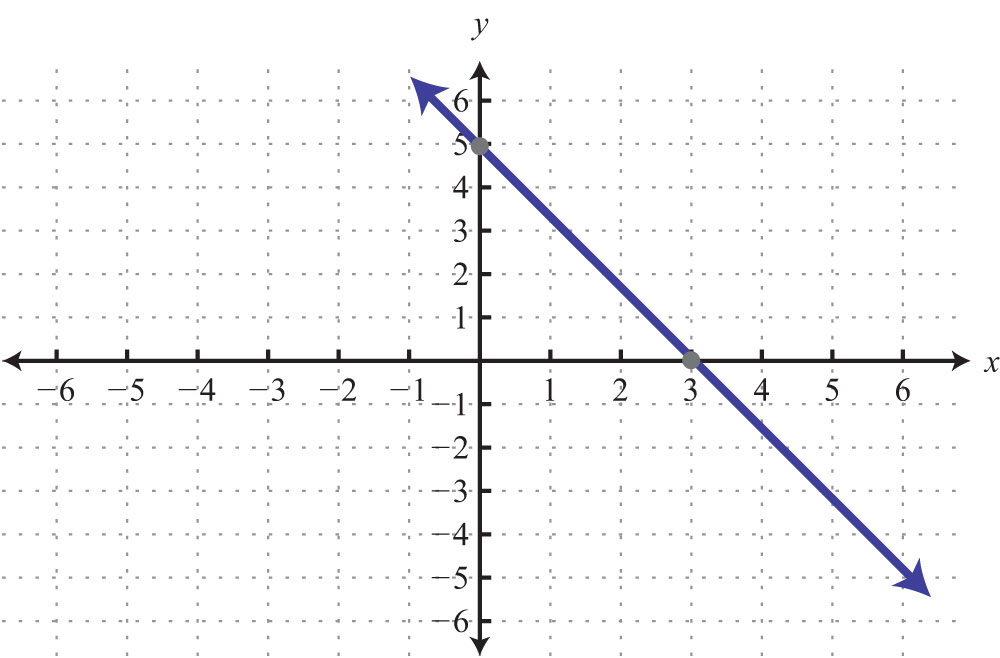
39: y-intercept: (0, 1); slope: −2
41: −7/4
43: −4/3
45: ; slope: 3; y-intercept (0, −2)
47: ; slope: 4/9; y-intercept (0, 4/3)
49:
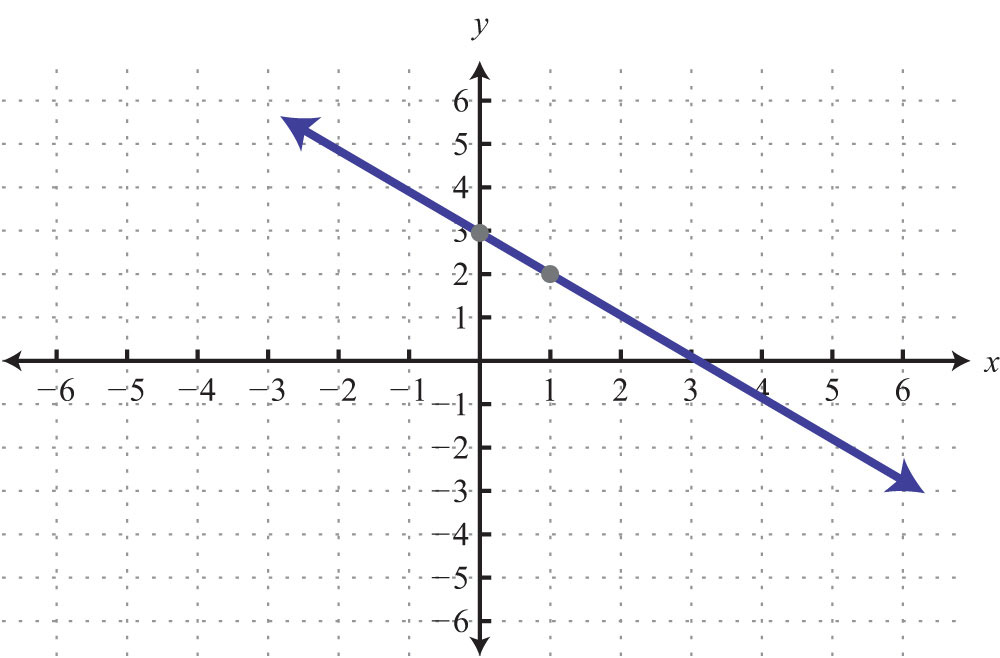
51:
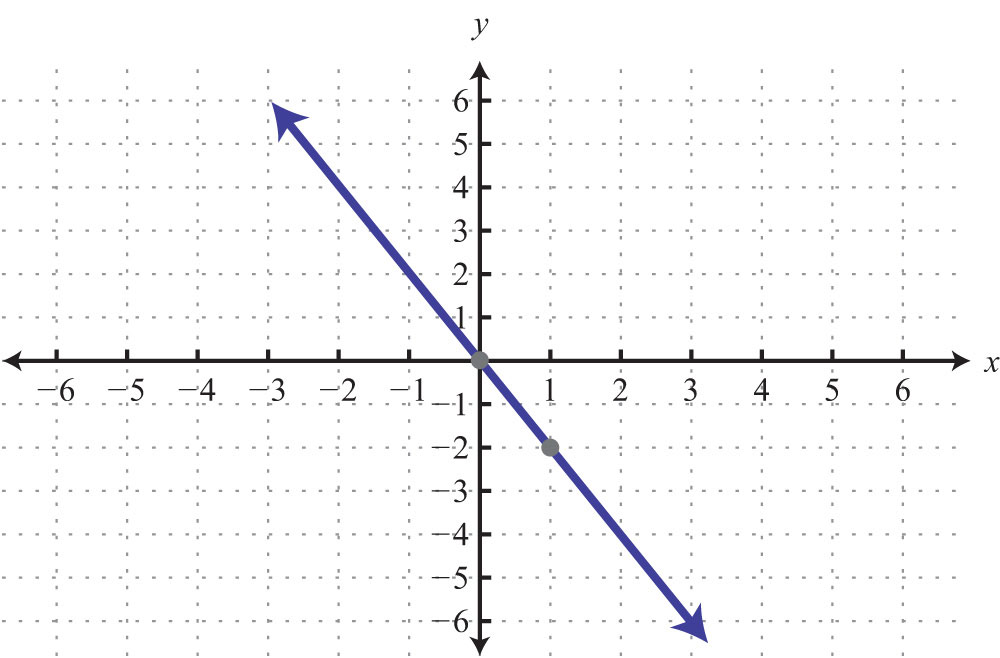
53:
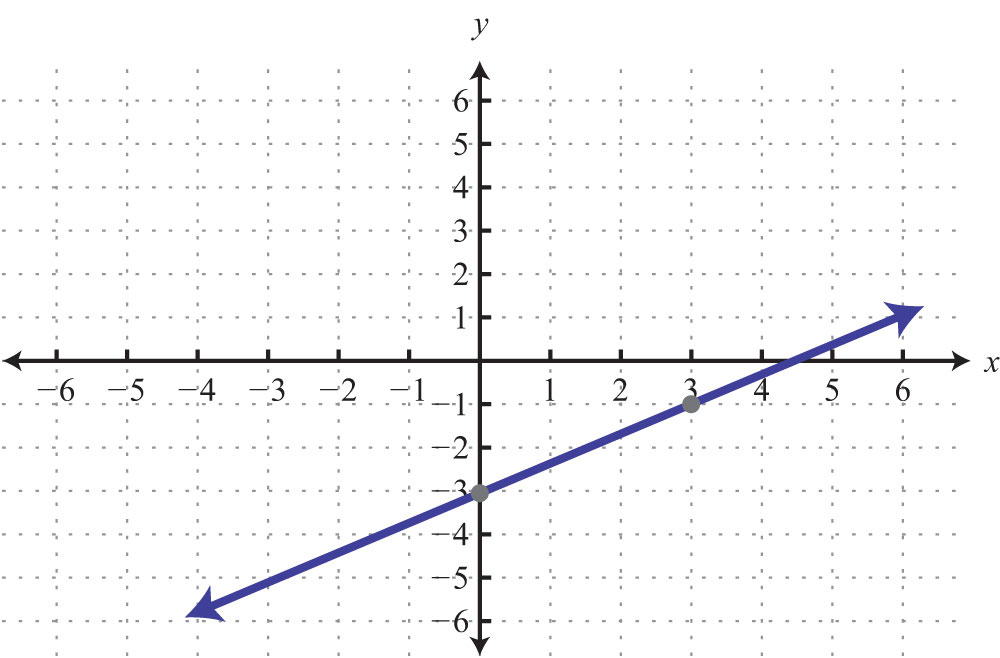
55:
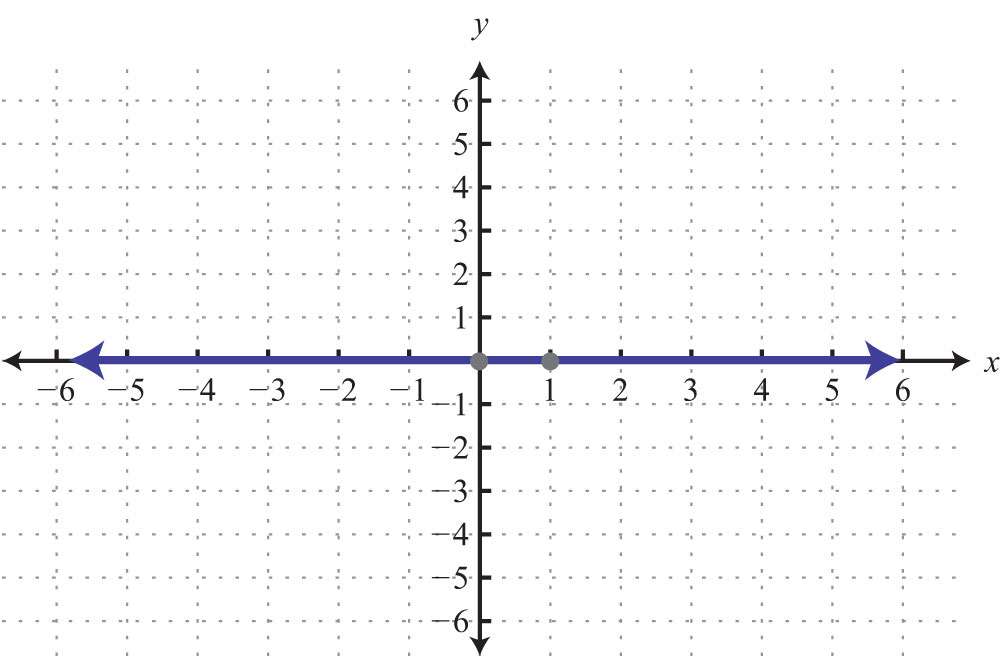
57:
59:
61:
63:
65:
67:
69:
71: Parallel
73: Perpendicular
75:
77:
79:
81: Domain: {−10, −5, 5}; range: {−1, 2}; function: yes
83: Domain: R; range: R; function: yes
85: Domain: ; range: R; function: no
87:
89:
91:
93:
95:
97: Yes
99: No
101: No
103:
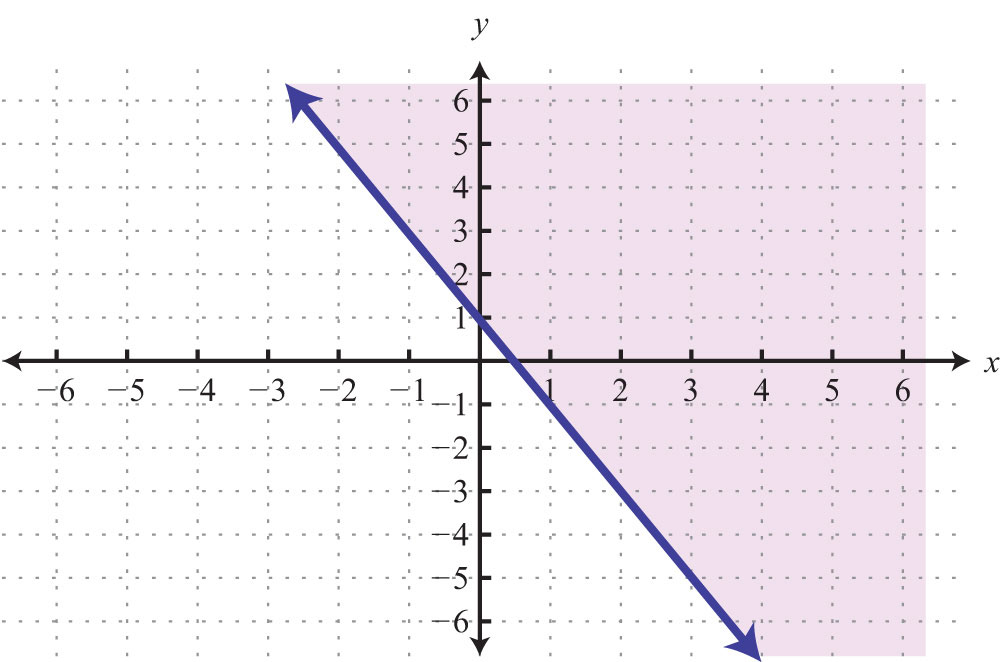
105:

107:
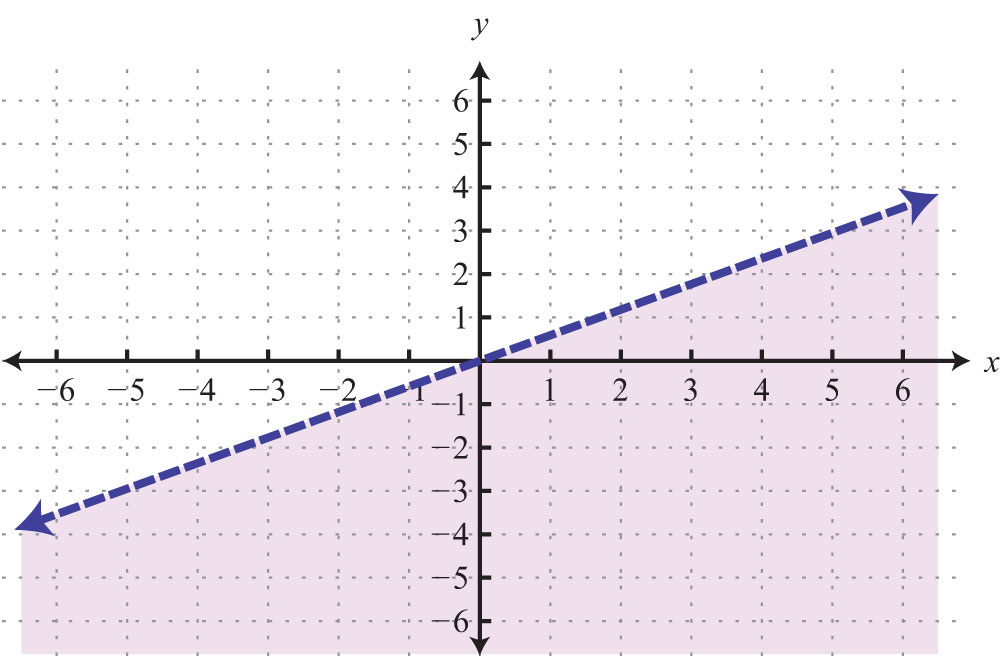
Sample Exam Answers
1: Area: 6 square units
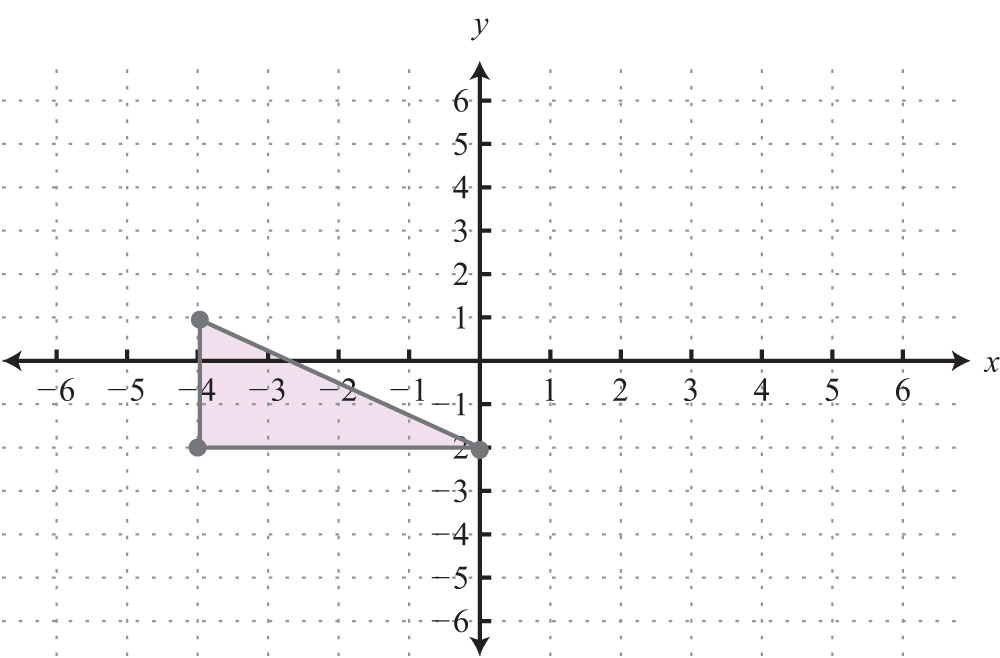
3:
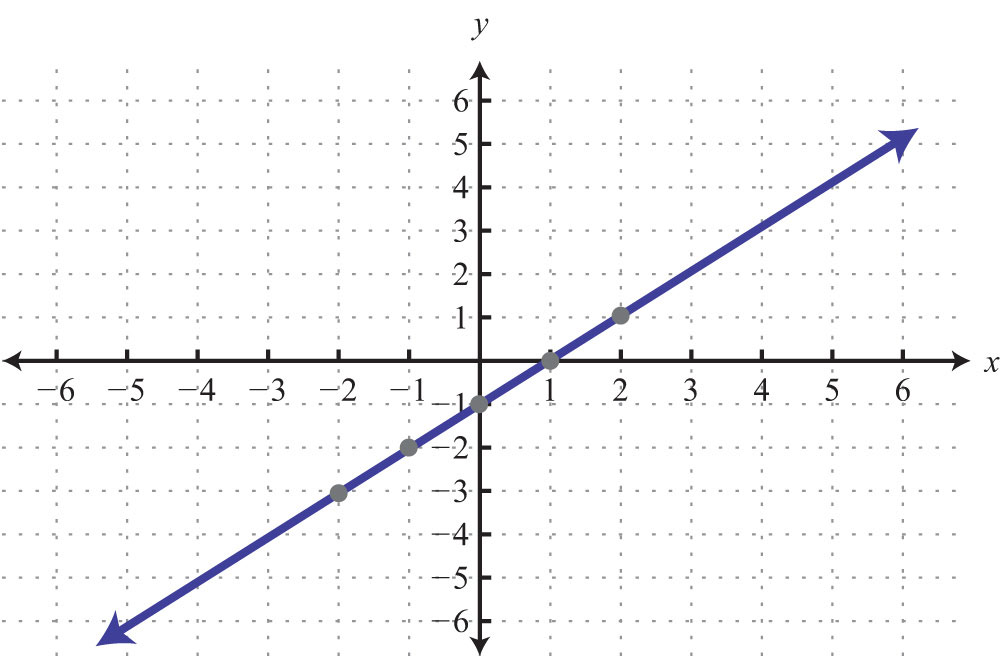
5: Intersection: (−3, 4)
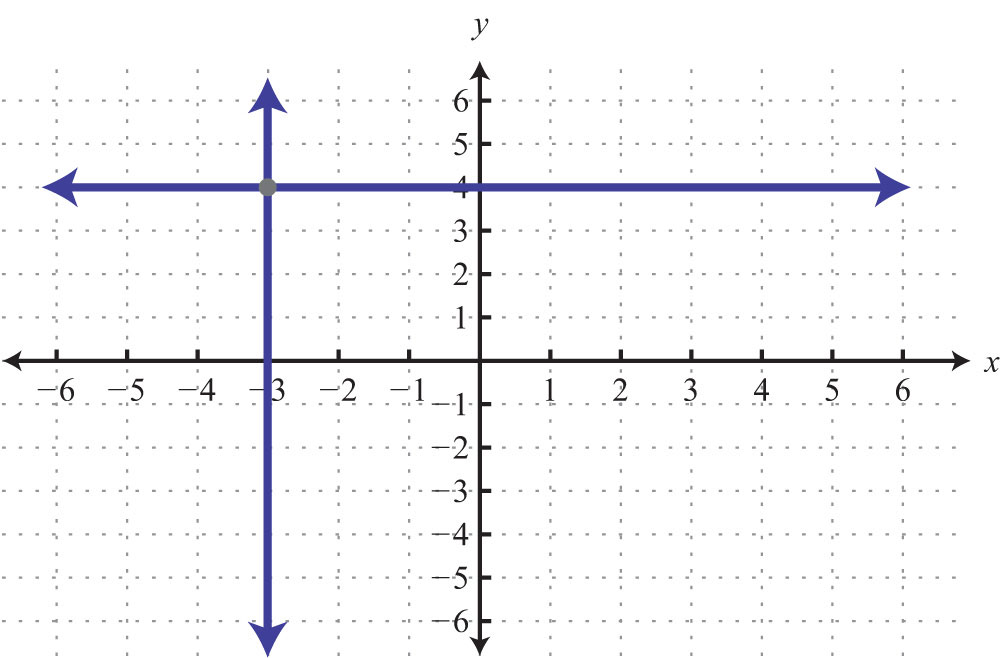
7:
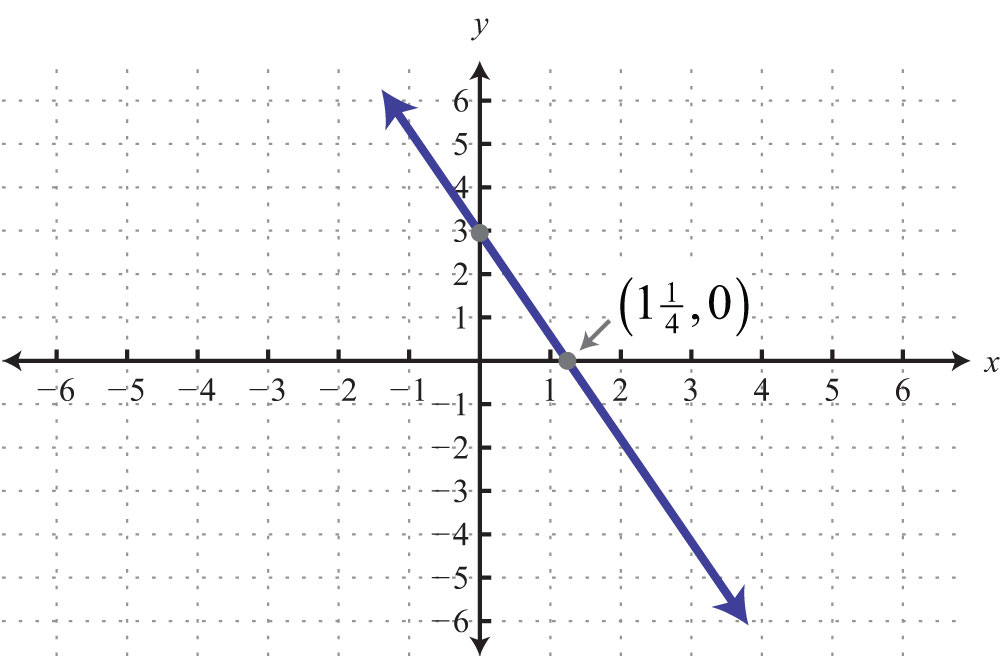
9: Slope: −3/2; y-intercept: (0, 6)
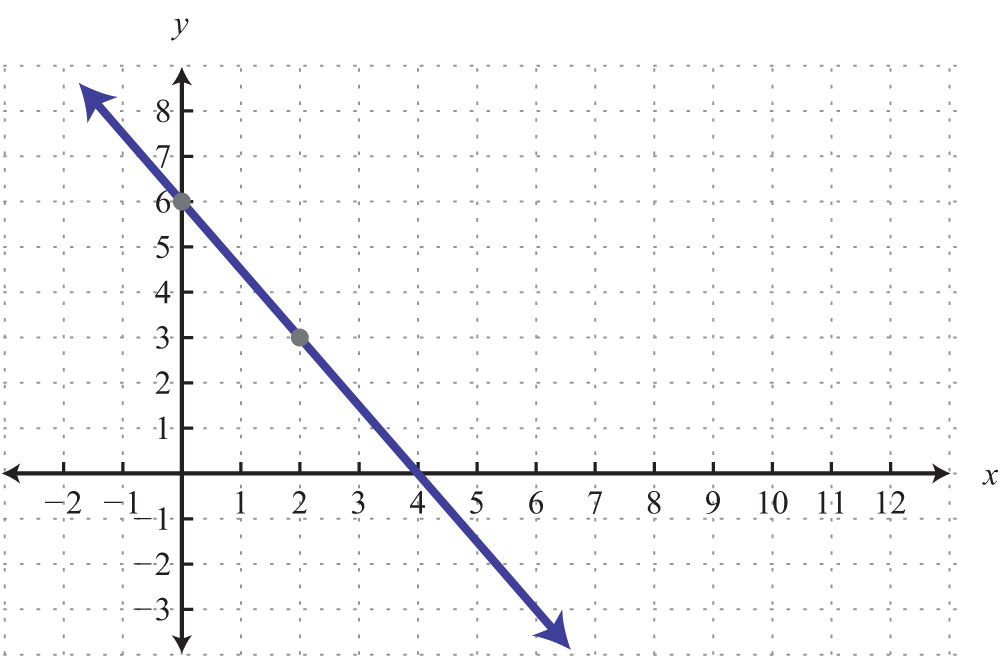
11:
13:a. 0; b. Undefined; c. Perpendicular
15:
17:
19:
21:
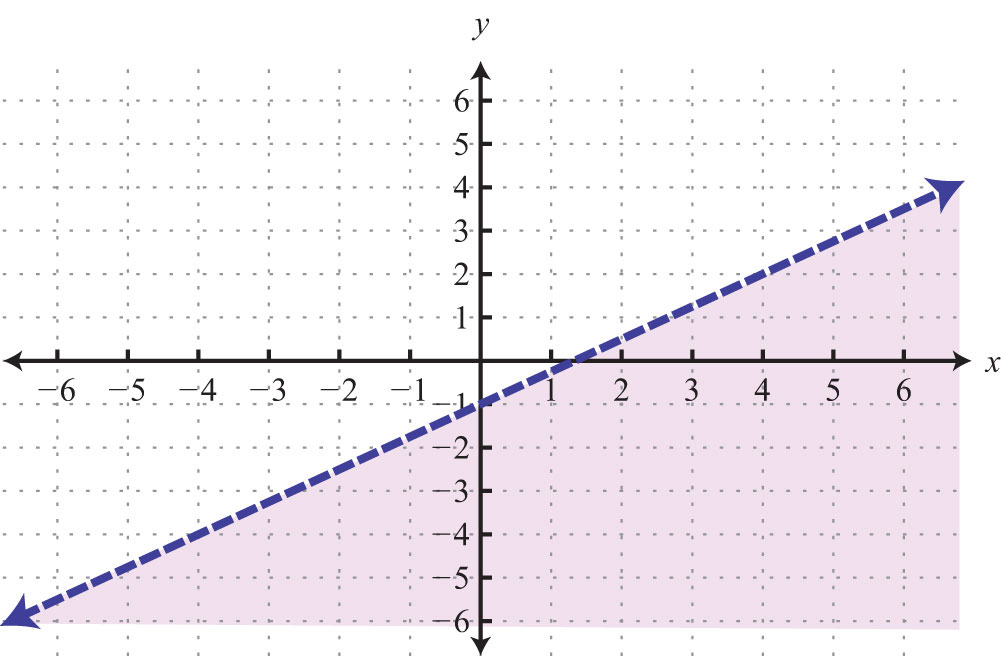
23: ; $55.92
25: 18 meters