This is “Understanding Securities Markets”, section 13.5 from the book An Introduction to Business (v. 1.0). For details on it (including licensing), click here.
For more information on the source of this book, or why it is available for free, please see the project's home page. You can browse or download additional books there. To download a .zip file containing this book to use offline, simply click here.


13.5 Understanding Securities Markets
Learning Objectives
- Show how the securities market operates and how it’s regulated.
- Understand how market performance is measured.
So, before long, you’re a public company. Fortunately, because your degree in finance comes with a better-than-average knowledge of financial markets, you’re familiar with the ways in which investors will evaluate your company. Investors will look at the overall quality of the company and ask some basic questions:
- How well is it managed?
- Is it in a growing industry? Is its market share increasing or decreasing?
- Does it have a good line of products? Is it coming out with innovative products?
- How is the company doing relative to its competitors?
- What is its future? What is the future of its industry?
Investors also analyze the company’s performance over time and ask more-specific questions:
- Are its sales growing?
- Is its income going up?
- Is its stock price rising or falling?
- Are earnings per share rising?
They’ll assess the company’s financial strength, asking another series of specific questions:
- Can it pay its bills on time?
- Does it have too much debt?
- Is it managing its productive assets (such as inventory) efficiently?
Primary and Secondary Markets and Stock Exchanges
Security markets serve two functions:
- They help companies to raise funds by making the initial sale of their stock to the public.
- They provide a place where investors can trade already issued stock.
When you went through your IPO, shares were issued through a primary marketMarket that deals in the sale of newly issued securities.—a market that deals in new financial assets. As we’ve seen, the sale was handled by an investment banking firm, which matched you, as a corporation with stock to sell, with investors who wanted to buy it.
Organized Exchanges
After a certain time elapsed, investors began buying and selling your stock on a secondary marketMarket in which investors buy previously issued securities from other investors.. The proceeds of sales on this market go to the investor who sells the stock, not to your company. The best-known of these markets is the New York Stock Exchange (NYSE)Best-known stock market where stocks of the largest, most prestigious corporations are traded., where the stocks of the largest, most prestigious corporations in the world are traded. Other exchanges, including the American Stock Exchange (AMEX)Stock market where shares of smaller companies are traded. and regional exchanges located in places like Chicago and Boston, trade the stock of smaller companies.
OTC Markets
Note that a “market” doesn’t have to be a physical location. In the over-the-counter (OTC) marketMarket in which securities are traded over computer networks and phones rather than on the trading floor of an exchange., securities are traded among dealers over computer networks or by phone rather than on the floor of an organized exchange. Though there are exceptions, stocks traded in the OTC market are generally those of smaller (and often riskier) companies. The best-known OTC electronic-exchange system is the NASDAQBest-known over-the-counter, electronic exchange system. (National Association of Securities Dealers Automated Quotation system). It’s home to almost five thousand corporations, many of them technology companies. Unlike other OTC markets, the NASDAQ lists a variety of companies, ranging from small start-ups to such giants as Microsoft and Intel.
Regulating Securities Markets: The SEC
Because it’s vital that investors have confidence in the securities markets, Congress created the Securities and Exchange Commission (SEC)Government agency that enforces securities laws. in 1934. The SEC is charged with enforcing securities laws designed to promote full public disclosure, protecting investors against misconduct in the securities markets, and maintaining the integrity of the securities markets.U.S. Securities and Exchange Commission, http://www.sec.gov (accessed May 30, 2006).
Before offering securities for sale, the issuer must register its intent to sell with the SEC. In addition, the issuer must provide prospective buyers with a prospectusWritten offer to sell securities that provides useful information to prospective buyers.—a written offer to sell securities that describes the business and operations of the issuer, lists its officers, provides financial information, discloses any pending litigation, and states the proposed use of funds from the sale.
The SEC also enforces laws against insider tradingPractice of buying or selling of securities using important information about the company before it’s made public.—the illegal buying or selling of its securities by a firm’s officers and directors or anyone else taking advantage of valuable information about the company before it’s made public. The intent of these laws is to prevent insiders from profiting at the expense of other investors.
Measuring Market Performance: Market Indexes
Throughout the day, you can monitor the general drift of the stock market by watching any major news network and following the band at the bottom of your TV. News channels and broadcasts generally feature a market recap in the evening. Even music-oriented radio stations break for a minute of news every now and then, including a quick review of the stock market. Almost all these reports refer to one or more of the market indexesMeasure for tracking stock prices. with which investors can track trends in stock price. Let’s look more closely at some of these indicators.
The Dow
By far the most widely reported market index is the Dow Jones Industrial Average (DJIA)Market index that reflects the total value of a “market basket” of thirty large U.S. companies., or “the Dow.” The Dow is the total value of a “market basket” of thirty large companies headquartered in the United States. They aren’t the thirty largest or best-performing companies, but rather a group selected by the senior staff members at the Wall Street Journal to represent a broad spectrum of the U.S. economy, as well as a variety of industries. The thirty selected stocks change over time, but the list usually consists of household names, such as AT&T, Coca-Cola, Disney, IBM, General Electric, and Wal-Mart.
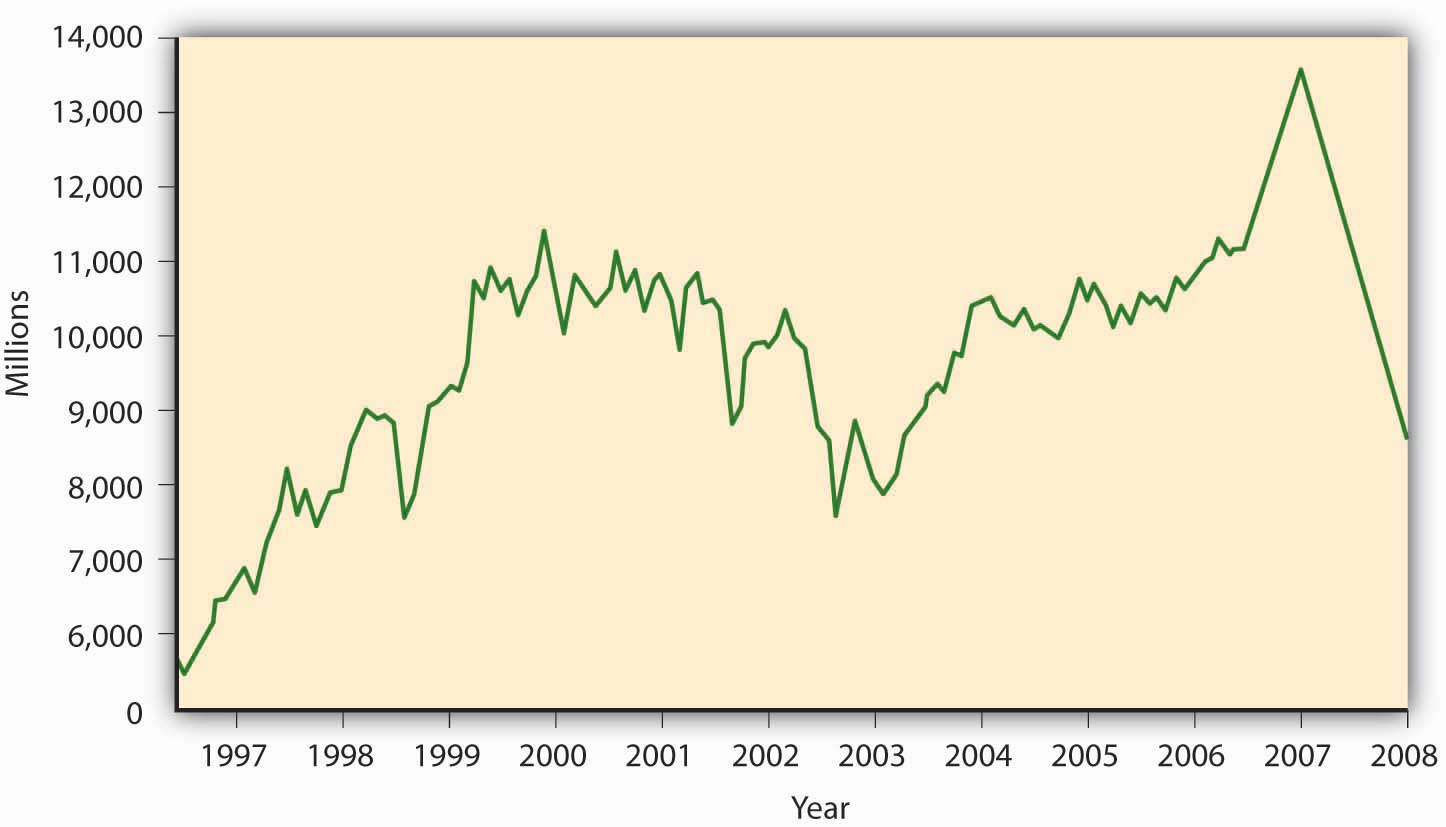
The graph in Figure 13.9 "DJIA for Ten-Year Period Ended May 2008" tracks the Dow for the ten-year period ended May 2008. The market measured by the Dow was on an upward swing from 1996 until 2000. At that point, it headed down until it reached its low point in 2002 and started its rebound. The path of the DOW during this ten-year period has been volatile (subject to up and down movements in response to unstable worldwide economic and political situations). Then came the big plunge—in 2008 the Dow declined by 34 percent.
Figure 13.9 DJIA for Ten-Year Period Ended May 2008
The NASDAQ Composite and the S&P 500
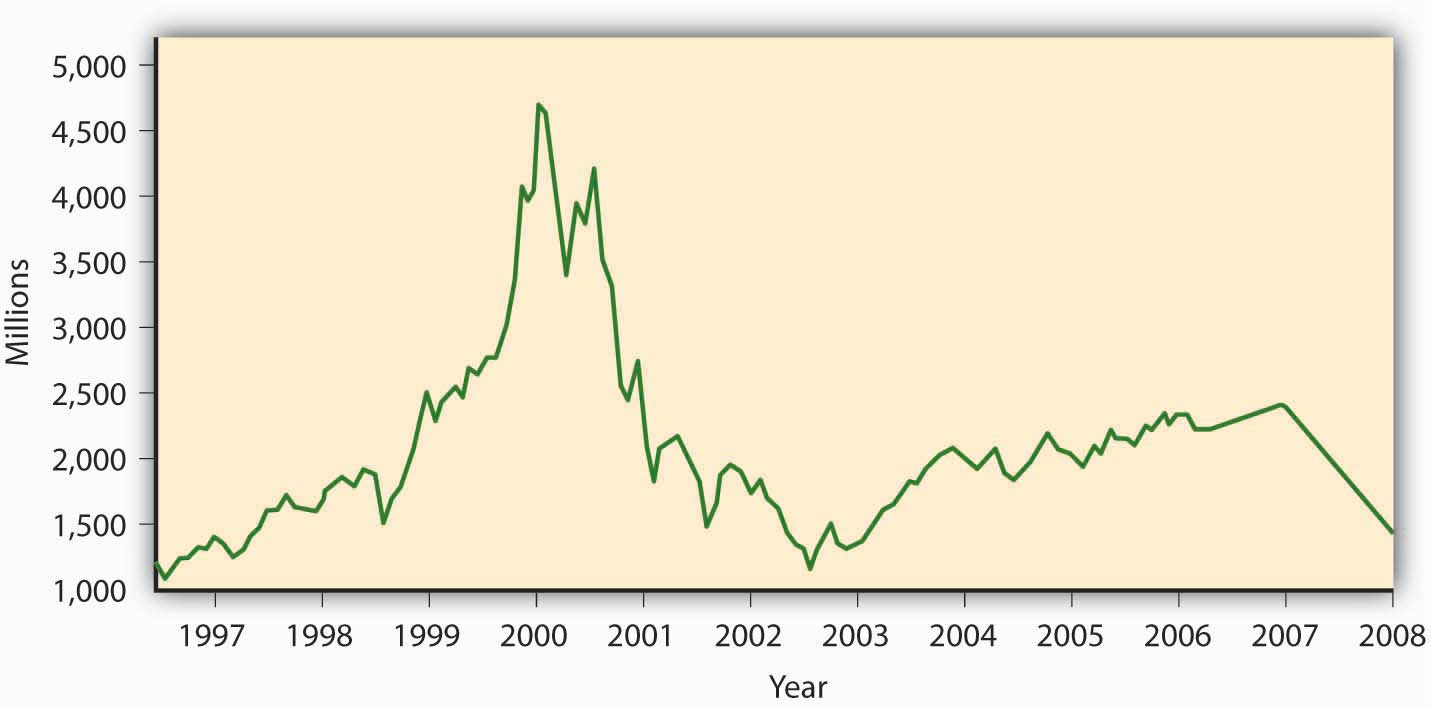
Also of interest is the performance of the NASDAQ Composite IndexMarket index of all stocks listed on the NASDAQ Stock Exchange., which includes many technology companies. Note in Figure 13.10 "NASDAQ for Ten-Year Period Ended May 2008" that the NASDAQ peaked in early 2000 at an index of over 5,000, but as investors began reevaluating the prospects of many technologies and technology companies, prices fell precipitously. Difficult economic times in 2008 spelled trouble for the NASDAQ composite index, and it declined by 41 percent. Another broad measure of stock performance is Standard & Poor’s Composite Index (S&P 500)Market index of the stocks of five hundred large U.S. companies., which lists the stocks of five hundred large U.S. companies. It followed the same pattern as the Dow and the NASDAQ Composite and declined by 37 percent in 2008.
Figure 13.10 NASDAQ for Ten-Year Period Ended May 2008
When the stock market is enjoying a period of large stock-price increases, we call it a bull marketPeriod of large stock-price increases.; when it’s declining or sluggish, we call it a bear marketPeriod of declining or sluggish stock prices.. The year 2008 was definitely a bear market.
How to Read a Stock Listing
Businesspeople—both owners and managers—monitor their stock prices on a daily basis. They want the value of their stock to rise for both professional and personal reasons. Stock price, for example, is a sort of “report card” on the company’s progress, and it reflects the success of its managers in running the company. Many managers have a great deal of personal wealth tied directly to the fortunes of the companies for which they work.
If you have any interest in investing, you’ll want to know how to interpret stock market information. Step one is learning how to read a stock listing like those printed daily in the Wall Street Journal and other newspapers. Figure 13.11 "Stock Listing for Hershey Foods" reports the information on Hershey Foods for December 31, 2008. Let’s use the explanations in Table 13.1 "Interpreting a Stock Quotation" to examine each item in greater detail.
Figure 13.11 Stock Listing for Hershey Foods
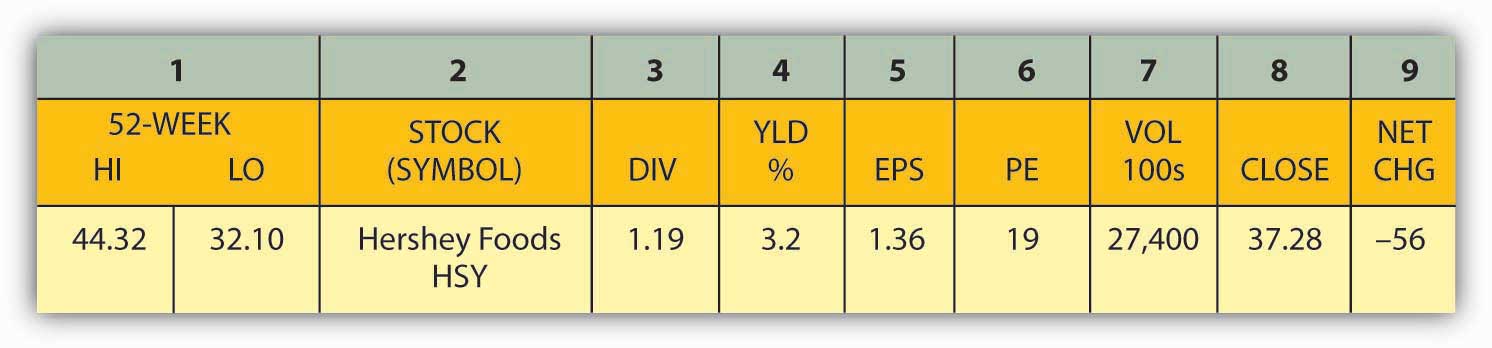
Table 13.1 Interpreting a Stock Quotation
| 52-WEEK HI | The highest price during the past year (January 30, 2008, to January 30, 2009) was $44.32. |
| 52-WEEK LO | The lowest price during the past year was $32.10. |
| STOCK (SYMBOL) | The listing is for Hershey Foods, whose stock symbol is “HSY.” |
| DIV | HSY pays an annual dividend of $1.19 on each share of stock. |
| YLD % | HSY’s dividend provides each investor with a 3.20 percent return (or dividend yield), as based on the day’s closing stock price ($1.19 ÷ $37.28 = 3.2%). |
| EARNINGS PER SHARE | EPS is total profits divided by the number of shares of common stock outstanding. EPS for Hershey for 2008 is $1.36. |
| PE | The price-earnings (PE) financial ratio determines the amount that an investor would be willing to pay for every dollar of the company’s earnings. This is a relative measure for comparing companies. For every $1 of HSY’s earnings per share (the company’s annual income divided by the number of shares of stock), investors are willing to pay $19 per share. High-growth firms usually have higher PE ratios, and vice versa. |
| VOL | A common unit size for trading stocks is 100 shares, called a round lot. On January 30, 2008, 27,400 round lots were traded; in other words, the volume of HSY shares traded was 2.74 million shares (27,400 × 100). |
| CLOSE | HSY is traded on the New York Stock Exchange, which opens at 9:30 a.m. and closes at 4:00 p.m. every business day. Throughout the day, the price of HSY stock fluctuates, and at the end of the day, it stood at $37.28. |
| NET CHG | The price of $37.28 is down by $0.56 from the previous trading day’s close, which was $37.84. |
What, exactly, does Hershey Food’s stock listing tell us? Here are some of the highlights: The stock has done poorly for the past twelve-month period. Its price has dropped by more than 25 percent. The closing stock price of $37.28 falls right in the middle of the annual high of $44.32 and the annual low of $32.10. The company pays an annual dividend of $1.19 per share (which gives investors a fairly good cash return on their stock of 3.20 percent). At its current PE ratio, investors are willing to pay $19 for every $1 of Hershey’s earnings per share.
Key Takeaways
-
Securities markets provide two functions:
- they help companies raise funds by making the initial sale of stock to the public.
- they provide a place where investors can trade previously issued stock.
- Stock sold through an IPO is issued through a primary market with the help of an investment banking firm.
- Previously issued securities are traded in a secondary market, where the proceeds from sales go to investors rather than to the issuing companies.
- The best-known exchanges are the New York Stock Exchange, the American Stock Exchange, and the NASDAQ.
- They’re all regulated by the Securities and Exchange Commission (SEC), a government agency that is charged with enforcing securities laws designed to protect the investing public.
- Stock market trends are measured by market indexes, such as the Dow Jones Industrial Average (DJIA), the NASDAQ Composite Index, and Standard & Poor’s Composite Index (S&P 500).
- When the stock market is enjoying a period of large increases in prices, it’s said to be in a bull market. When prices are declining, it’s often called a bear market.
Exercises
-
(AACSB) Analysis
The three most commonly used stock indices are the DJIA, the NASDAQ composite index, and the S&P 500. To create charts that compare these three indices, go to http://bigcharts.marketwatch.com to link to the BigCharts Web site and take the following steps. (Note: These steps might change if the BigCharts Web site is changed.)
- Click on “Interactive Charting” on the top bar.
- Type in the letters “DJIA” on the left sidebar.
- For “Time Frame,” select “1 decade” and then “quarterly.”
- For “Compare to,” select “NASDAQ.”
- Click on “Chart Style” and select “Mountain” and “blue and white.”
- Return to the top of the sidebar and click on “Draw Chart.”
- Print out the chart using the “Printer Friendly” format option.
Repeat this process to compare the DJIA with the S&P 500. Then, answer the following questions:
- Which two indices tend to follow similar patterns—DJIA and NASDAQ, or DJIA and S&P?
- What accounts for this similarity? What types of companies does each index track? How many companies does each cover?
- Which index had a large peak? What accounts for that peak?
- Which index do you prefer for tracking the movement of the stock market? Why?
-
Below is a stock listing for P&G for January 30, 2009. This information appears daily in the Wall Street Journal and other newspapers. It’s also available online on such Web sites as Yahoo! Finance.
YTD % CHG 52 WEEK HI 52 WEEK LO STOCK (SYMBOL) DIV YLD % 0.24 73.57 53.77 Procter & Gamble PG 1.60 2.9 EPS PE VOL 100s CLOSE NET CHG $3.75 15 35,111 54.50 0.24 To assess your ability to read and interpret this information, explain each item in the stock listing.